Abstract
As the challenges toward increasing water for irrigation become more prevalent, knowledge of crop yield response to water can facilitate the development of irrigation strategies for improving agricultural productivity. Experiments were conducted to quantify maize yield response to soil moisture deficits, and assess the effects of deficit irrigation (DI) on water productivity (water and irrigation water use efficiency, WUE and IWUE). Five irrigation treatments were investigated: a full irrigation (I1) with a water application of 60 mm and four deficit treatments with application depths of 50 (I2), 40 (I3), 30 (I4), and 20 mm (I5). On average, the highest grain yield observed was 1008.41 g m−2 in I1, and water deficits resulted in significant (p < .05) reduction within range of 6 and 33%. This reduction was significantly correlated with a decline in grain number per ear, 1000-grain weight, ear number per plant, and number of grain per row. The highest correlation was found between grain yield and grain number per ear. The WUE and IWUE were within range of 1.52–2.25 kg m−3 and 1.64–4.53 kg m−3, respectively. High water productivity without significant reduction in yield (<13%) for I2 and I3 compared to the yield in I1 indicates that these water depths are viable practices to promote sustainable water development. Also, for assessing the benefits of irrigation practices in the region crop water production functions were established. Maize yield response to water stress was estimated as .92, suggesting the environmental conditions are conducive for implementing DI strategies.
classification:
Introduction
Maize (Zea mays L.) is one of the most important crops in the world, ranking third behind rice and wheat (WMO, Citation2012). It’s versatility as a food source, feed source, and fuel source characterize it as crop that can contribute immensely to food security and a country’s food self-sufficiency given its economic and social value. Global production of maize has increased tremendously over the last few decades, and it is now the most widely produced cereal crop with an overall production of approximately 1006.18 million tonnes (FAO-AMIS, Citation2016). However, production constraints, reliance on natural resources base such as rainfall, insufficient water for irrigation purposes, inadequate infrastructure or limited technological options, and lack of financial resources are some of the challenges faced by many developing countries in maize production, often resulting in low or even declining production levels (WMO, Citation2012).
In Taiwan, maize production levels have declined by as much as 80% over the last decade (Coa, Citation2011). One possible reason for this decrease is the increase in rice production (Republic of China-Executive Yuan, Citation2016). Paddy rice production is approximately 1.73 million tonnes (2014 estimate) (Republic of China-Executive Yuan, Citation2016). With the dire need to improve Taiwan’s overall food security and food self-sufficiency, the production of maize is being promoted (Perng, Citation2013). However, water for irrigation would play a pivotal role in increasing the production given that maize crop typically has high water requirements and lack of rainfall is a characteristic feature of one of the main cropping seasons. In fact, Sakthivadivel et al. (Citation2001) noted that owing to its geographical location, the island experiences extreme spatial and temporal distribution of rainfall necessitating irrigation for crop production, and Pascual and Wang (Citation2016) highlighted that only a small portion of the abundant rainfall is accessible. A water intensive rice industry (Greaves & Wang, Citation2016), increasing industrial and commercial development (Cheng & Liao, Citation2011), and the dire implications of climate change for the island (Chang, Citation2002; Wu et al., Citation2013) are some of the challenges that would influence the water available for irrigation. As the challenges toward water availability for agriculture become more prevalent, crop production demands the maximum use of every drop of water thus necessitating analysis of water productivity to assess the benefits of irrigation strategies (Araya et al., Citation2011; Fereres & Soriano, Citation2007).
Ferreira and Gonçalves (Citation2007) highlighted that a practical way of assessing the benefits of irrigation is through the development of the relationship between yield and water supply. In general, functions relating crop production to water use can be categorize into two groups: water production functions (WPF) and crop water production functions (CWPF) (Igbadun et al., Citation2007; Kipkorir et al., Citation2002). The WPF represents the relationship between yield and seasonal water applied, while the relationship between yield and seasonal evapotranspiration (ET) represents CWPF (Al-Jamal et al., Citation2000; Kipkorir et al., Citation2002). These authors explain that the WPF is generally linear in deficit irrigation (DI) since all the applied water is used as ET, while in the non-deficit range WPF is nonlinear. On the other hand, CWPF’s are often described as a linear function (Al-Jamal et al., Citation2000; Kipkorir et al., Citation2002), although several studies have reported curvilinear relationships (Evett et al., Citation1996; Sepaskhah & Ilampour, Citation1996). The curvilinear relationship is generally indicative of water wastage or excessive irrigation as it implies that the crop did not use all of the applied water because some was lost as deep percolation (Kipkorir et al., Citation2002), and or increasing water application occurred without a corresponding increase in yield (Liu et al., Citation2002).
Both functions are beneficial in water management applications and for evaluating irrigation strategies. Al-Jamal et al. (Citation2000) and Liu et al. (Citation2002) observed that these functions are useful in determining water demand for irrigation projects, optimal water use on individual farms, and the capacity of irrigation systems. Ferreira and Gonçalves (Citation2007) and Patel and Rajput (Citation2007) highlighted that these functions can be used to assess the financial benefits of irrigation strategies. Also, as CWPF expresses crop yield as a function of total water use, it allows field quantification of water use efficiency (WUE), thus providing a simple means of judging the potential benefits of irrigation strategies (Ferreira & Gonçalves, Citation2007). All the above-mentioned studies have stated that these functions are not unique but vary among varieties, crops and climate zones, and highlights that site-specific CWPF should be established.
CWPF’s are usually expressed on a relative basis, where the yield response factor (Ky) is the quantitative estimate used to establish the relationship between evapotranspiration deficits and yield depression. In other words, the response of a crop to its soil moisture environment is quantified through Ky. Thus, the Ky-approach provides an efficient, time effective, and reliable means of simulating crop yield in response to water stress for a specific region (Shrestha et al., Citation2010). Doorenbos and Kassam (Citation1979) reported Ky values for several crops. As values of Ky represent a crop sensitivity factor to drought, existing CWPF’s and Ky values for a specific crop are non-transferable since they are influenced by localized climatic conditions and soil and water management conditions (Ferreira & Gonçalves, Citation2007; Igbadun et al., Citation2007). Therefore, there is a need to develop and evaluate the performance of CWPF for different crops and in specific environments to aid in sustainable development of irrigation water management strategies.
The objectives of this study were: to evaluate yield response of maize to varying levels of soil moisture deficit; to estimate and evaluate water productivity of maize under regulated deficit irrigation (DI) management to determine a suitable DI regime for optimal water-saving and yield output; and to examine WPF and develop CWPF for maize in the tropical region of southern Taiwan.
Material and methods
Site characteristics and climatic growing environment
Two field experiments were conducted in southern Taiwan at the irrigation site of National Pingtung University of Science and Technology (22.65°N, 34.95°E: 71 m above sea level) from November to March for 2014 to 2015 (2014/2015) and 2015 to 2016 (2015/2016). This autumn cropping period is generally characterized by lack of rainfall and is one of the main cropping seasons in this location as summer months, providing on average better temperatures for maize growth, coincide with the humid rainy season and is often subject to several storms and typhoons (Tfwala & Wang, Citation2016).
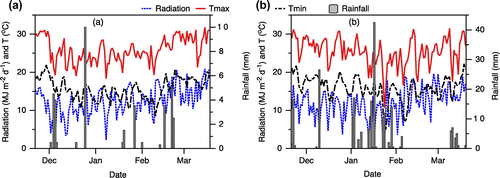
An automated weather station at the experimental site was used to measure weather variables. Seasonal variation in weather conditions for both cropping season is depicted in Figure . Total recorded precipitation for the 2014/2015 cropping season was 40 mm while 214 mm was observed for the 2015/2016 season. This rainfall recorded during the 2015/2016 season is uncharacteristic to that observed for the study location; total average long-term rainfall for the same cropping period is about 65.4 mm. Seasonal mean incident solar radiation was approximately 14.9 and 13.9 MJ m−2d−1 in 2014/2015 and 2015/2016, respectively. The average air temperature during both seasons was about 20 °C. In 2014/2015, the mean daily maximum and minimum temperature ranged from 15.5 to 31 °C and 10.6 to 24.5 °C, respectively, while for the 2015/2016 season the respective range was 10.7 to 31.5 °C and 5.1 to 22.2 °C.
Figure 1. Daily variation in solar radiation, maximum air temperature (Tmax), minimum air temperature (Tmin), and rainfall during the (a) 2014/2015 and (b) 2015/2016 growing season.
Soil at the site is classified as loamy (27% sand; 24% clay) with a bulk density of 1.4 g cm−3. Volumetric water content values for a 1 m soil profile depth at permanent wilting point (PWP) and field capacity (FC) equals 15 and 30.5%, respectively, which results in a total available water of 155 mm per 1 m soil.
Management practices
The experimental area consisted of 15 equal plots of size 10 m2 which was managed similarly over the 2 seasons. To avoid interaction effects, soil levees .30 m high and 1 m wide were used to create a buffer zone between experimental plots. The field was prepared manually and planting was done on flat basins. Treated maize seeds (local variety Bright Jean No.2) were sown in holes .05 m deep on 22 November 2014 and 21 November 2015 in .40 m rows, at a plant density of 8.3 plants m−2. Fertilizer (275, 125, and 125 kg ha−1 of N, P2O5, and K2O) was applied over the entire field in three applications: pre-planting, around the fourth leaf stage and around tasseling. Insects and diseases were rigorously controlled during the cropping season and plots were hand weeded when necessary.
Experimental design
Five irrigation treatments consisting of a full irrigation treatment (I1, and referred to as reference treatment) and four deficit treatments were evaluated. There were three replicates per treatment arranged in a randomized complete block design. Aimed at reproducing common agricultural practices in the area, no treatment included zero amounts of irrigation and the treatment variation was based only on the amount of irrigation water applied irrespective of maize phenological growth stage. Predefined water application depths were assigned to each treatment. Table summarizes the different irrigation regimes employed.
Table 1. Description of the experimental treatments for both seasons.
In an effort to maximize use of in-season rainfall, the irrigation scheduling was based on the concept of soil moisture depletion of total available soil water (TAW) in the soil profile (Panda et al., Citation2004). It was hypothesized that since varying water depths was employed different levels of stress would develop in the treatments. Irrigation was initiated for all treatments whenever the soil moisture in the I1 reference plot was depleted by 40%. That is, in the deficit-irrigated treatments irrigation occurred on the same day as the fully irrigated plots, but the duration of irrigation application was reduced to obtain the predefined water depths. Due to the heterogeneity of soils, crop water uptake, climate influence, and soil hydraulic properties, soil moisture is spatially variable and can result in significant day to day fluctuations of soil moisture readings, with implications for irrigation scheduling (Feki et al., Citation2016). Thus, in the study an error interval of ±.5% for soil moisture readings were considered for irrigation scheduling. To maintain a level of consistency, soil moisture readings estimated at 2 pm was used to schedule irrigation water application.
The 40% depletion criterion used for irrigation scheduling was determined from soil moisture sensors, EnviroScan system (Sentek Technologies, Stepney, Australia). The percentage depletion of available soil water in the root zone was estimated as (Igbadun et al., Citation2008):
(1)
where n is the number of subdivisions of the effective rooting depth used in the soil moisture sampling, FCi is the soil moisture at field capacity for ith layer; θi is the soil moisture in ith layer; and WP is the soil moisture at PWP. The soil moisture sensors were installed in two replicate per treatment through PVC access tubes, and the system was connected to an automatic datalogger (Model CR1000; Campbell Scientific, Inc., Utah, USA). Daily soil water content (SWC) was computed as the average of all reading output for that day. Sensors were installed every .10 m up to 1 m. Sensors were installed early in the season after plant emergence to avoid plant damage.
Irrigation treatment management was not activated at planting to the five leaf growth (V5) to allow the crops to be established before being subjected to moisture stress (Kuscu et al., Citation2013). Here, all treatments received approximately 75 mm of water (over approximately 3–4 weeks) to establish good crop stand. Thus, treatment management of irrigation water application began from maize six leaf (V6) growth stage. There were 8 and 5 irrigation events in 2014/2015 and 2015/2016, respectively. The corresponding total irrigation water applied (sum of the initial amounts of water applied for plant establishment and the amount under the treatment management) in treatments I1, I2, I3, I4, and I5 were 555, 475, 395, 315, and 235 mm, respectively, in the 2014/2015 season experiments, and 375, 325, 275, 225, and 175 mm for treatments I1, I2, I3, I4, and I5, respectively in the 2015/2016 experiments. Surface irrigation method was used to deliver water to the crops in both seasons. The treatments were irrigated by flooding each plot with water from a constructed pipe system and the use of water meters.
Computation of crop evapotranspiration
The actual daily crop evapotranspiration (ETc) under the different water regimes was calculated using the water balance model given in Equation Equation2(2) (Kuscu et al., Citation2013):
(2)
where I is the irrigation; P the rainfall; D is the drainage; R is the run-off; and = change in soil water storage. All terms are expressed in millimeter of water in the crop root zone. D was monitored using the gravimetric method periodically. Gravimetric sampling was done for a maximum depth of 1.6 m (from 1 to .2 m intervals). In general, D was equal to zero as gravimetric sampling beyond the 1 m root zone indicated that changes in the SWC was very small (negligible). R was assumed zero because irrigation water application was controlled and the experimental plots were surrounded by 1 m wide levees around its perimeter with basins were meticulously prepared to be level. ΔW was estimated from measured soil moisture data obtained by the EnviroScan system using (Igbadun et al., Citation2007):
(3)
where SWC1i and SWC2i are the volumetric SWC at the time of first sampling and second sampling in the ith soil layer, respectively; Di is the depth of ith layer; and n = number of soil layers sampled in the root zone depth. Growing season ETc was calculated as the summation of daily ETc.
Measurement of agronomic parameters and development of water and CWPF
In the study, some maize morphological measurements were taken and included plant height, ear length, ear diameter, and leaf area index (LAI). Ear length and diameter was measured from a sample of randomly selected ears at harvest in each replicate per treatment using a standard meter rule and vernier caliper. In both experiments, eight randomly selected plants per replication for each treatment were tagged for measurements of the plant height and LAI. Plant height was determined by measuring the distance between the soil surface and the tip of the longest leaf (before tasseling). Maize maximum LAI was measured at flowering using the following equation (Yi et al., Citation2010):
(4)
where leaf area (m2 plant−1) was estimated by multiplying the manually measured length and maximal width of each leaf of each tagged plant with the shape factor (k = .75) for maize (Yi et al., Citation2010).
At harvest, the ears from plants within the middle of each plot were used to analyze the effect of the irrigation treatments on grain yield and yield components. Grain yield (adjusted for 15% moisture content (Djaman et al., Citation2013)), 1000-grain weight, grain number per ear, ear per plant, number of grain per row, and the number of rows were estimated for each treatment. To determine 1000-grain weight, two 1000-grain samples were randomly selected from shelled ears in each plot and were weighed by a digital scale.
For both years, WPF’s and CWPF’s were determined by linear regression of the grain yield to the total water applied (rainfall + irrigation) and to total crop water use (ETc), respectively. In addition, the effect of water stress on yield was quantified by the calculating the yield response factor (Ky) (Doorenbos & Kassam, Citation1979):
(5)
where Ym and ETm are the maximum yield and maximum ET, respectively; obtained from the fully irrigated treatment I1; Ya and ETa are, respectively, the actual yield and actual ET for the deficit treatments (I2–I4); and (1 − Ya/Ym) is the relative yield decrease to the corresponding relative ET deficit (1 − ETa/ETm).
Assessment of water productivity
The water productivity concepts used are those defined by Araya et al. (Citation2011) and Payero, Tarkalson, Irmak, Davison, and Petersen (Citation2009). The total water productivity, also known as the water use efficiency (WUE, kg m−3) and the irrigation water productivity (IWUE, kg m−3) was estimated as:
(6)
(7)
where Ya is the actual yield achieved (g m−2) for the various irrigation treatments, and all terms as previously defined in millimeter.
Statistical analysis
Comparisons of grain yield and yield components among treatments for both seasons were performed by analysis of variance (ANOVA) in IBM SPSS, version 22 (IBM corp., NY, U.S.A.). Treatment means were separated using Duncan’s new multiple range test (DMRT) at the 5% significant level. The relationships between yield and water applied and water use were determined using linear regression, and correlation analysis was used to determine the associations between grain yield and its components.
Results and discussion
Soil moisture environment
Seasonal variation in SWC within the 1 m depth for the different irrigation treatments are presented in Figure . As can be observed, the SWC was close to FC during the 2014/2015 cropping season at the start of the experiment while it was lower in 2015/2016, and in both experiments SWC was greater in treatments receiving more irrigation water. Based on the 40% depletion criteria in I1, for the 2014/2015 season the first water application occurred on 2 January, and the final application was done on 6 March (41 and 105 days after planting (DAP), respectively). For the 2015/2016 season, the first and last application occurred on 29 December (37 DAP) and 5 March (104 DAP), respectively. The distinct increase in soil moisture content for the 2015/2016 experiment occurring mid-season shown in Figure was due to rain events. Owing to the temporal distribution of rainfall between the two seasons (Figure ), the trend in SWC was different in both years. And, there is a slight variation in soil moisture measurements for the fully irrigated treatment I1 between seasons indicating irrigation timings, which can be attributed to the fact that soil moisture is spatially variable. However, the timings for irrigation scheduling for both experiments fell within the range of volumetric water content indicating the 40% depletion criterion (24.5 ± .5%). Due to the heterogeneity of soils, atmospheric forcing, crop water uptake, and water movements within the soil due to soil hydraulic properties, soil moisture is spatially variable, and can result in significant day to day fluctuations of soil moisture readings, with implications on irrigation scheduling. This was highlighted by Feki et al. (Citation2016) and Irmak et al. (Citation2002) who reported that soil hydraulic properties are subject to diverse physical and chemical changes over space and time as well during the cropping cycle that often leads to variability in water movements within the soil which influences soil water availability and soil moisture measurements. Further, some studies have suggested that the variance in soil moisture measurements increases in drier soil conditions (Oldak et al., Citation2002; Vereecken et al., Citation2007), and perhaps this may also account for the slight mismatch in soil moisture readings for the I1 treatment between seasons. A wetter soil profile was maintained during the 2015/2016 season on account of the rainfall events.
Figure 2. Seasonal variation in SWC for the different irrigation treatments prior to irrigation application for (a) the 2014/2015 and (b) the 2015/2016 cropping season.
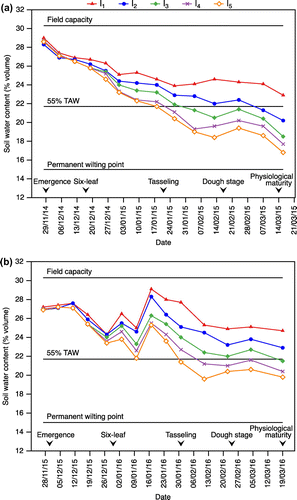
For both seasons, the SWC was replenished to above 90% of FC after water application in the fully irrigated treatment, I1, except after about 105 DAP in the 2014/2015 cropping season. Higher crop water uptake depleting soil water from lower soil profile depths can account for this. On average, during the 2014/2015 season the mean SWC in I1 varied from about 90% of TAW in the soil profile at the beginning of the drought imposition to about 60% TAW at the end of this period. For the 2014/2015 season, mean SWC in I1 varied from about 93% of TAW at the end of the irrigation period to about 63% TAW at the end of a drying cycle. This is an indication that no stress occurred for this treatment as the typical allowable depletion of 55% TAW (Allen et al., Citation1998) before crop water stress occurs for maize was not exceeded. In contrast, the mean SWC for treatments I2–I5 was consistently lower, decreasing as the season progressed. The mean SWC ranges, as a percent of TAW, between the end and start (after irrigation) of the drying cycle was 55–87% for I2, 51–84% for I3, 48–81% for I4, and 46–78% for I5 (2 year averages). During the 2014/2015 season, the SWC in treatments I4 and I5 approached the 55% TAW stress threshold level for maize from about 64 DAP (Figure ). Also, soil moisture monitoring indicated that the SWC for I3 fell below the stress threshold for maize from about 74 DAP. However, irrigation water application temporarily relieved the soil moisture stress resulting in the SWC increasing above the threshold. This trend continued for I3 for the remainder of the growing season. For the 2015/2016 season, I4 and I5 approached the stress threshold level from about 75 DAP.
Effect of irrigation on morphological traits, grain yield, and yield components
Morphological traits
The effect of the different irrigation treatments on some maize morphological traits are presented in Table . In general, Duncan’s test statistic indicated there were no significant differences at the 5% significant level in plant height under the different irrigation water amounts for both cropping seasons. This implies that in this study the soil moisture deficits during vegetative growth and development had only a small effect on internodes elongation, which supports the finding in some studies (Djaman et al., Citation2013; Elzubeir & Mohamed, Citation2011). In contrast, some studies reported that water stress significantly affected maize plant height where deficit irrigation typically resulted in shortened plants (Aydinsakir et al., Citation2013; Çakir, Citation2004; Karasu et al., Citation2015).
Table 2. Effect of irrigation on some morphological traits of maize.
The irrigation treatments significantly affected maize LAI (Table ). The maximum LAI observed at flowering for the fully irrigated treatment I1 was 5.83 and 6.05 m2 m−2 during the 2014/2015 and 2015/2016 season, respectively. On average, the relative reduction in maximum LAI for the deficit treatments ranged between 7.6 and 29.6%. Farré and Faci (Citation2006) observed that leaf expansion is usually the first process to be affected by water deficits.
Data presented in Table also show that ear length and diameter were significantly affected by the water treatments. In general, as the applied irrigation amount increased, the ear diameter and length also increased. The average ear length and diameter ranged from 14.83 to 18.27 cm and 3.93 to 4.68 cm, respectively, over the two cropping seasons. These results are similar to those reported in some studies (Aydinsakir et al., Citation2013; Karasu et al., Citation2015; Moosavi, Citation2012), while others have reported that irrigation water amount does not significantly affect these parameters (Elzubeir & Mohamed, Citation2011; Yazar et al., Citation2009). According to Moosavi (Citation2012), maize ear diameter is closely associated with the assimilate produced by photosynthesis, which varies markedly with water stress. Thus, the result of the study implies that for the deficit irrigated treatments lower amount of assimilate was produced by photosynthesis which perhaps affected cob growth and thus final ear diameter.
Grain yield
The irrigation levels significantly impacted maize grain yield for both cropping seasons (Table ). As can be observed from the table, grain yields decreased as the amount of irrigation water applied decreased. The highest yield, averaging 911.26 and 1105.55 g m−2 in 2014/2015 and 2015/2016, respectively, was measured in the fully irrigated treatment, I1, while deficit treatment I5 produced the lowest yield of 567.13 and 792.46 g m−2 in 2014/2015 and 2015/2016, respectively. Yields for the other treatments fluctuated between these two treatments. There were significant yield differences among some treatments during both years. In 2014/2015, although there was 14 and 29% difference in irrigation water for treatment I2 and I3, respectively, relative to the water applied in I1, the grain yield reduction of 8.6 and 10.5% was not statistically different. The yield reduction of 25.1 and 37.7% in I4 and I5 was significantly different to the yield in I1. In 2015/2016, significant differences in yields by as much as 23% in I4 and 28% in I5 were observed. The observed significant yield depression for deficit treatments I4 and I5 in both seasons indicate that crops in these treatments were more severely stressed than those in I2 and I3, and plants in these treatments were under water stress earlier during critical growth stages (Figure ). Katerji et al. (Citation2008) reported that the critical growth stages which are sensitive to water deficits include the flowering stage (tasseling, silking, and pollination) and grain filling. Therefore, the result suggests that the water application depth of 30 and 20 mm for I4 and I5 was not adequate to maintain a wet soil profile and reduce crop water stress, and may not be a viable irrigation strategy given the significant reduction in grain yield.
Table 3. Effect of irrigation on yield and yield components in the different treatments for both seasons.
Between years there were noticeable differences in the yield procured (Table ). This outcome has also been observed in other deficit studies for maize crop (Djaman et al., Citation2013; Igbadun et al., Citation2008). Higher yields were obtained for the 2015/2016 in all treatments compared to the 2014/2015 season. This result can be attributed to the spatial and temporal variation in SWC on account of rainfall events. During the 2015/2016 season, mid-season rainfall (totaling 59 mm 55 to 57 DAP and frequent rainfall events between 57 and 70 DAP, Figure ) significantly improved soil moisture conditions, and this would have reduced the impact of water deficits on yield potential of maize. This is supported by the findings of Irmak et al. (Citation2002) who observed that the spatial variability of site-specific available soil water is a key factor that affects crop yield, and crop yield differ from year to year, even for the same period, because of spatial variations in SWC. Additionally, the improvement in the soil moisture content during the 2015/2016 season coincided with some critical growth stages for maize crop (Figure ), the flowering and reproductive period, and this may have contributed to the variation in yields between the two seasons.
Yield components
According to Fageria et al. (Citation2006), yield is composed of physical components that directly relate to the amount of grain produced by the crop and can be categorized based on to their effect on grain yield. Fageria et al. (Citation2006) and Lauer (Citation2006) observed that primary yield components have a direct effect on final maize yield and include the kernels per ear, kernel weight and number of ears per square meter (or ears per plant). On the other hand, yield components that are considered as secondary are those that indirectly effect yield through their effect on primary components, and include rows per ear and kernels per row.
Table shows the mean effect of water treatments on maize primary yield components for both seasons. The results indicated that irrigation treatments had a significant (p < .05) effect on the kernel number. Data in the table show that the grain number per ear decreased with increasing deficiency in irrigation water. These observations have also been reported in other studies for maize (Aydinsakir et al., Citation2013; Karasu et al., Citation2015; Moosavi, Citation2012). In contrast, Elzubeir and Mohamed (Citation2011) observed that irrigation water amounts did not affect the number of kernel per ear for two cropping seasons and showed that irrigation intervals would have a more significant impact on this yield component. There were also significant differences in 1000 grain weight among different irrigation treatments (Table ). On average, 1000 grain weight varied from 165.06 to 256.17 g in the 2014/2015 season and from 191.97 to 286.06 g during the 2015/2016 season. Reductions of 1000 grain weight owing to soil water deficits have also been reported by Aydinsakir et al. (Citation2013), Çakir (Citation2004) and Karam et al. (Citation2003), while some studies have reported that irrigation water amounts does not cause significant differences in grain weight (Elzubeir & Mohamed, Citation2011; Yazar et al., Citation2009). Aydinsakir et al. (Citation2013) reported that reduction in 1000 grain weight can be attributed to low transition of photosynthesis matter and assimilates to kernels. In this study, significant testing indicated that there was no significant difference in the number of ears produced per plant among the different treatments.
The effect of the irrigation treatments on secondary yield components is also presented in Table . The data show that the number of grain per row decreased as irrigation water amount decreased, and it varied significantly among the irrigation treatments. In both seasons, the highest number of grain per row was obtained from treatment I1, with an average of 34.73, while the lowest was obtained from treatment I5 averaging 26.95. Although, the number of rows per ear generally decreased with decreasing water application, Duncan’s test statistic indicated that the treatment means were not significantly different (Table ). This result is similar to that reported by Elzubeir and Mohamed (Citation2011), but is contrasting to the results of Karasu et al. (Citation2015) who reported that the water stress significantly reduced the number of rows per ear in deficit irrigated maize.
Correlations between grain yield and yield components
The correlation coefficient between yield components and final grain yield and total water applied is presented in Table . Except for number of ears per plant, the importance of the primary components to the grain yield was noted in this study, supporting the findings of Fageria et al. (Citation2006) and Lauer (Citation2006). Strong and significant associations were observed between grain yield and grain number per unit ear. Similar observations have also been reported in the literature (Karasu et al., Citation2015; Moosavi, Citation2012; O’Neill et al., Citation2004; Otegui et al., Citation1995). Additionally, some of these studies have indicated that the number of kernels per ear had highest correlation with grain yield, which was confirmed in this study. Data from the table also show strong and significant associations between grain yield and 1000 grain weight. This result is similar to the findings of some studies (Karasu et al., Citation2015; Moosavi, Citation2012; O’Neill et al., Citation2004), but is contrasting to the observations of Otegui et al. (Citation1995) who reported no correlation between these variables. Ear number per plant was observed to be positively and significantly correlated with the grain yield but the strength of the association was weaker (r = .382) than the other primary components. Some studies have reported no correlation relations between these two variables (Milander, Citation2015). Further, similar to the findings Karasu et al. (Citation2015) and Milander (Citation2015), strong and significant relations were observed between yield and number of grains per row, which could be attributed to the strong relation between grain number per ear and number of grain per row (r = .904).
Table 4. Correlations between yield, yield components, and total water applied (irrigation + rain) for the two growing seasons.
Crop evapotranspiration and water productivity
The seasonal ETc varied in both years for the different irrigation treatments. Crop water use for treatments I1, I2, I3, I4, and I5 was 605, 526, 455, 383, and 331 mm, respectively, in 2014/2015. In the 2015/2016 season, the respective values for these treatments were 570, 516, 464, 423, and 352 mm. The marked differences observed among the treatments, can be attributed to the large difference in irrigation water applied. During the first experiment, crop water consumption was dominated by irrigation water applied since the total rainfall for the entire cropping season was only 40 mm.
The estimated WUE and IWUE for each treatment in both cropping seasons are presented in Table . The WUE ranged from 1.52 to 1.79 kg m−3 during the 2014/2015 season and from 1.94 to 2.25 kg m−3 in the 2015/2016 season. On average, the highest and lowest WUE values were observed for treatment I3 and I1, respectively. The ranges of WUE obtained in this study are higher than those reported for irrigated maize crop in some studies (Igbadun et al., Citation2008; Oktem et al., Citation2003), but falls within the range reported in the literature. According to Yazar et al. (Citation2009), globally measured average WUE values per unit water depletion is 1.80 kg m−3 for maize, with a typical range of 1.1–2.7 kg m−3. Additionally, between years there is a distinct difference in WUE values, where the values were higher for the 2015/2016 season. Similar findings have been reported in some studies (Igbadun et al., Citation2008; Pandey et al., Citation2000). This result can be attributed to the noticeable difference in grain yield between the years on account of the improved soil moisture environment due to in-season rainfall (as previously discussed). Generally, crop WUE are influenced by crop yield potential, crop environment, and climatic characteristics of a region. Data from the table show that for both cropping seasons IWUE increased with decreasing irrigation amount, being higher in the 2015/2016 season. In 2014/2015, the IWUE was within range of 1.63 and 2.41 kg m−3, while for the 2015/2016 season the range was between 2.95 and 4.53 kg m−3. Again, the higher values for the 2015/2016 season were due to the higher in-season rainfall reducing the need for irrigation.
Table 5. Total WUE, irrigation water use efficiency (IWUE) and water savings for the different irrigation treatments.
The values estimated for both the WUE and IWUE have some very important implications. Under a limited water supply situation where the goal may be to achieve the highest possible WUE, utilizing a water application depth of 40 mm (I3) at each irrigation event offers opportunities for water savings. In other words, utilizing this water application depth offers water savings of 28% (Table ) compared to the fully irrigated treatment without any significant yield penalty. Similarly, utilizing an application depth of 50 mm (I2) compared to the 60 mm in I1 is another viable alternative for improving farm level water use given the average 14% in water savings. If the objective is to maximize yield, crop ET would need to be about 588 mm (2 year average), or 28% greater than the water use at maximum WUE.
Yield production functions and yield response to water stress
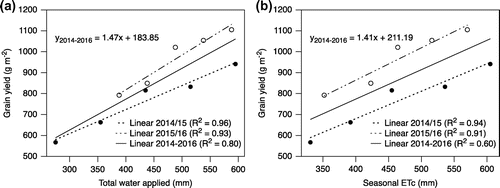
The WPF for maize is depicted in Figure (a). In both years, yields increased linearly with the total depth of water applied between planting and harvest. Field measured data for the two seasons were pooled to establish the relationship with an overall R2 of .80. Igbadun et al. (Citation2007) and Yazar et al. (Citation2009) also reported significant linear relationships between grain yield and seasonal water applied for maize, and similar observations have been made for other crops like potatoes (Ferreira & Gonçalves, Citation2007). The linear relation observed in the model suggests that yield reduction would occur as water applied decreases. The results are also supported by the findings of Igbadun et al. (Citation2008) and Lamm et al. (Citation1995) who reported that deficit irrigation definitely reduces yield of maize crop irrespective of growth stage of water deficits. In contrast, Kipkorir et al. (Citation2002) reported curvilinear WPF for maize grown in Kenya. Fereres and Soriano (Citation2007) noted that curvilinear relations are typically observed when all the water are not used in ET and some are lost. In our study, irrigation water applied was lower than estimated ETc for all treatments. The relationship between grain yield and seasonal ETc was used to determine the CWPF (Figure (b)). The linear relation observed produced an R2 value of .60 for the pooled data with much stronger values on a year-to-year basis. These findings are similar to those reported in other studies for maize crop (Çakir, Citation2004; Djaman et al., Citation2013; Igbadun et al., Citation2007; Kipkorir et al., Citation2002). In contrast, Yazar et al. (Citation2009) reported significant second degree polynomial relations between grain yield and seasonal ET. The lower R2 value obtained for the pooled data indicates a greater variability between years.
Figure 3. Relationships between (a) yield and total water applied (irrigation + rainfall) and (b) yield and seasonal evapotranspiration (ETc) for the different irrigation treatments during the 2014/2015 (filled circles) and 2015/2016 (open circles) season.
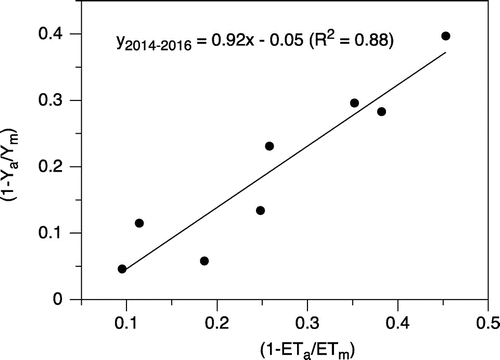
Maize yield response to water stress was obtained from the relationship between seasonal yield reduction and the corresponding seasonal ET deficit (Figure ). A strong relation between these two variables was obtained from the pooled data (R2 = .88). The slope (Ky, the yield response factor) obtained for maize in the study location was .92. This value is comparatively lower than the values reported by Çakir (Citation2004) (1.25), Doorenbos and Kassam (Citation1979) (1.29) and Payero et al. (Citation2009) (1.50) for maize, but is similar to that reported in some studies (Karam et al., Citation2003; Kuscu et al., Citation2013). As Ky represents a measure of the relative sensitivity of a crop to drought in a particular environment (Ferreira & Gonçalves, Citation2007), Ky = .92 accounts for a grain yield reduction of .92 g per mm of ET deficit, and being <1 indicates that DI management strategy can be employed in the study location as an effective and practical water management strategy. Araya et al. (Citation2011) noted that values for Ky above 1 indicate that the crop is sensitive to moisture stress, whereas values below 1 indicate that the crop can tolerate some levels of moisture stress in its growing environment.
Figure 4. The relationship between seasonal yield depression and seasonal water deficit for maize for the two cropping seasons.
Conclusion
Soil water availability is a major limiting factor in agricultural production systems. Knowledge of crop response to water supply, full and limited, in localized environments can aid in the development of effective irrigation strategies for improving farm level water management and crop productivity. Based on a 40% soil moisture depletion criterion of total available water in the root zone, a water application depth of 60–40 mm produced high grain yields while a 30 and 20 mm water application depth was insufficient to maintain a wet soil profile, resulting in significant (p < .05) reduction in yield within range of 23 and 40%. This reduction was principally due to a decline in grain weight within range of 30 and 36% and a range of 14 and 32% in grain number per ear as a response to water deficits. The results also indicate that to achieve maximum yield crop ET would need to be at-least 588 mm, and owing to seasonal rainfall variability supplementary irrigation should be applied to ensure at least 90% of the field capacity is attained. High WUE is attainable without significant yield penalty (application depth of 50 and 40 mm), offering opportunities for improving farm level water use and sustainable water development. The water sensitivity factor for maize (Ky) was estimated as .92. This indicates that maize crop is moderately tolerant to water stress in the study location. Linear CWPF were developed which may be used for yield prediction in response to total water applied or crop water use during the cropping season.
Disclosure statement
No potential conflict of interest is reported by the authors.
Acknowledgments
The authors would like to thank Taiwan’s International Cooperation and Development Fund (ICDF) for their support during the implementation of this study. Sincere gratitude is also extended to Mr. Andre David Williams for his valuable help in the experiments.
References
- Al-Jamal, M. S., Sammis, T. W., Ball, S., & Smeal, D. (2000). Computing the crop water production function for onion. Agricultural Water Management, 46, 29–41.10.1016/S0378-3774(00)00076-7
- Allen, R. G., Pereira, L. S., Raes, D., & Smith, M. (1998). Crop evapotranspiration: Guidelines for computing crop requirements (FAO Irrigation and Drainage Paper No. 56). Rome: Food and Agriculture Organization of the United Nations.
- Araya, A., Stroosnijder, L., Girmay, G., & Keesstra, SD. (2011). Crop coefficient, yield response to water stress and water productivity of teff (Eragrostis tef (Zucc.). Agricultural Water Management, 98, 775–783.10.1016/j.agwat.2010.12.001
- Aydinsakir, K., Erdal, S., Buyuktas, D., Bastug, R., & Toker, R. (2013). The influence of regular deficit irrigation applications on water use, yield, and quality components of two corn (Zea mays L.) genotypes. Agricultural Water Management, 128, 65–71.10.1016/j.agwat.2013.06.013
- Çakir, R. (2004). Effect of water stress at different development stages on vegetative and reproductive growth of corn. Field Crops Research, 89(1), 1–16.
- Chang, C.-C. (2002). The potential impact of climate change on Taiwan’s agriculture. Agricultural Economics, 27, 51–64.10.1111/agec.2002.27.issue-1
- Cheng, C.-L., & Liao, W.-J. (2011). Current situation and sustainability of water resource in Taiwan. In Asian Water Saving Council (pp. 141–148). Shikonkan.
- Coa, E.-Y. (2011). The development of high quality corn industry in Taiwan. Retrieved May 15, 2015, from https://flora.coa.gov.tw/view_eng.php?id=131
- Djaman, K., Irmak, S., Rathje, W. R., Martin, D. L., & Eisenhauer, D. E. (2013). Maize evapotranspiration, yield production functions, biomass, grain yield, harvest index, and yield response factors under full and limited irrigation. American Society of Agricultural and Biological Engineers, 56, 273–293.
- Doorenbos, J., & Kassam, AH. (1979). Yield response to water ( Irrigation and Drainage Paper No.33). Rome: Food and Agriculture Organization of the United Nations.
- Elzubeir, A. O., & Mohamed, A. E. (2011). Irrigation scheduling for maize (Zea mays L.) under desert area conditions-North of Sudan. Agriculture and Biology Journal of North America, 2, 645–651.10.5251/abjna.2011.2.4.645.651
- Evett, S. R., Howell, T. A., Schneider, A. D., Upchurch, D. R., & Wanjura, D. F. (1996). Canopy temperature based automatic irrigation control. In C. R. Camp, E. J. Sadler, & R. E. Yoder (Eds.), Proceedings of the International Conference on Evapotranspiration and Irrigation Scheduling (pp. 207–213). San Antonio, TX: American Society of Agricultural Engineers.
- Fageria, N. K., Baligar, V. C., & Clark, R. (2006). Physiology of growth and yield components. Physiology of Crop Production (pp. 61–94). Binghamton, NY: Food Products Press, an imprint of Haworth Press .
- FAO-AMIS. (2016). Agricultural Market Information System (AMIS). Retrieved December 19, 2016, from https://www.amis-outlook.org/home/en/
- Farré, I., & Faci, J. M. (2006). Comparative response of maize (Zea mays L.) and sorghum (Sorghum bicolor L. Moench) to deficit irrigation in a Mediterranean environment. Agricultural Water Management, 83, 135–143.10.1016/j.agwat.2005.11.001
- Feki, M., Ravazzani, G., Ceppi, A., & Mancini, M. (2016). Assessment of temporal and spatial variability of soil hydraulic properties and its implications on soil water content predictions for a maize field in Northern Italy. EGU General Assembly, Geophysical Research Abstracts, 18, 1569.
- Fereres, E., & Soriano, M. A. (2007). Deficit irrigation for reducing agricultural water use. Journal of Experimental Botany, 58, 147–159.
- Ferreira, T. C., & Gonçalves, D. A. (2007). Crop-yield/water-use production functions of potatoes (Solanum tuberosum, L.) grown under differential nitrogen and irrigation treatments in a hot, dry climate. Agricultural Water Management, 90, 45–55.10.1016/j.agwat.2007.02.012
- Greaves, G., & Wang, Y.-M. (2016). Assessment of FAO AquaCrop Model for simulating maize growth and productivity under deficit irrigation in a tropical environment. Water, 8, 557.10.3390/w8120557
- Igbadun, H. E., Salim, B. A., Tarimo, A. K. P. R., & Mahoo, H. F. (2008). Effects of deficit irrigation scheduling on yields and soil water balance of irrigated maize. Irrigation Science, 27, 11–23.10.1007/s00271-008-0117-0
- Igbadun, H. E., Tarimo, A. K. P. R., Salim, B. A., & Mahoo, HF. (2007). Evaluation of selected crop water production functions for an irrigated maize crop. Agricultural Water Management, 94, 1–10.10.1016/j.agwat.2007.07.006
- Irmak, A., Batchelor, W. D., Jones, J. W., Irmak, S., Paz, J. O., Beck, H. W., & Egeh, M. (2002). Relationship between plant available soil water and yield for explaining soybean yield variability. Applied Engineering in Agriculture, 18, 471–482.
- Karam, F., Breidy, J., Stephan, C., & Rouphael, J. (2003). Evapotranspiration, yield and water use efficiency of drip irrigated corn in the Bekaa Valley of Lebanon. Agricultural Water Management, 63, 125–137.10.1016/S0378-3774(03)00179-3
- Karasu, A., Kuscu, H., Öz, M., & Bayram, G. (2015). The effect of different irrigation water levels on grain yield, yield components and some quality parameters of silage maize (Zea mays indentata Sturt.) in Marmara region of Turkey. Notulae Botanicae Horti Agrobotanici Cluj-Napoca, 43, 138–145.
- Katerji, N., Mastrorilli, M., & Rana, G. (2008). Water use efficiency of crops cultivated in the Mediterranean region: Review and analysis. European Journal of Agronomy, 28, 493–507.10.1016/j.eja.2007.12.003
- Kipkorir, E. C., Raes, D., & Massawe, B. (2002). Seasonal water production functions and yield response factors for maize and onion. Agricultural Water Management, 56, 229–240.10.1016/S0378-3774(02)00034-3
- Kuscu, H., Karasu, A., Oz, M., Demir, A. O., & Turgut, I. (2013). Effect of irrigation amounts applied with drip irrigation on maize evapotranspiration, yield, water use efficiency, and net return in a sub-humid climate. Turkish Journal of Field Crops, 18, 13–19.
- Lamm, F. R., Manges, H. L., Stone, L. R., Khan, A. H., & Rogers, D. H. (1995). Water requirement of subsurface drip-irrigated corn in Northwest Kansas. Transactions of the ASAE, 38, 441–448.10.13031/2013.27851
- Lauer, J. (2006). Corn development. Retrieved November 30, 2016, from https://corn.agronomy.wisc.edu/Management/L011.aspx
- Liu, W. Z., Hunsaker, D. J., Li, Y. S., Xie, X. Q., & Wall, G. W. (2002). Interrelations of yield, evapotranspiration, and water use efficiency from marginal analysis of water production functions. Agricultural Water Management, 56, 143–151.10.1016/S0378-3774(02)00011-2
- Milander, J. J. (2015). Maize yield and components as influenced by environment and agronomic management. University of Nebraska, Lincoln.
- Moosavi, S. G. (2012). The effect of water deficit stress and nitrogen fertilizer levels on morphology traits, yield and leaf area index in maize. Pakistan Journal of Botany, 44, 1351–1355.
- O’Neill, P. M., Shanahan, J. F., Schepers, J. S., & Caldwell, B. (2004). Agronomic responses of corn hybrids from different eras to deficit and adequate levels of water and nitrogen. Agronomy Journal, 96, 1660–1667.10.2134/agronj2004.1660
- Oktem, A., Simsek, M., & Oktem, AG. (2003). Deficit irrigation effects on sweet corn (Zea mays saccharata Sturt) with drip irrigation system in a semi-arid region. Agricultural Water Management, 61, 63–74.10.1016/S0378-3774(02)00161-0
- Oldak, A., Pachepsky, Y., & Jackson, T. J. (2002). Using GIS in passive microwave soil mapping and geostatistical analysis. International Journal of Geographical Information Science, 16(7), 1–6.
- Otegui, M. E., Andrade, F. H., & Suero, E. E. (1995). Growth, water use, and kernel abortion of maize subjected to drought at silking. Field Crops Research, 40, 87–94.10.1016/0378-4290(94)00093-R
- Panda, R. K., Behera, S. K., & Kashyap, P. S. (2004). Effective management of irrigation water for maize under stressed conditions. Agricultural Water Management, 66, 181–203.10.1016/j.agwat.2003.12.001
- Pandey, R. K., Maranville, J. W., & Admou, A. (2000). Deficit irrigation and nitrogen effects on maize in a Sahelian environment I. Grain yield and yield components. Agricultural Water Management, 46(1), 1–13.10.1016/S0378-3774(00)00073-1
- Pascual, V. J., & Wang, Y-M. (2016,December). Utilizing rainfall and alternate wetting and drying irrigation for high water productivity in irrigated lowland paddy rice in southern Taiwan. Plant Production Science, 1008, 1–12.
- Patel, N., & Rajput, T. B. S. (2007). Effect of drip tape placement depth and irrigation level on yield of potato. Agricultural Water Management, 88, 209–223.10.1016/j.agwat.2006.10.017
- Payero, J. O., Tarkalson, D. D., Irmak, S., Davison, D., & Petersen, J. L. (2009). Effect of timing of a deficit-irrigation allocation on corn evapotranspiration, yield, water use efficiency and dry mass. Agricultural Water Management, 96, 1387–1397.10.1016/j.agwat.2009.03.022
- Perng, C. M. (2013). Taiwan grain and feed annual wheat, corn and milled rice situation and outlook (GAIN Report TW13012). Taipei: USDA Foreign Agricultural Service.
- Republic of China-Executive Yuan. (2016). Statistical yearbook of the Republic of China 2015. Taipei, Taiwan.
- Sakthivadivel, R., Aloysius, N., & Matsuno, Y. (2001). Assessment of performance and impact of irrigation and water resources systems in Taiwan and Sri Lanka (IWMI working paper 31). Colombo: International Water Management Institute.
- Sepaskhah, A., & Ilampour, S. (1996). Relationships between yield, crop water stress index (CWSI) and transpiration of cowpea (Vigna sinensis L). Agronomie, 16, 269–279.10.1051/agro:19960501
- Shrestha, N., Geerts, S., Raes, D., Horemans, S., Soentjens, S., Maupas, F., & Clouet, P. (2010). Yield response of sugar beets to water stress under Western European conditions. Agricultural Water Management, 97, 346–350.10.1016/j.agwat.2009.10.005
- Tfwala, S. S., & Wang, Y.-M. (2016). Estimating sediment discharge using sediment rating curves and artificial neural networks in the Shiwen River, Taiwan. Water, 8, 53.10.3390/w8020053
- Vereecken, H., Kamai, T., Harter, T., Kasteel, R., Hopmans, J., & Vanderborght, J. (2007). Explaining soil moisture variability as a function of mean soil moisture: A stochastic unsaturated flow perspective. Geophysical Research Letters, 34, 681–698.
- WMO. (2012). Agrometeorlogy of some selected crops. In Guide to Agricultural Meteorological Practices (GAMP) (2010 ed., pp. 1–128). Geneva: Chair Publications Board.
- Wu, Y.-C., Hsu, H.-H., Chou, C., Lu, M.-M., Chen, C.-T., & Chen, Y.-M. (2013). Climate change in Taiwan: Scientific report 2011. Global Aspect (Vol. 3). Taipei.
- Yazar, A., Gökçel, F., & Sezen, M. S. (2009). Corn yield response to partial rootzone drying and deficit irrigation strategies applied with drip system. Plant, Soil and Environment, 55, 494–503.
- Yi, L., Shenjiao, Y., Shiqing, L., Xinping, C., & Fang, C. (2010). Growth and development of maize (Zea mays L.) in response to different field water management practices: Resource capture and use efficiency. Agricultural and Forest Meteorology, 150, 606–613.10.1016/j.agrformet.2010.02.003