ABSTRACT
Seed size and protein content are the major breeding objectives for cowpeas (Vigna unguiculata). However, intra-plant variation in these traits causes heterogeneous seed quality and seed depreciation. To determine the causes and severity of intra-plant variation in cowpea single seed weight and protein content, seeds from individual plants were analyzed in relation to their positional effects. Associations between positional variables and seed traits were revealed by additive Bayesian network analysis, and the graphical models were compared for different accessions. Intra-plant variation in single seed weight and protein content were large compared to the variations in genetic resources, and these variations are thought to be related to the source/sink ratio within a plant. In accessions with longer flowering periods, the later-flowering peduncles on the upper nodes produced comparatively larger seeds due to a greater availability of assimilated carbon from leaves that maintain their greenness. While, in accessions with shorter flowering periods, the earlier-flowering peduncles on the lower nodes produced relatively larger seeds because less carbon is available at the later filling periods due to rapid senescence. For all accessions, protein content was higher in seeds derived from later-flowering peduncles and in pods with lower seed numbers. The nitrogen source/sink ratio may be higher in the later filling period because of a smaller number of filling seeds and a higher availability of nitrogen remobilized from senescing leaves and stems.
Introduction
The cowpea (Vigna unguiculata) is an annual legume grown extensively in Africa, the Americas, Asia, and Europe. West Africa accounts for more than 80% of the annual world production (7.4 million tons; FAOSTAT; http://www.fao.org/faostat/en). Most of the harvested cowpea in West Africa is destined for local consumption. The cowpea is a starchy legume that complements cereal-rich diets. It is also an important source of dietary protein rich in essential amino acids (Khattab et al., Citation2009). Cowpea flour is used in traditional dishes such as steamed bean pudding and deep-fried foods, locally known as moin-moin and akara. It is an excellent nutritional agent for food manufacturing because of the high functionality of its protein (Rangel et al., Citation2004). The cowpea is also a cash crop for smallholder farmers. However, the market price of cowpea is determined by its seed characteristics, such as size, color, and texture, of which seed size is the most important influential factor. Consumers are prepared to pay premiums ranging from 0.67–2.0% of the average price per gram increase in 100-grain weight (Langyintuo et al., Citation2003). The stable production of cowpea with high nutritional quality and desirable seed traits may help reduce hunger and poverty among small-scale farmers, improve food security, and mitigate malnutrition in many West African countries.
For these reasons, seed size and protein content have been major targets in cowpea breeding programs and accessions with these traits have been selected from genetic resources (Boukar et al., Citation2016). The major genetic loci identified for seed size and protein content are highly heritable, therefore, these traits can be improved in cowpea varieties with other favorable agronomic traits through cross breeding (Kelly et al., Citation2003; Lo et al., Citation2017). On the other hand, there is high intra-plant variation in seed size and protein content which causes heterogeneous seed quality and seed depreciation.
Intra-plant variation is more severe in indeterminate than determinate plants. In the former case, seeds at different developmental/maturation stages occur on the same plants and compete for the same resources (Sadras & Denison, Citation2009). Atta et al. (Citation2004) found that pea (Pisum sativum L.) size and protein content were greater for the seeds derived from the upper nodes than for those from the lower nodes. However, the effects of node position differed among genotypes. In white lupin (Lupinus albus L.), the branch level accounted for 79–96% of the intra-plant variation in seed size but seed protein content was not affected by the branch level (Crochemore et al., Citation1994). The intra-plant variation in positional effects differs among legume species and the physiological mechanisms involved remain unclear.
In previous studies, the positional effects of nodes and branches were simply analyzed by an analysis of variance (ANOVA) or multiple regression model as a direct effect on seed weight and protein content (Atta et al., Citation2004; Crochemore et al., Citation1994; Schaal, Citation1980). However, seed position should be described in a hierarchical manner that considers the positions of the node, branch, peduncle, and seed space within a pod. Single seed weight and protein content might also be affected by position-related traits, such as flowering date, pod number per peduncle, and seed number per pod. Each of these variables may directly or indirectly affect single seed weight and protein content. Previous studies evaluated the positional effects on bulk seed samples from each level: node, branch, or seed position in a pod (Atta et al., Citation2004; Crochemore et al., Citation1994; Schaal, Citation1980). Nevertheless, seed traits vary among individual seeds. A statistical approach that analyses all potential dependencies among multiple variables is required to elucidate the positional effects on intra-plant variations of seed traits.
The objectives of this study were to identify (i) intra-plant variation in single seed weight and protein content for three cowpea accessions, and (ii) the factors that control this variation. We employed an additive Bayesian network (ABN) to analyze the effects of the positional and position-related variables on the seed traits. The ABN is a graphical model of the joint probability distribution of random variables. Unlike multiple regression models which analyze the dependencies between fixed covariables and objective variables, ABN analyzes the associations between all covariates and all potentially dependent variables (Pittavino et al., Citation2017). ABN analysis helps to identify the model that best fits the observed data without any preliminary information regarding dependencies among variables. Interdependencies among positional and position-related variables may disclose factors that directly or indirectly affect the variation in seed weight and protein content.
Materials and methods
Plant materials and growth conditions
Three cowpea accessions, differing in seed protein content, were selected from the web database developed by the Japan International Research Center for Agricultural Sciences (https://www.jircas.go.jp/en/database). TVu456 is a low-protein accession whereas TVu2723 and TVu7755 are both high-protein accessions. All three accessions were semi-erect plant types with indeterminate flowering. The plants were grown in an experimental field at the International Institute of Tropical Agriculture (IITA) at Ibadan, Nigeria (7°29ʹN, 3°54ʹE). The soil was classified as sandy loam with moderate acidity (pH 5.8–6.1). Seeds were sown in early September 2017 in a plot that consisted of three 4 m rows, with 20 cm interplants on ridges at 1.5 m intervals. Weeding was performed manually as required. Fertilizers were not applied. The total precipitation, average minimum/maximum temperatures, and average solar radiation for the growing periods were 341 mm, 22.5/36.5°C, and 15.2 MJ d−1, respectively. No symptoms of water stress or nutrient deficiency were evident during the growing period.
Flowering dates and seed sampling
At the flowering stage, 10 plants with uniform growth were selected from each of the accessions. The flowering date of the first flower on each peduncle was tagged for all peduncles on each plant. This value was used as the flowering date variable and presented as day of year (DOY). Time lags in the flowering date among flowers per peduncle were not considered. At maturity, all peduncle positions were recorded before pod harvest. Pods with tagged peduncles were harvested separately for each plant and accession. After pod harvest, the seed positions within the pods were recorded simultaneously with the seed sampling. To detect the natural variations in single seed weight and protein content without any artificial factor, sieves or weight thresholds were not employed for seed selection and all the fertile seeds, including the ones with arrested development, were collected.
Description of peduncle and seed positions
Peduncles were located on the main stem and primary and secondary branches (). The primary branches alternately emerged from the main stem. Opposite branches were observed only at the first node. Seed position was described by the five hierarchical variables shown in . Initially, the peduncle position was described by the node position on the main stem (‘nodP’), the secondary branch position on the primary branch (‘br2P’), and the peduncle position on a branch (‘pedP’) ()). These variables represented distances from the proximal position of the main stem, primary branch, or secondary branch ()). When the peduncle was on the main stem or primary branch, ‘br2P’ was recorded as 0. When the peduncle was on the main stem, ‘pedP’ was recorded as 0. The position of an individual seed in a pod was described as ‘sedP’, which represents the distance from the proximal part of the pod including an empty seed space ()). Pod number per peduncle (‘podN’) and seed number per pod (‘sedN’) were also evaluated. Different pods on the same peduncle were not distinguished. To focus on the seed variations of matured pods, data of the peduncles without any pods due to abscission of flowers and immature pods were not recorded.
Figure 1. Cowpea plant structure. Photograph of a TVu2723 plant at pod harvest. A plant with a representative shape was cut into three parts, which are shown in each photograph. (a) upper, (b) middle, and (c) basal parts of a cowpea plant. The numbers indicate the node positions of the primary branch or peduncle. Arrows and stars represent the peduncles and secondary branches, respectively.
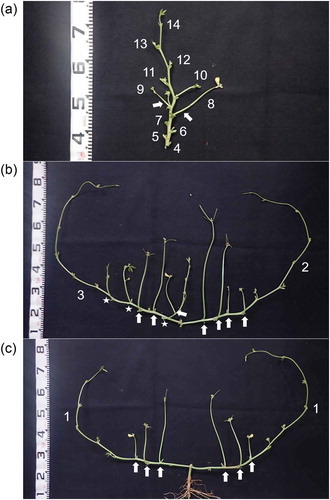
Figure 2. Description of positional variables. (a) Peduncle position on a plant. Numbers in bold, circles, and parentheses represent the node positions on the main stem, primary branch, and secondary branch, respectively. Examples of the description of the peduncle position with positional variables are shown in . (b) Seed position in a pod. Numbers were allocated from the proximal part of the pod, including the empty seed space.
Table 1. Abbreviations of positional and position-related variables used for the ABN analysis.
Single seed weight and nitrogen content
Fresh weights of the individual seeds tagged with position records were measured using an electrical scale. The seeds were then oven-dried at 80°C for 24 hours before being scanned by a Fourier transform infrared spectrometer (FT-IR 6100, JASCO Corporation, Tokyo, Japan) to determine the seed nitrogen content, following the method of Ishikawa et al. (Citation2017). The seed protein content was calculated by multiplying the nitrogen content by the N:P conversion factor (5.45), and expressed the result as a percentage of the dry weight, following Muranaka et al. (Citation2015).
Additive Bayesian network analysis
All variables shown in were pooled for 10 plants per accession. The sizes of the final datasets were 8,204, 4,506, and 3,518 for TVu456, TVu2723, and TVu7755, respectively. These values corresponded to the total seed number per accession. An ABN analysis was separately applied for each accession using R version 3.4.1 (R Core Team, Citation2018) and the package ‘abn’ version 2.1 (Kratzer et al., Citation2016). Because the data from the different plants were independent from each other, inter-plant variation might cause over-dispersion in the parameter estimation. However, it has been well verified that the data grouping aspect does not affect the modelling results and intervals of the estimated parameters (Kratzer & Pittavino, Citation2018). Therefore, data from the 10 plants per accession were analyzed as a single dataset. To evaluate the contributions of the parameters among the variables, all data were standardized to a mean of 0 and a standard deviation of 1 before the analysis. Uninformative Gaussian priors were used for all variables to determine the optimal model structure. Certain dependencies that were inconsistent with a logical time frame were removed from the structure. For example, the direct effect of seed weight on node position was eliminated because the former never influences the latter.
The output of the ABN model was expressed as a directed acyclic graph (DAG) in which variables were directly or indirectly connected by arcs. To identify the DAG that showed the best fit to the observed data, a parallel search was performed for a series of models with different maximum allowable numbers of parents per variable. A DAG with the lowest maximum number of parents and the highest log marginal likelihood was selected as the globally optimal model. For all three accessions, the maximum log marginal likelihood was attained when the maximum number of parents was three ().
The optimal model was then checked for overfitting since the log marginal likelihood can easily overfit smaller datasets (Kratzer et al., Citation2016). Parametric bootstrapping was applied with JAGS (‘Just Another Gibbs Sampler’) software (Plummer, Citation2003) and the ‘rjags’ package in R. In total, 10,000 DAGs were obtained from the simulation data, each of which had the same sized dataset as the observed one. The datasets were generated by Markov chain Monte Carlo simulations. All dependencies that were not repeated more than 5,000 times (50%) were removed to determine the final DAG as a statistically robust model.
Figure 3. Log marginal likelihood values compared among ABN models with different maximum allowable numbers of parents per variable. For each accession, models were tested if their maximum number of parents ranged from 1–6.
Results
Total seed number and seed yield
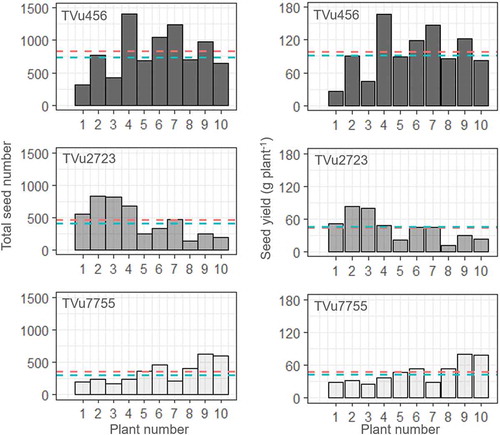
The total seed number and seed yield for each of the 10 plants per accession are shown in . The total seed numbers varied 4–6 times among plants and ranged from 313–1,408, 136–831, and 169–631 for TVu456, TVu2723, and TVu7755, respectively. Seed yield per plant was strongly correlated with total seed number (correlation coefficients: 0.96–0.99, significance: p = 0.01) and ranged from 26.7–167.0, 12.1–82.6, and 25.7–80.0 g plant−1 for TVu456, TVu2723, and TVu7755, respectively.
Figure 4. Total seed number and seed yield in each of the 10 plants. The red and blue dashed lines in each box represent the mean and median for the 10 plants, respectively.
Distribution of seeds in the positional variables
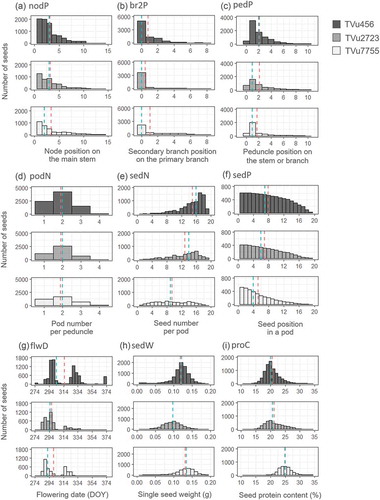
The distributions of seeds in ‘nodP’, ‘br2P’, ‘pedP’, and ‘podN’ were similar for all three accessions. More than 65% of the seeds were harvested from the first three nodes including the branches. The number of seeds per node was comparatively lower in the upper node ()). Most of the seeds originated from peduncles on the primary branch of the first or second node, described as ‘br2P’ = 0 and ‘pedP’ ≥ 1 (,c)). The strong peaks at pedP = 1 ()) meant that large number of seeds were derived from the peduncles at the first node of the primary or secondary branches. For all three accessions, most peduncles had less than 2 pods and peduncles with 3–4 pods were rarely observed ()).
Distribution of the number of seeds per pod (‘sedN’) varied among the accessions. TVu456 showed the highest peak in ‘sedN’ at 17–18 seeds per pod whereas TVu2723 had a ‘sedN’ peak of 14–16 seeds per pod ()). TVu7755 had no specific peak in the ‘sedN’ distribution, i.e. a relatively larger number of seeds originated from smaller pods compared with the other accessions. Many of the seeds from TVu7755 originated from the proximal seed spaces in the pods ()).
Distributions of flowering date, single seed weight, and seed protein content
Flowering date (‘flwD’) was separated into 2–3 peaks over a 3–4 weeks interval ()). Longer flowering periods were observed in TVu456 and TVu2723 compared with TVu7755. For all accessions, the first flowering peak generated over 50% of the total seeds per plant but exact ratios differed among the accessions. For TVu2723, over 80% of the seeds were derived from the first flowering peak whereas only 50–65% of the seeds were produced at the first flowering peak in TVu456 and TVu7755. Large intra-plant variations were observed in the single seed weight (‘sedW’) and protein content (‘proC’) ()). The ranges in single seed weights were similar for all three accessions, with the 95% distribution intervals ranging from 0.07 to 0.17, 0.05 to 0.15, and 0.08 to 0.18 g seed−1 for TVu456, TVu2723, and TVu7755, respectively. The 95% distribution intervals of the seed protein content ranged from 15.4 to 25.8, 15.0 to 27.6, and 20.1 to 29.3% for TVu456, TVu2723, and TVu7755, respectively. The average seed weight and nitrogen content were comparatively higher in TVu7755, however, the genotypic differences among the accessions were not significant (p > 0.05, one-way ANOVA).
Figure 5. Seed distributions in the positional and position-related variables. Abbreviations for the variables are shown in . The red and blue dashed lines in each box represent the mean and median, respectively.
Directed acyclic graph (DAG) of the Bayesian network model
The final models constructed from the arcs with over 50% repeatability in the bootstrap analysis were visually represented as DAGs for each accession (). The DAGs consisted of random variables connected by direct arcs with a standardized marginal posterior median and the repeatability represented as a percentage. The variables connected by arcs can be considered to be same as the objective and explanatory variables of the generalized linear model. The direction of the arc represents the dependency between the variables connected by it. The standardized marginal posterior median represents the strength of the dependency. The 95% interval of the standardized marginal posterior is shown for all the dependencies in ), which shows that no over-dispersion was detected.
Figure 6. Directed acyclic graph (DAG) and forest plot of 95% intervals of marginal posterior in each accession. (a, b, and c) The DAG of the final model, describing intra-plant variations in single seed weight and protein content, are separately shown for each accession. Arcs are labeled with standardized marginal posterior medians which indicate effect size. The numbers in parenthesis represent the repeatability with percentages obtained from 10,000 bootstrapping, which indicates the reliability of the dependency. Solid and dotted arcs represent positive and negative relationships between variables, respectively. Arcs with bolded numbers represent dependencies common to all three accessions. Seed weight and protein content are represented by open circles. The other positional and position-related variables are indicated with filled circles. (d) The 95% intervals of standardized marginal posterior (the effect size indicator) of all dependencies are shown in the forest plot.
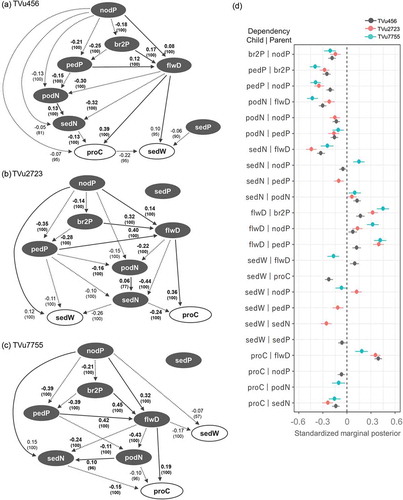
Consistent relationships were detected among ‘nodP’, ‘br2P’, ‘pedP’, ‘podN’, and ‘sedN’ for all three accessions. The negative arcs from ‘nodP’ to ‘br2P’ and from ‘nodP’ to ‘pedP’ indicated that the secondary branches and peduncles were located mainly at the proximal branch positions on the upper nodes. The negative arcs from ‘pedP’ to ‘podN’ indicated that the number of pods per peduncle was relatively lower at the distal position of a branch. The positive dependency between ‘podN’ and ‘sedN’ indicated that the number of seeds per pod decreased with the number of pods per peduncle. For all accessions, the ‘flwD’ showed the same dependencies. The positive arcs were linked from ‘nodP’, ‘br2P’, and ‘pedP’ to ‘flwD’. The flowering date was delayed in the peduncles at the distal position on a branch or upper node.
The dependencies related to seed weight differed among accessions. In TVu456, negative effects on the ‘sedW’ were detected from ‘proC’ and ‘sedP’ and a positive effect on ‘sedW’ was found from the ‘flwD’ ()). These findings showed that seeds with lower protein content, late-flowering peduncles, and proximal seed spaces in a pod had higher seed weights. However, no effect of ‘sedP’ was observed for the other accessions. In TVu2723, negative effects on the ‘sedW’ were identified from ‘pedP’ and ‘sedN’ and a positive effect on ‘sedW’ was detected from ‘nodP’ ()). Therefore, seeds from peduncles on the proximal position in a branch, in smaller size pods, and from the upper nodes had higher seed weights. For TVu456 and TVu2723, larger single seed weights were found on the upper nodes and late-flowering peduncles. However, the opposite associations were noted for TVu7755, which presented negative effects of ‘nodP’ and ‘flwD’ on ‘sedW’ ()). Thus, seeds from the lower nodes and early-flowering peduncles had higher seed weights.
Dependencies related to seed protein content were partially consistent for all three accessions. The ‘proC’ was positively affected by the flwD’ and negatively affected by ‘sedN’. A higher seed protein content was detected in late-flowering peduncles and in pods with comparatively fewer seeds. Specific dependencies with ‘nodP’ in TVu456 and with ‘podN’ in TVu7755 were observed, however, their effects were relatively minor.
Discussion
The intra-plant variations in single seed weight and protein content of cowpeas were large compared to those among different accessions. Within the same plants, the single seed weight and protein content varied by up to 0.1 g and 10%, respectively (). On the other hand, genotypic variations in single seed weight and protein content among cowpea cultivars ranged from 0.13–0.25 g and 23–33%, respectively (Ehlers & Hall, Citation1997). Therefore, breeding efforts are necessary to both improve genotypic averages and to reduce intra-plant heterogeneity. The ABN analysis revealed positional effects on single seed weight and protein content and identified the major variation sources.
The single seed weight was shown to be dependent on the node position or flowering date, or both, but the magnitude of these effects differed among the three accessions. Relatively weak but positive effects of ‘nodP’ or ‘flwD’ on ‘sedW’ were observed for TVu456 and TVu2723, while negative effects of these parameters were observed for TVu7755 (). These findings indicated that larger seeds occurred on the upper nodes with late-flowering peduncles in TVu456 and TVu2723. However, for TVu7755, larger seeds were identified on the lower nodes with early-flowering peduncles. The observed variations in single seed weight are explained by the relative differences in the duration of the seed-filling period. Seed size tended to increase with filling period length (Wien & Ackah, Citation1978). The filling period also depends on the source/sink ratio. When its duration is short, the availability of carbon assimilate is inadequate to meet the seed-filling demand (Munier-Jolain et al., Citation1998). TVu7755 had a comparatively shorter flowering period than the other two accessions ()) and, therefore, relatively faster shoot senescence. The late-flowering peduncles on the upper nodes of TVu7755 might have been subjected to resource (photosynthate) limitation during the later seed filling period, which resulted in the observed lower single seed weight (Figure S1A). In contrast, the longer flowering periods of TVu456 and TVu2723 delayed shoot senescence and there were fewer filling seeds on the late-flowering than on the early-flowering peduncles ()), which may have caused a higher source/sink ratio, which resulted in the observed higher single seed weight (Figure S1A).
The number of seeds per pod (‘sedN’) is also an important determinant of the variation in single seed weight. A strong negative correlation between ‘sedN’ and ‘flwD’ was observed for all accessions. The pods on the late-flowering peduncles had a lower number of seeds than those on the early-flowering peduncles. The effect of ‘flwD’ on ‘sedN’ was large in TVu2723, where ‘sedN’ negatively affected the single seed weight (Figure (6)). These relationships may be explained by resource availability at seed set (Gambín & Borrás, Citation2009). Because over 80% of the seeds of TVu2723 were derived from the first flowering peak ()), resource competition between the filling and flowering pods was more severe for this accession. This phenomenon could reduce the number of seeds per pod in late-flowering peduncles.
Protein content was found to be dependent on the flowering date and number of seeds per pod for all accessions (). The positive effect of ‘flwD’ and the negative effect of ‘sedN’ on the protein content indicated that the pods on the late-flowering peduncles had comparatively less seeds with relatively higher protein content. Although most newly assimilated carbon is accumulated in the form of starch (Koch & Schrader, Citation1984), more than 60% of cowpea seed nitrogen is derived from remobilization from the leaf and stem (Eaglesham et al., Citation1977). The nitrogen is equally distributed to all seeds growing simultaneously (Lhuillier-Sondele et al., Citation1999). Therefore, the balance of the nitrogen source/sink ratio differed between the first and second flowering peaks, and may have been higher in the second flowering peak because of a relatively lower number of filling seeds, i.e. with comparatively higher protein contents (Figure S1B). Nevertheless, the results of the present study did not corroborate those previously reported for pea and white lupin wherein the intra-plant positions did not affect seed protein content (Ali-Khan & Youngs, Citation1973; Crochemore et al., Citation1994). Cowpeas produce a higher number of seeds per plant than peas or white lupin. Thus, nitrogen competition may be relatively more severe among cowpea seeds than among the seeds of the other two legume species.
A negative effect of protein content on single seed weight was specifically detected in TVu456 ()). A similar negative relationship was reported for peas. An increase in starch content in the seed was proposed to have altered the starch/protein ratio (Saxena et al., Citation1987) and, therefore, protein accumulation was more restricted than starch accumulation. No direct dependency between ‘sedW’ and ‘proC’ was detected in TVu7755 ()). On the other hand, the same negative relationship was expected, with the flowering date being the connection factor. Later flowering negatively affected single seed weight but positively influenced the protein content ()). Both nitrogen and carbon availability may depend on the timing of seed filling. For TVu7755, later filling may have increased and decreased the availabilities of nitrogen and starch, respectively.
In conclusion, the intra-plant variations in cowpea single seed weight and protein content were large compared to those observed among accessions. The intra-plant variations in single seed weight and protein content may be associated with biased carbon and nitrogen source/sink ratios that result from non-uniform flowering characteristics of indeterminate cowpeas. TVu456 and TVu2723 have relatively long flowering periods. Their late-flowering peduncles on their upper nodes produced larger seeds because of the higher availability of assimilated carbon from leaves that maintained their greenness. In contrast, TVu7755 has relatively short flowering periods. Its early-flowering peduncles on its lower nodes produced comparatively larger seeds and there was presumably less available carbon at the later filling period because of rapid senescence. For all accessions, a higher seed protein content was measured for pods with smaller numbers of seeds and on late-flowering peduncles. The nitrogen source/sink ratio might be higher during the later filling period because of the smaller number of filling seeds and the higher availability of nitrogen from the senescing leaves and stems at that time. Intra-plant resource distribution has also been shown to be affected by the abscission of flowers and immature pods, depending on the total source availability (Binnie & Clifford, Citation1981), however, we did not evaluate these aspects in the present study and thus further investigation is needed. Cowpeas with uniform flowering at all node positions and with constant seed numbers per pod would maintain the source/sink ratio throughout the seed-filling period and reduce intra-plant variations in single seed weight and protein content.
PPS2019_056RP-File009.tif
Download TIFF Image (361.5 KB)Acknowledgments
We thank Ms. Osisami Oyinda Oluwaseun and Mr. Obanye Chinedu Joseph for their assistance with the field evaluations, and Ms. Alo Oluwatosin D. for her assistance with the seed nitrogen evaluations.
Disclosure statement
No potential conflict of interest was reported by the authors.
Supplementary material
Supplemental data for this article can be accessed here
Additional information
Funding
References
- Ali-Khan, S. T., & Youngs, C. G. (1973). Variation in protein content of field peas. Canadian Journal of Plant Science, 53, 37–41.
- Atta, S., Maltese, S., & Cousin, R. (2004). Protein content and dry weight of seeds from various pea genotypes. Agronomie, 24, 257–266.
- Binnie, R. C., & Clifford, P. E. (1981). Flower and pod production in Phaseolus vulgaris. The Journal of Agricultural Science, 97, 397–402.
- Boukar, O., Fatokun, C. A., Huynh, B.-L., Roberts, P. A., & Close, T. J. (2016). Genomics tools in cowpea breeding programs: Status and perspectives. Frontiers in Plant Science, 7. doi:10.3389/fpls.2016.00757
- Crochemore, M. L., Huyghe, C., Papineau, J., & Julier, B. (1994). Intra-plant variability in seed size and seed quality in Lupinus albus L. Agronomie, 14, 5–13.
- Eaglesham, A. R. J., Minchin, F. R., Summerfield, R. J., Dart, P. J., Huxley, P. A., & Day, J. M. (1977). Nitrogen nutrition of cowpea (Vigna unguiculata): III. Distribution of nitrogen within effectively nodulated plants. Experimental Agriculture, 13, 369–380.
- Ehlers, J. D., & Hall, A. E. (1997). Cowpea (Vigna unguiculata L. Walp.). Field Crops Research, 53, 187–204.
- Gambín, B. L., & Borrás, L. (2009). Resource distribution and the trade-off between seed number and seed weight: A comparison across crop species. Annals of Applied Biology, 156, 91–102.
- Ishikawa, H., Boukar, O., Fatokun, C., Shono, M., & Muranaka, S. (2017). Development of calibration model to predict nitrogen content in single seeds of cowpea (Vigna unguiculata) using near infrared spectroscopy. Journal of near Infrared Spectroscopy, 25, 211–214.
- Kelly, J. D., Gepts, P., Miklas, P. N., & Coyne, D. P. (2003). Tagging and mapping of genes and molecular marker-assisted selection for traits of economic importance in bean and cowpea. Field Crops Research, 82, 135–154.
- Khattab, R. Y., Arntfield, S. D., & Nyachoti, C. M. (2009). Nutritional quality of legume seeds as affected by some physical treatments, Part 1: Protein quality evaluation. LWT-Food Science and Technology, 42, 1107–1112.
- Koch, K. E., & Schrader, L. E. (1984). 14C-Photosynthate partitioning and translocation in soybeans during reproductive development. Plant Physiology, 75, 1040–1043.
- Kratzer, G., & Pittavino, M. (2018). Additive Bayesian network modelling in R. Retrieved from http://r-bayesian-networks.org
- Kratzer, G., Pittavino, M., Lewis, F., & Furrer, R. (2016). abn: An R package for modelling multivariate data using additive Bayesian networks. Retrieved from https://www.semanticscholar.org
- Langyintuo, A. S., Lowenberg-DeBoer, J., Faye, M., Lambert, D., Ibro, G., Moussa, B., … Ntoukam, G. (2003). Cowpea supply and demand in West and Central Africa. Field Crops Research, 82, 215–231.
- Lhuillier-Sondele, A., Munier-Jolain, N. G., & Ney, B. (1999). Influence of nitrogen availability on seed nitrogen accumulation in pea. Crop Science, 39, 1741–1748.
- Lo, S., Muñoz-Amatriaín, M., Boukar, O., Herniter, I., Cisse, N., Guo, Y.-N., … Close, T. J. (2017). Identification of QTL controlling domestication-related traits in cowpea (Vigna unguiculata L. Walp). Scientific Reports, 8, 6261.
- Munier-Jolain, N. G., Munier-Jolain, N. M., Roche, R., Ney, B., & Duthion, C. (1998). Seed growth rate in grain legumes I. Effect of photoassimilate availability on seed growth rate. Journal of Experimental Botany, 49, 1963–1969.
- Muranaka, S., Shono, M., Manjula, K., Takagi, H., & Ishikawa, H. (2015). Application of near to mid-infrared spectroscopy to estimation of grain nitrogen content in cowpea (Vigna unguiculata) grown under multiple environmental conditions. Journal of Biological and Food Science Research, 4, 16–24.
- Pittavino, M., Dreyfus, A., Heuer, C., Benschop, J., Wilson, P., Collins-Emerson, J., … Furrer, R. (2017). Comparison between generalized linear modelling and additive Bayesian network; identification of factors associated with the incidence of antibodies against Leptospira interrogans sv Pomona in meat workers in New Zealand. Acta Tropica, 173, 191–199.
- Plummer, M. (2003, December). JAGS: A program for analysis of Bayesian graphical models using Gibbs sampling. In K. Hornik, F. Leisch, & A. Zeileis (Eds.), Proceedings of the 3rd international workshop on distributed statistical computing. Vienna, Austria. Retrievd from https://www.r-project.org/conferences/DSC-2003/Proceedings
- R Core Team. (2018). R: A language and environment for statistical computing. Vienna, Austria: R Foundation for Statistical Computing. Retrieved from https://www.R-project.org
- Rangel, A., Saraiva, K., Schwengber, P., Narciso, M. S., Domont, G. B., Ferreira, S. T., & Pedrosa, C. (2004). Biological evaluation of a protein isolate from cowpea (Vigna unguiculata) seeds. Food Chemistry, 87, 491–499.
- Sadras, V. O., & Denison, R. F. (2009). Do plant parts compete for resources? An evolutionary viewpoint. New Phytologist, 183, 565–574.
- Saxena, K. B., Faris, D. G., Singh, U., & Kumar, R. V. (1987). Relationship between seed size and protein content in newly developed high protein lines of pigeonpea. Plant Foods for Human Nutrition, 36, 335–340.
- Schaal, B. A. (1980). Reproductive capacity and seed size in Lupinus texensis. American Journal of Botany, 67, 703–709.
- Wien, H. C., & Ackah, E. E. (1978). Pod development period in cowpeas: Varietal differences as related to seed characters and environmental effects. Crop Science, 18, 791–794.