ABSTRACT
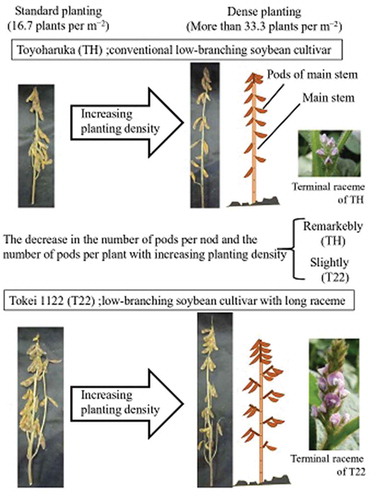
Low-branching soybean cultivars have few nodes per plant, and there have been many cases in northern Japan where growing these cultivars at high plant densities did not improve yield. Soybean cultivar ‘Tokei 1122ʹ (T22), which has a long terminal raceme, was bred to improve the yield of low-branching cultivars under dense planting conditions. To elucidate the effects of long racemes on the suitability of T22 for dense planting, we compared the yield and yield components of T22 and ‘Toyoharuka’ (TH), which is a low-branching cultivar, at various planting densities. There was no significant difference in the seed yield of these cultivars at low planting densities, whereas the seed yield of T22 was significantly greater than that of TH under dense planting conditions. The increase in the number of seeds per unit area was greater for T22 than for TH. An analysis of variance revealed a significant interaction between cultivar and planting density for seed yield, number of pods, and number of pods per node. Moreover, the low-branching cultivar ‘Tokei 1122ʹ with long terminal racemes produced a higher yield under non-lodging conditions than the conventional low-branching cultivar at planting densities of 33 plants m−2 or higher. The greater yield of T22 is likely because of its long terminal raceme, which increases the number of pods per node and the sink capacity (number of seeds) at high planting densities.
Graphical Abstract
Introduction
Soybean has long been cultivated as a major protein source in Japan. However, the soybean yield in Japan remains low, in contrast to the corresponding yield in the USA, which continues to increase. According to statistics available in 2005, the national average soybean yield in the USA is 300 kg/10 a, whereas the national average soybean yield in Japan is only 170 kg/10 a (Katsura et al., Citation2009). Although there have been recent increases in the soybean cultivation area in Japan, the yield is unstable and 200 kg/10 a or lower (http://www.maff.go.jp/j/seisan/ryutu/daizu/d_data/).
Soybean yield refers to the main stem yield and the branch yield. The main stem yield is generally stable regardless of environmental conditions, making it more easily predicted than the branch yield, which is greatly influenced by cultivation conditions (Frederick et al., Citation2001; Horie et al., Citation1971). Branch yield variability is believed to be responsible for inter-annual variations in soybean yield as well as yield instability. Narrow-row cultivation has been suggested in some studies as a method for improving yield. For example, according to Kokubun (Citation1988), for low-branching soybean cultivars, which tend to avoid lodging, dense planting increases seed yield and accelerates plant growth. However, the growth of soybean cultivars suitable for high-density planting is relatively uncommon in Japan. Furthermore, low-branching cultivars produce few nodes and pods per plant. Consequently, there have been many instances of dense planting not resulting in yield increases, especially in northern Japan.
Studies on the effects of planting density on soybean production revealed that the number of plants per square meter is the most influential parameter (Agriculture Research Department Tokachi Agricultural Experiment Station, Citation1998; Moore, Citation1991); however, the yield also reportedly decreases substantially when the inter-row spacing is increased and the distance between plants is decreased (Ikeda, Citation1992). These observations prompted additional research into the effects of planting patterns. Some studies indicated that the yield increases under narrow-row cultivation (Board et al., Citation1992; Boerma & Ashley, Citation1982; Costa et al., Citation1980; Heatherly, Citation1988; Taylor, Citation1980), whereas others concluded that the yield does not necessarily increase (Agriculture Research Department Tokachi Agricultural Experiment Station, Citation1996; Beatty et al., Citation1982). Fujita et al. (Citation2015) reported that although narrow-row planting facilitated weeding, it did not increase yield. Nakaseko and Gotoh (Citation1981) reported that the total branch dry matter decreases substantially under dense planting cultivation. Additionally, the proportion of main stem pods tends to increase in response to dense planting (Kuroda et al., Citation1992; Saito et al., Citation2007), and yield improvements are largely attributable to a greater proportion of pods forming at lower nodes (Kuroda et al., Citation1992).
Therefore, in this study, we examined the utility of low-branching soybean cultivars with long terminal racemes for improving yield under high planting density. Soybean lines with long racemes produce many flowers at each node, thereby increasing the number of pods per node. Bramel et al. (Citation1984) demonstrated that in semideterminate cultivars, terminal raceme length (TRL) measurements could possibly be used to predict yield. Kilen (Citation1989) investigated whether the TRL could be used to predict the number of flowers produced by a plant. Saito et al. (Citation1998) proved that the number of pods is closely related to the number of flowers. Thus, generating new low-branching cultivars with long terminal racemes may lead to enhanced yield under dense planting conditions via the increased number of pods per node and the number of pods per plant.
Yamaguchi et al. (Citation2014) previously mapped two TRL-related quantitative trait loci (qTRL18-1 and qTRL11-1) and determined that the TRL is related to the number of main stem pods. We developed the long-raceme cultivar ‘Tokei 1122ʹ (T22) with two TRL-related quantitative trait loci to improve yield by increasing the number of pods per node under dense planting conditions. However, it is unclear whether T22 plants cultivated under dense planting conditions stably produce a higher yield than the genetically closely related low-branching cultivar ‘Toyoharuka’ (TH). Therefore, we compared the yield and related characteristics of T22 with those of TH planted at five or four densities over 2 years.
Materials and methods
Planting density and cultivars
‘Tokei 1122ʹ (T22), a soybean cultivar with long terminal racemes, and ‘Toyoharuka’ (TH), a reference cultivar, were grown and analyzed in 2013 and 2015. ‘Toyoharuka’ was developed from a cross between ‘Tokei 793ʹ and ‘Tokou 6225 F8ʹ (T. Tanaka et al., Citation2015). ‘Tokei 1122ʹ was the result of a cross between TH and line 1532–1, which produces a long terminal raceme. Line 1532–1 was developed from a cross between ‘Tokei 971ʹ and ‘Tokei 793ʹ (Yamaguchi et al., Citation2014). All of these crosses were completed at the Tokachi Agricultural Experiment Station in Hokkaido, Japan. The qTRL18-1 and qTRL11-1 of T22 (Yamaguchi et al., Citation2014) were derived from line 1532–1 and are associated with the production of long terminal racemes. Both T22 and TH are low-branching and determinate cultivars (dt1).
Trials were conducted at Rakuno Gakuen University, under upland field conditions with gray upland soil. On 22 May 2013, the T22 and TH cultivars were planted at five densities (16–33 plants m−2), with individual plants separated by 5, 7.5, or 10 cm in rows separated by 60, 50, or 40 cm. On 11 May 2015, the two cultivars were planted at four densities (16–50 plants m−2), with individual or paired plants separated by 10 cm in rows separated by 60 or 40 cm. In both years, plants were treated with a fertilizer comprising 2 g m−2 N (as ammonium sulfate), 12 g m−2 P2O5 (as calcium superphosphate), and 8 g m−2 K2O (as potassium sulfate) according to standard practices for Hokkaido.
Field management and measurements
When the first trifoliate leaves emerged, the seedlings were thinned to one plant per hill. Seedlings from hills with multiple plants were transplanted to adjacent vacant hills to ensure the plant community was complete. In both years, weeds were removed by hand until the flowering stage.
To evaluate soybean yield, 20 medium-sized plants in each plot were harvested by hand at maturity (stage R8). After air-drying the harvested plants for 3 or 4 weeks, the main stem length and the number of blanch were measured, and the nodes and pods on the main stems and branches were counted. After threshing by hand, the number of seeds and the 100-seed weight were recorded for the main stems and branches. Seed yield was adjusted to 130 g kg−1 moisture content. The harvest index was calculated as the ratio of seed yield to total dry matter weight. Seed yield, yield components, and the TRL were analyzed. The degree of lodging was recorded in each plot as: 0 (no lodging) to 4 (completely lodged) (Matsukawa & Banba, Citation1986; Saito. et al., Citation2012).
At the beginning of the seed filling stage (R5), the leaf area per plant was measured using LI-3200 (Made by LI-COR company) for four neighboring plants from each plot.
The daily average air temperature, solar radiation and precipitation during the growing seasons were measured by meteorological observation equipment in Rakuno Gakuen University.
Statistical analyses
In all experiments, the cultivars were arranged in a split-plot design, with three replicates for the planting densities as the main plots and the cultivars as subplots. An analysis of variance (ANOVA) was completed to evaluate the differences in seed yield and yield-related traits among treatments.
Results
Climatic conditions and plant shape at maturity
Details regarding the daily average air temperature, solar radiation and precipitation during the growing seasons are presented in . In 2013, the amount of rainfall was about average during the vegetative growth period in June and July, but was above average during the reproductive growth period in August and September. In 2015, the amount of rainfall was below average during the 1-month period starting in mid-June, and the temperature was lower than average in early to mid-July. On the basis of the rainfall during the branch-elongation period from June to August, we concluded that the elongation of branches was enhanced in 2013 by the slightly higher than average temperatures and rainfall, whereas it was inhibited in 2015 by the lower than average rainfall.
Table 1. Daily average air temperature, solar radiation and precipitation during the growing seasons.
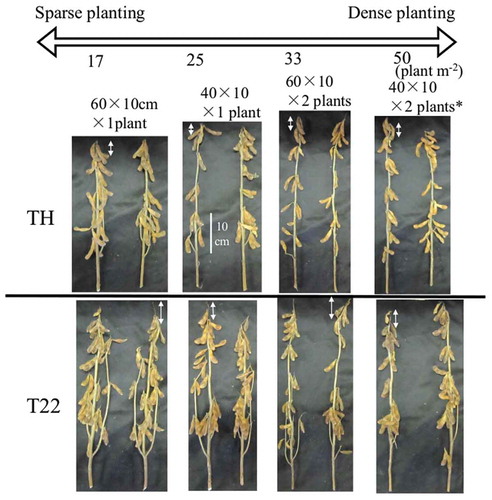
Examples of plants at maturity are presented in . Regarding TH, at planting densities of 25 plants m−2 or greater, the number of pods per node and the number of pods per plant clearly decreased with increasing planting density. An analysis of the T22 plants revealed that the number of pods per node and especially the number of pods per terminal node of the main stem remained high, resulting in relatively little decrease in the number of pods per plant with increasing planting density.
Figure 1. Plant shape at maturity in 2015.
TH: ‘Toyoharuka’, T22: ‘Tokei 1122ʹ* indicates row spacing, width, and number of seedlings per hill.Arrows show terminal raceme lengths.
Effect of planting density on growth, seed yield, total dry matter weight, and harvest index
In both years, the flowering beginning (R1) of T22 plants started 1 or 2 days later than that of TH plants. However, the T22 plants reached maturity (R8) 4–6 days earlier than the TH plants ( and ). Thus, the ripening days (R1–8) was 6–8 days shorter for T22 than for TH. The seed yield in 2015 was lower than that in 2013 because branch growth was suppressed by dry conditions from June to August ().
Table 2. Planting density, growth development, seed yield and related traits in 2013.
Table 3. Planting density, growth development, seed yield and related traits in 2015.
The results of an ANOVA of seed yield identified cultivar and planting density as significant main effects and revealed a significant interaction between cultivar and planting density in both years ( and ). In both years, T22 produced a significantly higher seed yield than TH at planting densities of 22.2 plants m−2 or higher ( and ). For both years and both cultivars, linear regression models indicated the seed yield increased with increasing planting density (). Additionally, in both years, the magnitude of the yield increase (i.e. the slope of the regression line) was greater for T22 than for TH.
Figure 2. Effect of planting density on the seed yield, total dry matter weight, and harvest index.
(a and b) Seed yield, (c and d) total dry matter weight, and (e and f) harvest index (in 2013 and 2015, respectively).● :‘Toyoharuka’ (TH), ▲: ‘Tokei 1122ʹ (T22)†, * and ** indicate significant at the 10, 5% and 1% levels, respectively.
Subjecting the total dry matter weight to an ANOVA indicated that cultivar and planting density were the significant main effects and confirmed the interaction between cultivar and planting density in both years ( and ). Although the total dry matter weight was greater for T22 than for TH at planting densities of 25 plants m−2 or higher in 2013, there were no differences between the cultivars in 2015 (). Linear regression models were consistent with increases in total dry matter weight with increasing planting density (), and the magnitude of the yield increase (i.e. the slope of the regression line) was greater for T22 than for TH in 2013, but not in 2015.
An ANOVA of the harvest index indicated the significant main effects were cultivar and planting density and revealed the interaction between cultivar and planting density in both years ( and ). In both years, the harvest index was greater for T22 than for TH at all planting densities ( and , ). Moreover, the decrease in the harvest index with increasing planting density was greater for TH than for T22 in both years.
Responses of seed yield-related traits and morphological characteristics to planting density
An ANOVA of the number of pods indicated the significant main effects were cultivar and planting density and revealed the interaction between cultivar and planting density in both years ( and ). In both years, T22 produced more pods than TH at planting densities of 25 plants m−2 or greater ( and ). Additionally, for both cultivars, the number of pods increased with increasing planting density. On the basis of a linear regression model, the increase in the number of pods with increasing planting density was greater for T22 than for TH in both years, with a clearer difference in 2013 than in 2015 ().
Figure 3. Effect of planting density on the number of pods, number of seeds per pod, and 100-seed weight. (a and b) Number of pods, (c and d) number of seeds per pod, and (e and f) 100-seed weight (in 2013 and 2015, respectively). ●: ‘Toyoharuka’ (TH), ▲: ‘Tokei 1122ʹ (T22) †, *, and ** indicate significant at the 10%, 5%, and 1% levels, respectively.
An ANOVA of the number of seeds indicated that cultivar and planting density were significant main effects and there was interaction between these two components ( and ). In contrast, the results of an ANOVA of the number of seeds per pod implied that cultivar and planting density were not significant main effects and there was no interaction between these two components ( and ). Moreover, there were no differences in the number of seeds per pod between the cultivars at any planting density ( and , ,). Although the number of seeds per pod tended to decrease with increasing planting density, there were no clear differences between cultivars ().
Subjecting the 100-seed weight to an ANOVA confirmed that cultivar and planting density were significant main effects, but there was no significant interaction between cultivar and planting density in both years ( and ). In both years, TH had a higher 100-seed weight than T22 at all planting densities ( and ). The 100-seed weight tended to increase with increasing planting density. However, there were no clear differences between cultivars ().
On the basis of an ANOVA of the number of nodes per unit area, cultivar and planting density were identified as the significant main effects, but there was no significant interaction between these two components in both years ( and ). In both years, TH had more nodes per unit area than T22 at all planting densities ( and ). Additionally, in both years and for both cultivars, the number of main stem nodes per unit area increased with increasing planting density, as revealed by linear regression models (), and the magnitude of the increase was greater for TH than for T22.
Figure 4. Effect of planting density on the number of pods and number of pods per node on the main stem.
(a and b) Number of pods on the main stem and (c and d) number of pods per node on the main stem (in 2013 and 2015, respectively).●: ‘Toyoharuka’ (TH), ▲: ‘Tokei 1122ʹ (T22)† and * indicate significant at the 10% and 5% levels, respectively.
The results of an ANOVA of the number of pods per node indicated planting density was a significant main effect in both years, whereas cultivar was confirmed as a significant main effect only in 2013. There was no significant interaction between planting density and cultivar in both years ( and ). In both years, T22 produced significantly more pods per main stem node than TH regardless of planting density ( and ). The number of pods per node on the main stem tended to decrease with increasing planting density (). The magnitude of the decrease was greater for TH than for T22 in 2015 ().
Subjecting the main stem length to an ANOVA indicated that cultivar and planting density were the significant main effects and confirmed the interaction between cultivar and planting density only in 2015 ( and ). In both years, TH tended to have the higher main stem length than T22 at all planting densities ( and ).
On the basis of an ANOVA of the number of nodes on the main stem per unit area, cultivar and planting density were identified as the significant main effects, there was significant interaction between cultivar and planting density only in 2015 ( and ).
Subjecting the number of branch to an ANOVA indicated that cultivar and planting density were the significant main effects and confirmed the interaction between cultivar and planting density only in 2015 ( and ).
About degree of lodging, there was no lodging in both years and both cultivars ( and ).
Relationship between terminal raceme length and the number of pods per node on the main stem
The relationship between the TRL and the number of pods per node on the main stem is presented in ). The TRL and the number of pods per node on the main stem were greater for T22 than for TH at all planting densities in both years. Regarding T22, the TRL and the number of pods per node were positively correlated in both years, which was in contrast to TH, for which there was no positive correlation between these two traits.
Figure 5. Relationship between terminal raceme length and the number of pods per node on the main stem.
(a) 2013 and (b) 2015●: ‘Toyoharuka’ (TH), ▲: ‘Tokei 1122ʹ (T22)* indicates significant at the 5% level.
Relationship between planting density and leaf area per plant as well as the relationship between the leaf area index and seed yield
The relationship between planting density and leaf area per plant is presented in ). A linear regression model suggested the leaf area per plant tended to decrease with increasing planting density. The magnitude of the decrease was greater for TH than for T22. Seed yield tended to increase with increasing leaf area index in both cultivars ().
Figure 6. Relationship between planting density and the leaf area per plant, and the relationship between the leaf area index and the seed yield.
(a and b) Relationship between planting density and the leaf area per plant and (c and d) relationship between the leaf area index and the seed yield (in 2013 and 2015, respectively).●: ‘Toyoharuka’ (TH), ▲: ‘Tokei 1122ʹ (T22)* and ** indicate significant at the 5% and 1% levels, respectively.
Discussion
Factors influencing the high yield of densely planted T22 based on yield-related traits and the sink capacity
The TRL of T22 was greater than that of TH even at high planting densities, which increased the number of pods per node and the number of seeds (i.e. sink capacity). Consequently, T22 produced more pods and a higher seed yield than TH at high planting densities. According to Yamaguchi et al. (Citation2014), the long-raceme cultivars produce more flowers on the terminal raceme during the flowering period and more total pods at maturity than the conventional low-branching cultivars. However, according to Saito et al. (Citation1998), the number of pods is influenced more by the number of flowers than the pod-setting rate. Although we did not evaluate the pod-setting rate in this study, the increase in the number of pods in T22 is likely due to an increase in the number of flowers. Future studies should investigate the flowering characteristics and evaluate the increase in the number of pods per node on long terminal racemes based on flowering characteristics.
Factors affecting the high yield of densely planted T22 based on the leaf area as source ability
Seed yield does not increase without increases in the source ability or dry matter partitioning ability along with increases in the sink capacity. Regarding source ability, there was no significant difference in the total dry matter weight of the two analyzed cultivars. According to Duncan (Citation1986), the tendency for the seed yield to increase with increasing planting density is due to three phases. Specifically, during phase 1, there is no competition for light between fully developed plants, and seed yield increases with planting density. In phase 2, the light is completely intercepted by the canopy, and the seed yield increases with planting density. During phase 3, the seed yield per unit area is maximized for the planting patterns and is independent of planting density. On the basis of the observed tendency for the seed yield to increase with planting densities between 33 and 50 plants m−2 in the current study, we speculate that TH and T22 differ regarding their tendency to transition from phase 2 to phase 3. However, indeterminate US cultivars, which produce many small leaflets, exhibit a smaller decrease in the relative illumination of the under structure of the plant community than the determinate Hokkaido cultivars (Agudamu & Shiraiwa, Citation2015). Therefore, T22 likely maintains the leaf area of the plant community better than TH, even under high-density planting conditions. In the current study, the magnitude of the decrease in the leaf area per plant at stage R5 with increasing planting density was smaller for T22 than for TH (). Future studies on the factors mediating the high seed yield of T22 in densely planted fields will need to evaluate the light interception during the reproductive stage.
Other factors related to the high yield of T22
The seed-filling period for T22 was 6–8 days shorter than that for TH, but the seed yield of T22 was significantly greater than that of TH under dense planting conditions ( and ). At high planting densities, the harvest index was greater for T22 than for TH, and the magnitude of the decrease in the harvest index with increasing planting density was smaller for T22 than for TH. The T22 pedigree includes ‘Harosoy’, which is a Canadian cultivar. According to Y. Tanaka et al. (Citation2010), US cultivars tend to have a higher gas exchange capacity and photosynthetic capacity than Japanese cultivars. Additionally, Kawasaki et al. (Citation2016) revealed that the radiation use efficiency of US cultivars tends to be higher than that of Japanese cultivars. These previous studies confirmed that the source ability of US cultivars tends to be greater than that of Japanese cultivars during the seed-filling period. Similarly, another study determined that Canadian cultivars produce a higher seed yield than Japanese cultivars (Yamaguchi et al., Citation2019). Moreover, the radiation use efficiency during the seed-filling period is also greater for Canadian cultivars than for Japanese cultivars (Ihara & Yoshihira, Citation2018). These studies indicate that the source ability of Canadian cultivars tends to be greater than that of Japanese cultivars during the seed-filling period. Environmentally induced changes to the dry matter partitioning and the harvest index were smaller for T22 than for TH, even when the sink capacity increased but the source ability did not. We speculate that a stable dry matter partitioning and harvest index increases the seed yield at high planting densities.
Conclusion
The results described herein suggest that low-branching soybean cultivar ‘Tokei 1122ʹ with long racemes likely produce higher yields than the conventional low-branching cultivar ‘Toyoharuka’ at planting densities of 25 plants m−2 or higher under non-lodging conditions. This yield improvement is likely because long terminal racemes produce many pods per node, which increases the number of seeds and the sink capacity. Additionally, we speculate that the source ability of T22 is greater than that of TH at high planting densities because the magnitude of the decrease in the leaf area per plant at stage R5 with increasing planting density was smaller for T22 than for TH. Because the sink capacity and source ability are greater for T22 than for TH, the seed yield of T22 is likely higher than that of TH at high planting densities. In conclusion, this study revealed that T22, which has a long terminal raceme, produces more pods on the main stem and has a higher seed yield than TH under dense planting conditions. Thus, we speculate that the TRL is an important index for the breeding of new high-yielding varieties.
Acknowledgments
This study was supported by the Ministry of Agriculture, Forestry, and Fisheries of Japan (Genomics for Agricultural Innovation, SOY2002; Genomics-based Technology for Agricultural Improvement, SFC1001 and SFC1002). We thank the students of the Crop Science Laboratory, Department of Sustainable Agriculture, Rakuno Gakuen University for their help with the yield survey and sampling. We also thank Edanz Group (www.edanzediting.com/ac) for editing a draft of this manuscript.
Disclosure Statement
No potential conflict of interest was reported by the authors.
References
- Agriculture Research Department Tokachi Agricultural Experiment Station. (1996). [Problems and potential as labor saving mechanized culture of narrow-row-dense-planting in soybean]. Japan Bull Hokkaido Pref. Agricultural Experiment Station, 1996, 1–28. In Japanese. https://www.hro.or.jp/list/agricultural/center/kenkyuseika/gaiyosho/h08gaiyo/1995075.htm
- Agriculture Research Department Tokachi Agricultural Experiment Station. (1998). [In major soybean cultivars, suitability of dense-planting and harvest by combine, and characteristics of stem moisture depletion]. Japan Bull Hokkaido Pref. Agricultural Experiment Station, 1998, 1–34. In Japanese. https://www.hro.or.jp/list/agricultural/center/kenkyuseika/gaiyosho/h11gaiyo/1998111.htm
- Agudamu, Yoshihira., & Shiraiwa, T. (2015). [Effect of stem growth habit on soybean yield stability to planting density: Varietal difference in branching plasticity, and the factorial analysis from the point of view of branch development and light-intercepting characteristics]. Research of One Health, 2015/October, 17–38. In Japanese with English title. https://rakuno.repo.nii.ac.jp/?action=pages_view_main&active_action=repository_view_main_item_detail&item_id=3840&item_no=1&page_id=13&block_id=37
- Beatty, K. D., Eldridge, I. L., & Simpson, A. M., Jr. (1982). Soybean response to different planting patterns and dates. Agronomy Journal, 74(5), 859–862. https://doi.org/10.2134/agronj1982.00021962007400050021x
- Board, J. E., Kamal, M., & Harville, B. G. (1992). Temporal importance of greater light interception to increased yield in narrow-row soybean. Agronomy Journal, 84(4), 575–579. https://doi.org/10.2134/agronj1992.00021962008400040006x
- Boerma, H. R., & Ashley, D. A. (1982). Irrigation, row spacing, and genotype effects on late and ultra-late planted soybeans. Agronomy Journal, 74(6), 995–999. https://doi.org/10.2134/agronj1982.00021962007400060015x
- Bramel, P. J., Hinz, P. N., Green, D. E., & Shibles, R. M. (1984). Use of principal factor analysis in the study of three stem termination types of soybean. Euphytica, 33, 387–400. https://doi.org/10.1007/BF00021136
- Costa, J. A., Oplinger, E. S., & Pendleton, J. W. (1980). Response of soybean cultivars to planting patterns. Agronomy Journal, 72(1), 153–156. https://doi.org/10.2134/agronj1980.00021962007200010029x
- Duncan, W. G. (1986). Planting pattern and soybean yields. Crop Science, 26(3), 584–588. https://doi.org/10.2135/cropsci1986.0011183X002600030033x
- Frederick, J. R., Camp, C. R., & Bauer, P. J. (2001). Drought-stress effects on branch and mainstem seed yield and yield components of determinate soybean. Crop Science, 41(3), 759–763. https://doi.org/10.2135/cropsci2001.413759x
- Fujita, S., Kurosaki, H., Onishi, S., & Fueki, N. (2015). [The present state and suitable planting density of soybean narrow-row planting on drained paddy fields in central part of Hokkaido]. Japanese Hokuno, 82(1), 34–43. In Japanese with English title. https://agriknowledge.affrc.go.jp/RN/2010891148
- Heatherly, L. G. (1988). Planting date, row spacing, and irrigation effects on soybean grown on clay soil. Agronomy Journal, 80(2), 227–231. https://doi.org/10.2134/agronj1988.00021962008000020017x
- Horie, M., Mikoshiba, K., & Ogiwara, H. (1971). [Statistical studies on various characteristics of crop plants: X. Studies on the variation of characters among individual plants of soybean varieties]. Japanese Journal of Crop science, 40(2), 230–236. In Japanese with English title. https://doi.org/10.1626/jcs.40.230.
- Ihara, T., & Yoshihira, T. (2018). [Canadian high-yielding soybean cultivars in the central Hokkaido and their high-yielding factors–Yield components and growth analysis in comparison with those of Hokkaido cultivars–]. Hokkaido Br Japanese Journal of Crop Science, 59, 42–43. In Japanese with English title. https://doi.org/10.20751/hdanwakai.59.0_42
- Ikeda, T. (1992). Soybean planting patterns in relation to yield and yield components. Agronomy Journal, 84(6), 923–926. https://doi.org/10.2134/agronj1992.00021962008400060002x
- Katsura, K., Yoshihira, T., Homma, K., Purcell, L. C., Katsube Tanaka, T., & Shiraiwa, T. (2009). [Field studies on factors causing the widening gaps in soybean yield between Japan and USA–Field observation reports in USA–]. Journal of Crops Research, 54, 149–154. In Japanese. https://rakuno.repo.nii.ac.jp/?action=pages_view_main&active_action=repository_view_main_item_detail&item_id=477&item_no=1&page_id=13&block_id=37
- Kawasaki, Y., Tanaka, Y., Katsura, K., Purcell, L. C., & Shiraiwa, T. (2016). Yield and dry matter productivity of Japanese and US soybean cultivars. Plant Production Science, 19(2), 257–266. https://doi.org/10.1080/1343943X.2015.1133235
- Kilen, T. C. (1989). Inheritance of a long terminal raceme in soybean. Crop Science, 29(4), 966–968. https://doi.org/10.2135/cropsci1989.0011183X002900040028x
- Kokubun, M. (1988). [Design and evaluation of soybean ideotypes]. Japanese Bull Tohoku National Agricultural Experiment Station, 77, 77–142. In Japanese with English title. https://agriknowledge.affrc.go.jp/RN/2010400742
- Kuroda, T., Uetaka, T., Kohri, K., & Kumano, S. (1992). [Flower and pod shedding in soybean plants with special reference to raceme order]. Japanese Journal of Crop science, 61(1), 74–79. In Japanese with English title. https://doi.org/10.1626/jcs.61.74.
- Matsukawa, I., & Banba, H. (1986). [The lodging response of soybeans to different manuring and plant density]. Rep. Hokkaido. Br. Crop Science Society of Japan, Japanese Society of Breeding, 26, 11. In Japanese with English title. https://doi.org/10.20751/hdanwakai.26.0_11
- Moore, S. H. (1991). Uniformity of plant spacing effect on soybean population parameters. Crop Science, 31(4), 1049–1051. https://doi.org/10.2135/cropsci1991.0011183X003100040041x
- Nakaseko, K., & Gotoh, K. (1981). [Comparative studies on dry matter production, plant type and productivity in soybean, azuki bean and kidney bean: III. Dry matter production of soybean plant at various population densities]. Japanese Journal of Crop science, 50(1), 38–46. In Japanese with English title. https://doi.org/10.1626/jcs.50.38.
- Saito, K., Hirata, K., & Kashiwagi, Y. (2007). [Effect of row-width and planting density on podding and yield performance of early soybean cultivar ‘Enrei’ with reference to raceme order]. Japanese Journal of Crop Science, 76(2), 204–211. In Japanese with English title. https://doi.org/10.1626/jcs.76.204
- Saito, K., Isobe, S., & Kuroda, T. (1998). [Significance of flower differentiation and development in the process of determining soybean yield]. Japanese Journal of Crop science, 67(1), 70–78. In Japanese with English title. https://doi.org/10.1626/jcs.67.70.
- Saito., K., Nishimura, K., & Kitahara, T. (2012). [Effect of lodging on seed yield of field-growth soybean. -Artificial lodging and lodging preventing treatments-]. Japanese Journal of Crop Science, 81(1), 27–32. In Japanese with English title. https://doi.org/10.1626/jcs.81.27.
- Tanaka, T., Shirai, S., Yumoto, S., Matsukawa, I., Hagihara, S., Kurosaki, H., Yamazaki, H., Suzuki, C., Ohnishi, S., & Tsunoda, M. (2015). [A new soybean variety ‘Toyoharuka’]. Japan Bull Hokkaido Pref. Agricultural Experiment Station, 99(1), 47–60. In Japanese with English title. https://agriknowledge.affrc.go.jp/RN/2010891848
- Tanaka, Y., Fujii, K., & Shiraiwa, T. (2010). Variability of leaf morphology and stomatal conductance in soybean [Glycine max (L.) Merr.] cultivars. Crop Science, 50(6), 2525–2532. https://doi.org/10.2135/cropsci2010.02.0058
- Taylor, H. M. (1980). Soybean growth and yield as affected by row spacing and by seasonal water supply. Agronomy Journal, 72(3), 543–547. https://doi.org/10.2134/agronj1980.00021962007200030032x
- Yamaguchi, N., Sayama, T., Sasama, H., Yamazaki, H., Miyoshi, T., Tanaka, Y., & Ishimoto, M. (2014). Mapping of quantitative trait loci associated with terminal raceme length in soybean. Crop Science, 54(6), 2461–2468. https://doi.org/10.2135/cropsci2014.03.0226
- Yamaguchi, N., Tsuji, Y., Suzuki, H., Kitabatake, T., & Yoshihira, T. (2019). Evaluation of high-yielding Canadian soybean cultivars suited to Japanese growing conditions. Agrosystems, Geosciences & Environment, 2(1), 1–6. https://doi.org/10.2134/age2018.12.0061