 ?Mathematical formulae have been encoded as MathML and are displayed in this HTML version using MathJax in order to improve their display. Uncheck the box to turn MathJax off. This feature requires Javascript. Click on a formula to zoom.
ABSTRACT
Laboratory visible and near-infrared (Vis-NIR) spectroscopy with partial least squares (PLS) regression can be used to determine the soil carbon (C) content, and the waveband selection procedures can refine the predictive ability. However, individually selected wavebands are not always the same depending on the location, scale, and approach. To simplify the variable selection issue, some methods for selecting wavelength regions instead of individual wavebands have been proposed. In this study, we explore relevant wavelength regions for predicting the total carbon (TC) content of lowland and upland soils in Madagascar from Vis-NIR spectroscopy using a dynamic version of backward interval PLS (biPLS) regression. The predictive ability of dynamic biPLS was compared with that of standard full-spectrum PLS (FS-PLS) using the cross-validated coefficient of determination (R2), root mean squared error (RMSE), and ratio of performance to interquartile distance (RPIQ). The biPLS models using reflectance (R2 = 0.877, RMSE = 0.690) and first derivative reflectance (FDR) (R2 = 0.940, RMSE = 0.494) data sets showed better predictive accuracy than the FS-PLS models using reflectance (R2 = 0.826, RMSE = 0.809) and FDR (R2 = 0.933, RMSE = 0.518) data sets, the spectral efficiency was improved. By using biPLS to predict soil TC, the model was simplified by using only four selected wavelength regions in the reflectance (400–490, 1402–1440, 1846–1980 and 2151–2283 nm) and FDR (652–687, 1322–1443, 1856–1985, and 2290–2400 nm) data sets, which yielded reliable (RPIQ > 2.5) predictions.
Graphical abstract
1. Introduction
The soil carbon (C) content is one of the most important properties in assessments of general soil fertility. Then, timely assessments of soil C can be used for effective and sustainable fertilizer management practices, which is particularly true in Sub-Saharan Africa (SSA), where smallholder farmers still rely on indigenous nutrient supplies from soils for crop production. Rice cultivation in Madagascar is typical of farming systems in SSA in which smallholder farmers are impoverished by stagnant yields resulting from infertile soil conditions with minimal external inputs (Tsujimoto et al., Citation2019). In Madagascar, rice is uniquely important not only as the staple food of the country but also as the major income resource for rural livelihoods. However, rice yields have been stagnant at less than 3 t ha–1 for the last decades despite relatively favorable water conditions, with 70% of rice cropping areas categorized as irrigated in this country (Partnership, Citation2013). In a survey of several rice fields in the central highland of Madagascar, Tsujimoto et al. (Citation2009) showed a significant and linear relationship between rice yield and the soil organic carbon (SOC) content in relation to the N-supplying capacity of soils, strongly indicating that soil fertility management is critical to improving rice yields in the region.
Visible and near-infrared (Vis-NIR) spectroscopy, as a rapid and non-destructive technology, has been widely used to perform quantitative analyses of complex samples in agricultural sciences. The reflectance spectra of Vis-NIR (400–2500 nm) obtained by laboratory spectral measurements include wavebands that have been related to physical and chemical properties of soil. The prediction of soil properties requires the development of a spectral library relating to spectra with reference data. To date, soil spectral libraries have been developed by the Vis-NIR enthusiasm around the world at country (Li et al., Citation2015; Romero et al., Citation2018), continental (Johnson et al., Citation2019; Stevens et al., Citation2013), and global (Viscarra Rossel et al., Citation2016) scales. These libraries can be used to develop calibration models for the prediction of soil properties. In Madagascar, however, only a small number of qualified data set was recorded in the soil libraries; continent scale (n = 82) (Johnson et al., Citation2019) and global scale (n = 18) (Viscarra Rossel et al., Citation2016).
Partial least squares (PLS) regression is the most widely used multivariate calibration method because it can extract information on the target component from a spectral matrix with hundreds or even thousands of wavebands (Conforti et al., Citation2013, Citation2015). However, as a linear multivariate calibration, the accuracy of PLS analysis tends to decrease due to the non-linear nature of the relationship between spectral data and the dependent variable (Araújo et al., Citation2014). As data-mining approaches, machine learning techniques, such as artificial neural network (ANN) (Kuang et al., Citation2015), support-vector machines (SVM) (Morellos et al., Citation2016), and random forest (Cipullo et al., Citation2019; Douglas et al., Citation2018; De Santana et al., Citation2018) outperformed the PLS analysis for predicting soil properties as it is able to account for the non-linearity associated with the soil spectral responses. More recently, deep learning is a rapidly developing frontier in machine learning that has also been tested for calibrating soil spectra (Ng et al., Citation2019; Padarian et al., Citation2019). Although the literatures reported the machine learning outperformed PLS regression, they did not suggest that it would be suitable for everyone, because the machine learning, and especially deep learning, is a very data-hungry approach that requires a lot of data to be able to make a good prediction (Ng et al., Citation2019).
In Madagascar, there is no spectral library (data set) to perform machine learning for estimating soil properties. In the present study, we focused on the development of a robust PLS model using waveband selection approach based on local data set that we collected in the central highland of Madagascar. In general, Vis-NIR spectra contains thousands of wavebands, and such large number of spectra variables often contribute to collinearity, and redundancies rather than relevant information. Waveband selection is an important step not only for developing a robust calibration model and also for better understanding the relationship between spectral and soil properties. Indeed, it is increasingly evident that the inclusion of uninformative or redundant spectra in the Vis-NIR spectrum degrade the PLS model and lead to inaccurate predictions (Andersen & Bro, Citation2010; H. D. Li et al., Citation2012). Thus, additional waveband selection methods based on the PLS regression are necessary for NIR spectral analysis to refine the predictive ability.
To date, a large number of waveband selection methods for PLS analysis have been proposed, including individual waveband selection and wavelength region selection. For individual waveband selection, many methods have been developed, such as iterative stepwise elimination PLS (ISE-PLS) (Boggia et al., Citation1997), uninformative variable elimination PLS (UVE-PLS) (Centner et al., Citation1996), and genetic algorithm PLS (GA-PLS) (Leardi et al., Citation1992). Among the waveband selection methods, GA-PLS has been used as a suitable method in chemometrics (Leardi, Citation2000). Earlier studies reported that, after suitable modifications, GA-PLS shows better predictive performance and yields more interpretable results because the selected wavelengths are less dispersed than those with other methods (Kawamura et al., Citation2010; Leardi & González, Citation1998; Lucasius & Kateman, Citation1994). In our previous research (Kawamura et al., Citation2017), we developed a PLS model to estimate the total carbon (TC) contents of paddy soils from laboratory Vis-NIR measurements of soil samples collected from various rice fields in the central highland of Madagascar. The results indicated improvements in the predictive ability by applying individual waveband selection with ISE-PLS. Additionally, our previous study (Kawamura et al., Citation2019) indicated that GA-PLS obtained better solutions than ISE-PLS when estimating the oxalate-extractable P content of paddy soils in Madagascar. However, the computational cost of GA-PLS is very high when the number of wavebands is large. Another considerable issue with GA-PLS is over-fitting when using a large number of wavebands (>200) (Leardi & Nørgaard, Citation2004).
One solution to simplifying the problem of variable selection is to reduce the number of variables involved in the optimization (Zhang et al., Citation2017). Some methods for selecting wavelength regions instead of individual wavebands have been proposed, such as moving window PLS (MWPLS) (Jiang et al., Citation2002; Kasemsumran et al., Citation2004), interval PLS (iPLS) (Nørgaard et al., Citation2000), and backward interval PLS (biPLS) (Leardi & Nørgaard, Citation2004). MWPLS (Jiang et al., Citation2002; Kasemsumran et al., Citation2004) searches for informative spectral regions using a moving window, which moves over the whole spectral region to identify useful spectral intervals. However, the sub-region selected by the window with a fixed size does not always supply the best predictions. Therefore, Du et al. (Citation2004) developed changeable size moving window PLS (CSMWPLS) to optimize the informative regions and their combinations to further improve the predictive ability of the PLS models. Both iPLS (Nørgaard et al., Citation2000) and biPLS (Leardi & Nørgaard, Citation2004) calculate local PLS models using equally sized subintervals of the full spectrum region and identify the optimal combinations of regions by forward and backward selection, respectively. Similar to MWPLS, however, they encounter problems when the border between two contiguous intervals of equally spaced spectral regions falls inside the same spectral feature, such as when the main part of a reflectance peak is in one interval and its tail in the next interval. The solution can be found by running biPLS several times, with a different number of intervals with different interval sizes each time. To overcome these problems, a dynamic version of biPLS has been developed by Leardi and Nørgaard (Citation2004). Dynamic biPLS runs several times using a different composition of the deletion groups (determined by randomizing the order of the samples) and with a different number of intervals (e.g. from 16 to 25).
Here, we adopted this dynamic biPLS approach to explore relevant wavelength regions for prediction of the TC content of upland and lowland soils in Madagascar. To evaluate the performance of the selected wavelength regions for TC calibration, this study compares the predictive ability of dynamic biPLS with that of standard full-spectrum PLS (FS-PLS).
2. Materials and methods
2.1. Data set
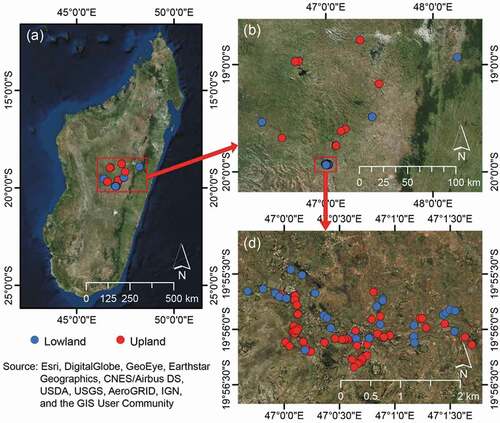
This study used the same data set used in our previous study (Kawamura et al., Citation2019, Citation2017); the data set was generated based on laboratory Vis-NIR spectroscopy using soil samples (n = 162) collected from upland and lowland rice fields in the central highland of Madagascar (). This area is dominated by inherently nutrient-poor soil types that are mainly classified into Ferralsols and Acrisols (IUSS Working Group, WRB, Citation2014) or into Oxisols of semiarid to humid climates (Soil Survey Staff, Citation2014). In 2015 and 2016, soil sampling was conducted in 158 rice fields. Surface soil samples were collected from a 0–10 cm depth as composites of three to four cores in each field. Within three fields, sub-surface samples (10–20 cm depth in a field; 10–20, 20–30, and 30–40 cm depth in two fields) were also collected to evaluate the effect of the depth of soil layers. Thus, 165 soil samples were obtained. The soil samples were sieved to <2 mm and air-dried for 7 days in the laboratory. The TC contents of soils were determined using the dry combustion method with an automatic NC analyser, SUMIGRAPH NC-220 F (Sumika Chemical Analysis Service, Ltd., Osaka, Japan).
Figure 1. Location of study area and soil sampling points. Source for background images in (a), (b) and (d): Esri, DigitalGlobe, GeoEye, Earthstar Geographics, CNES/Airbus DS, USDA, USGS, AeroGRID, IGN, and the GIS User Community
The Vis-NIR spectra for dry soil samples were recorded using an ASD FieldSpec 4 Hi-Res spectroradiometer (ASD Inc., Longmont, CO, USA) and an ASD contact-probe in a dark room. Preprocessing, including noise reduction by standard normal variate (SNV) and outlier detection, was performed on the reflectance and first derivative reflectance (FDR) spectra over a wavelength range from 400 to 2400 nm (2001 bands). The outliers were detected based on the Mahalanobis distance H > 3 from principal component analysis (Kawamura et al., Citation2017). As a result, three samples were considered outliers, leaving 162 samples for further analyses.
2.2. PLS calibrations
PLS calibrations were performed based on reflectance and FDR spectra data sets using ‘PLS_Toolbox’ in MATLAB software ver. 9.3 (MathWorks Herborn, MA, USA). The dynamic biPLS (Leardi & Nørgaard, Citation2004) was computed using the ‘iToolbox’ revision released in March 2013 (http://www.models.kvl.dk/iToolbox).
The dynamic biPLS was performed in 50 runs with the number of intervals varying from 16 to 25 and with three runs (each with a different composition of the deletion groups) for each number of intervals. After 50 runs of biPLS, the wavelength regions were selected by a backward stepwise selection procedure based on the frequency of selections. The final output is a plot showing how many times each waveband was retained after 50 runs with the threshold value (Leardi & Nørgaard, Citation2004).
2.3. Predictive ability of the PLS models
To evaluate the predictive ability of the FS-PLS and dynamic biPLS, a k-fold cross-validation procedure based on independent training and test data sets was performed (Emmert-Streib & Dehmer, Citation2019). Initially, the data were divided randomly into training (n = 120) and test (n = 42) data sets. Next, the training data were split randomly into k-folds. Here, we used k = 5; therefore, each k-fold has n = 24 samples. The PLS model was built on k – 1 folds of the training data set (n = 96), and then the error of the kth fold was recorded as validation data (n = 24). This process was repeated until each of the k-folds served as the validation data set. The coefficient of determination (R2) and root mean squared error (RMSE) values were used to assess model accuracy. Finally, the model was applied to the test data set, and then the predictive ability was evaluated from the R2, the RMSE and the ratio of performance to interquartile range (RPIQ) (Bellon-Maurel et al., Citation2010) in the test data set.
The R2 is calculated as:
where RSS is the residual sum of squares and TSS is the total sum of squares. The RMSE is defined as:
where yi and yp represent the measured and predicted soil TC contents for sample i, respectively, and n is the number of samples in the test data sets (n = 42). R2 is a measure of how well the variation in one variable explains the variation in an other variable and is presented as the percentage of the variation explained by a best-fit regression line. RMSE indicates the total prediction error of the model. In general, high R2 and low RMSE values reflect models that can better predict the soil TC content (Kusumo et al., Citation2008).
The RPIQ is defined as follow:
where IQ is the inter quantile distance between Q3 and Q1 of the observed values. In terms of the performance ability of the calibration model, RPIQ values >2.5 are considered to reflect excellent models, RPIQ values between 2.0 and 2.5 indicate a very good model with predictive ability, RPIQ values between 1.7 and 2.0 indicate a good model, RPIQ values between 1.4 and 1.7 indicate a fair model in need of some improvement, and RPIQ values <1.4 indicate that a model has a very poor predictive ability (Nawar & Mouazen, Citation2017).
3. Results and discussions
3.1. Soil TC statistics
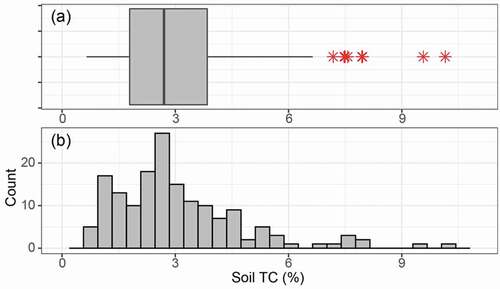
The descriptive statistics of the soil TC (%) in the 162 samples (Kawamura et al., Citation2019, Citation2017) are shown in , and the data distribution is illustrated in . The mean (and standard deviation (SD)) value was 3.05% (1.72%), with a range of 0.65–10.15%. The TC content was left-skewed, with a higher mean value (3.05%) than the median value (2.70%). The coefficients of variation (CVs) were relatively high (56.40%), indicating a rather high degree of variation, and the distribution was heterogeneous. The SD and range of the sample affect the accuracy of soil property predictions using Vis-NIR spectroscopy, and the wide range of variability indicated that this site is a reasonably optimal case study site (Kuang & Mouazen, Citation2011). In the present study, the range of soil TC values was considered sufficiently large to develop calibration models using PLS regression analyses. Soil TC was generally higher in surface soils than in sub-surface soils at the respective fields where sub-surface samples were collected. Meanwhile, the variation in TC content between surface and sub-surface layers within each field was much smaller than that among surface soils of all the 158 fields.
Table 1. Descriptive statistics of soil TC data
Figure 2. (a) Box-and-whiskers plot with outliers and (b) a histogram of soil TC
3.2. Soil reflectance and FDR spectra
shows the soil reflectance and FDR spectra. Large variations in the reflectance spectra were observed in the heterogeneous soil samples, which were collected from upland and lowland fields under various rice-based cropping systems. In the reflectance spectra, three strong absorption features were found in the 1400-, 1900- and 2200-nm wavelength regions ()). The FDR spectra also showed some peaks in the same regions and in visible regions ()). The Vis-NIR spectra are general characteristics of absorption wavebands associated with color (400–700 nm), the bending (1413 nm) and stretching (1916) of the O-H bonds of free water, and lattice minerals (approximately 2210 nm) (Viscarra Rossel et al., Citation2006; Ben-Dor, Citation2002; Knadel et al., Citation2013; Stenberg et al., Citation2010).
Figure 3. Raw reflectance spectra (a) and FDR spectra on a log10 scale (b) of the soil samples
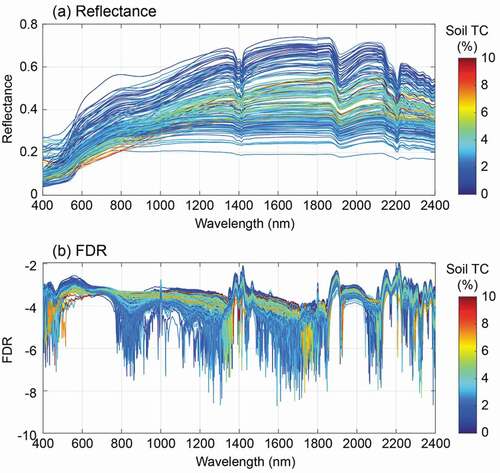
In general, soil reflectance decreases with increasing organic matter (Ben-Dor et al., Citation1997) and water content (Whiting et al., Citation2004). Wavelengths centered at approximately 400, 450, 510, 550, 700, 870 and 1000 nm are characteristics of the presence of ferrous and ferric iron oxides and are due to the electronic transitions of the iron cations (Ben-Dor et al., Citation1999). In addition to soil components, physical soil properties, such as particle size distribution and aggregate size and density, also affect both the reflectance intensity and shape of the soil spectra through the phenomena of light scattering and reflection (Bellon-Maurel & McBratney, Citation2011; Conforti et al., Citation2018). Thus, the soil spectral behavior can be considered as combination of chemical and physical properties of soil (Clark, Citation1999). Conforti et al. (Citation2018) reported that soil reflectance showed relatively high value for loamy sand soils due to the high amount of quartz in the sand fraction, while reflectance decreased when clay content dominated from phyllosilicates increased, and consequently, when SOC concentration increased.
3.3. Selected wavelength regions from dynamic biPLS
The selected wavelength regions and the frequency of selections after 50 runs of dynamic biPLS using reflectance and FDR spectra to estimate soil TC are shown in , and summarizes the selected wavelength regions with previously known wavebands related to soil components to assist in considering the importance of the selected wavelengths.
Table 2. Selected wavelength regions from dynamic biPLS for estimating the soil TC content using reflectance and FDR data sets and possible soil components
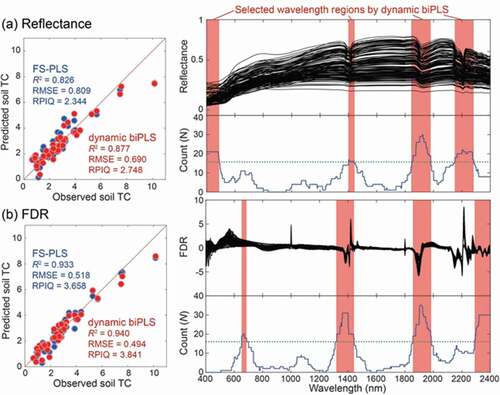
Figure 4. Selected wavelength regions (red bars) from dynamic biPLS for estimating the TC content of paddy soils using reflectance (a) and FDR (b) spectra with the frequencies (count number (N); blue line) of the selected wavebands in dynamic biPLS. Specific absorption bands for the different bonds in soil are specified in the top x-axis (modified by Katuwal et al. (Citation2018))
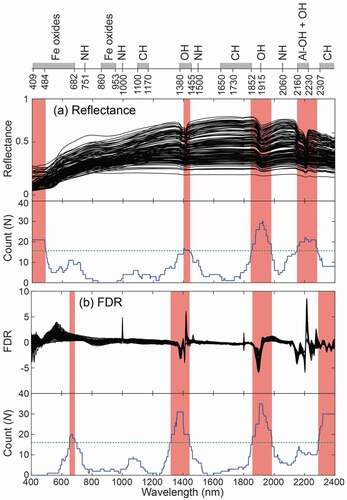
In the reflectance data set, four regions of 400–490, 1402–1440, 1846–1980 and 2151–2283 nm were selected in the model. Judging from the high selection frequency, the 1846–1980 nm region was considered the most important region in the reflectance data sets for soil TC predictions. The regions of 1402–1440 and 1846–1980 nm include several wavebands known to be relevant to soil free water and to vary with the soil organic matter content (Knadel et al., Citation2013). Our current data set also showed a significant correlation between the air-dried soil water content and TC content (p < 0.1%, r = 0.625). Since soil organic matter increases soil water retention (Rawls et al., Citation2003), we assumed that the increase in soil water reflected a co-occurrence relation with the increase in soil organic matter. The wavelength region of 2151–2283 nm mainly consisted of the wavebands associated with organic matter and Al hydroxides. Meanwhile, the wavelength region of 400–490 nm is related to Fe oxides, which are mainly associated with soil color as well as soil organic carbon. Soils in the tropics are rich in Fe and Al (hydr)oxides because of intensive weathering and leaching (Ramaroson et al., Citation2018), and Fe and Al (hydr)oxides are well known to increase the stability of organic matter in soils through the formation of organo-metal complexes (Van De Vreken et al., Citation2016). Organic matter is spectrally active in large regions of the Vis-NIR spectrum due to overtones and combinations of NH, CH, and CO groups (Ben-Dor et al., Citation1997).
In the FDR data set, four different wavelength regions in terms of wavelength and width (652–687, 1322–1443, 1856–1985, and 2290–2400 nm) were selected in the dynamic biPLS model. However, the two wavelength regions (1322–1443 and 1856–1985 nm) overlap with those selected in the reflectance data set (1402–1440 and 1846–1980 nm), suggesting the constant significance of soil free water for soil TC predictions. The 2290–2400 nm region contains many wavebands related to soil components, such as organic matter and Fe hydroxides. The wavelengths associated with organic matter composition were selected in the higher wavelength regions with precise information on the structural and functional groups in this data set rather than the reflectance data set because the FDR process enhances the narrow absorption features of organic matter. The wavelength region of 652–687 nm includes the wavebands related to Fe oxides (goethite and hematite), which are important for the stabilization of organic matter in soils (Saidy et al., Citation2012). These selected wavelengths were also identified as potentially important wavebands for soil TC prediction in our previous study using part of the current sample set (Kawamura et al., Citation2017).
Those selected wavelength regions did not substantially vary among the surface and sub-surface samples, while the spectral response of reflectance and FDR simply followed soil TC gradient of the samples. This suggested that the important wavelengths to estimate soil TC content did not change along the soil depth and that the developed model could be applicable to a wide range of soil samples in the rice fields in the central highlands of Madagascar. Nevertheless, in the current study, only a limited number of soil samples were collected from both surface and sub-surface layers, and the difference in soil TC content among surface and sub-surface soil samples varied 0.76–2.95%, which is much narrower than the variation among the all the 165 samples (). Further study is needed to confirm the effect of soil depth on the associated wavelengths to soil TC content.
3.4. Evaluation of the predictive ability
summarizes the number of selected wavebands (NW), the NW percentages of all available bands (NW% = NW/2001 bands × 100%), the optimal number of latent variables (NLVs) and the cross-validated mean R2 and RMSE in the validation data set (n = 24) and the R2, RMSE and RPIQ values from the model on the independent test data set (n = 42). The optimal NLVs, which were determined as the lowest RMSE values calculated from LOO-CV to avoid over-fitting of the model, were lower with FS-PLS (10 in the reflectance data set and 8 in the FDR data set) than with biPLS (12 and 10, respectively). The NW (NW%) remaining after 50 runs of dynamic biPLS was 398 (19.9%) for the reflectance data set and 399 (19.9%) for the FDR data set, suggesting that more than 80% of the waveband information from the soil reflectance spectrum was redundant and did not contribute to the prediction or disturbed the prediction. These results are consistent with previous findings suggesting that the spectral efficiency of PLS models can be improved through waveband selection and that the most useful information in the Vis-NIR region (400–2400 nm) predicted less than 20% of spectrum data (Kawamura et al., Citation2017, Citation2010; Wang et al., Citation2017).
Table 3. The mean R2 and RMSE from the 5-fold cross-validation using the training data sets based on PLS analyses and the R2, RMSE and RPIQ based on the model applied to the test data sets
shows the relationship between observed and predicted soil TC contents in the test data set (n = 42) from the FS-PLS and dynamic biPLS models using the reflectance and FDR spectra data sets. Clearly, the FDR data sets subjected to FS-PLS (R2 = 0.933, RMSE = 0.518) and biPLS (R2 = 0.940, RMSE = 0.494) yielded better predictive accuracies than the reflectance data sets subjected to FS-PLS (R2 = 0.826, RMSE = 0.809) and biPLS (R2 = 0.877, RMSE = 0.690). Based on the RPIQ values from the FDR data set (RPIQ>2.5), the quality and future applicability of our results can be considered to reflect excellent predictive ability. First derivative processing is a key preprocessing step in analytical chemistry for reducing the background signal (e.g. soil color or particle size) and enhancing the narrow absorption features related to soil properties (Brunet et al., Citation2007; Reeves et al., Citation2002). Thus, many researchers have used FDR spectra to estimate soil C contents (Chang et al., Citation2001; Kawamura et al., Citation2017; Reeves et al., Citation2002; Russell, Citation2003; Shepherd & Walsh, Citation2002).
Figure 5. Observed and predicted soil TC contents from the FS-PLS (blue) and dynamic biPLS (red) models using original reflectance (a) and FDR (b) data
The dynamic biPLS models showed better predictive ability than the FS-PLS models with fewer variables (selected wavelength regions), and a simpler and cheaper spectrophotometer can be used. These findings confirm previous results showing that the performance of PLS models can be improved through wavelength selection (Cramer et al., Citation2008; Du et al., Citation2004; Goicoechea & Olivieri, Citation2003; Jiang et al., Citation2002; Kasemsumran et al., Citation2004). Moreover, previous researchers have suggested that reducing large spectral datasets is valuable for more efficient storage, computation, and transmission (Yang et al., Citation2012) and for increasing the ease of spectral analysis (Viscarra Rossel & Lark, Citation2009).
In the present study, our results confirmed that soil TC could be rapidly predicted using selected wavelength regions with better predictive accuracy than FS-PLS, and sequential application of dynamic biPLS may be a feasible strategy for local assessments of soil TC. However, we note that our results were derived from heterogeneous and small numbers of soil samples (n = 162), which were collected from upland and lowland soils under various rice-based cropping systems, including wide ranges of soil types, in the central highland of Madagascar. Several researchers consider the reliability of predictions questionable when studying heterogeneous sample sets (Brunet et al., Citation2007). Particle size and arrangement may also affect the calibration due to the light transmission path (Chang et al., Citation2001). Moreover, if the calibration model is to be widely implemented, then large-scale data sets with regional or global content must be considered because the target function’s nature strongly affects the performance of the different prediction approaches, and, different studies therefore provide different results (Gholizadeh et al., Citation2018). Compare to previous researches using large spectral data set (Hermansen et al., Citation2016; Stevens et al., Citation2013), our data set was relatively small diversity on soil carbon content, which is difficult to assess the robustness and applicability at larger spatial scale. To map and assess the spatial distributions of the carbon stock at a larger spatial scale in Madagascar, evaluating an appropriate spatial scale with a larger data set is required (Ramifehiarivo et al., Citation2017; Saiano et al., Citation2013). Meanwhile, a study by Stevens et al. (Citation2013) using a large-scale EU soil survey data set (n = 20,000) reported that predictive ability of SOC calibrations related to the different levels of SOC and variations in other soil properties (sand and clay content). They also suggest that large spectral data set can be valuable to build local and more accurate models that are specific to given geographical entity or soil type. Therefore, to apply the methodology to soil characterization of the whole island of Madagascar, the calibration models should be evaluated for the effect of the heterogeneous data set and updated using a larger dataset collected from various regions in Madagascar in the future.
4. Conclusions
Wavelength region selection rather than individual waveband selection is one approach to simplifying variable selection complexity. In this study, we explored relevant wavelength regions for prediction of the TC content in paddy soils in Madagascar using dynamic biPLS. Our results confirmed that a large range of soil TC (0.65–10.15%) can be rapidly and non-destructively predicted by Vis-NIR spectroscopy, and that the predictive ability was improved by wavelength region selection with dynamic biPLS. Rapid estimations of soil TC can be used to assess soil fertility and supports farmers in implementing suitable fertilizer management practices to improve crop production. Sequential application of biPLS suggested that the important wavelength regions for estimating soil TC were 400–490, 1402–1440, 1846–1980 and 2151–2283 nm in the reflectance data sets (398 bands, 19.9%) and 652–687, 1322–1443, 1856–1985, and 2290–2400 nm in the FDR data sets (399 bands, 19.9%). The selected wavelength regions were considered to be associated with organic matter, Fe and Al oxides, which are common in tropical soils and effective for sorbing and stabilizing soil organic matter. These findings are consistent with previously known soil TC-related absorption features. Thus, the selected wavelength regions should be considered informative wavelength regions for estimating soil TC. Based on the selected FDR wavelength regions in the biPLS model, the soil TC predictions were considered to be excellent (RPIQ > 2.5), with an RMSE of 0.494% in the independent test data set. These findings indicated that sequential application of biPLS was a feasible approach for optimizing wavelength region selection and the combinations for soil TC prediction with Vis-NIR spectroscopy. To up-scale the soil TC calibrations, future analyses will be expanded to examine the effects of heterogeneous samples and extended to the whole island of Madagascar.
Acknowledgments
We would like to especially thank Dr. Naoki Moritsuka, Graduate School of Agriculture, Kyoto University in Japan, for his valuable comments on this manuscript.
Disclosure statement
No potential conflict of interest was reported by the authors.
Additional information
Funding
References
- Andersen, C. M., & Bro, R. (2010). Variable selection in regression – A tutorial. Journal of Chemometrics, 24(11–12), 728–737. https://doi.org/10.1002/cem.1360
- Araújo, S. R., Wetterlind, J., Demattê, J. A. M., & Stenberg, B. (2014). Improving the prediction performance of a large tropical vis-NIR spectroscopic soil library from Brazil by clustering into smaller subsets or use of data mining calibration techniques. European Journal of Soil Science, 65(5), 718–729. https://doi.org/10.1111/ejss.12165
- Bellon-Maurel, V., Fernandez-Ahumada, E., Palagos, B., Roger, J.-M., & McBratney, A. (2010). Critical review of chemometric indicators commonly used for assessing the quality of the prediction of soil attributes by NIR spectroscopy. TrAC Trends in Analytical Chemistry, 29(9), 1073–1081. https://doi.org/10.1016/j.trac.2010.05.006
- Bellon-Maurel, V., & McBratney, A. (2011). Near-infrared (NIR) and mid-infrared (MIR) spectroscopic techniques for assessing the amount of carbon stock in soils – Critical review and research perspectives. Soil Biology and Biochemistry, 43(7), 1398–1410. https://doi.org/10.1016/j.soilbio.2011.02.019
- Ben-Dor, E. (2002). Quantitative remote sensing of soil properties (Vol. 75). Academic Press. https://doi.org/10.1016/S0065-2113(02)75005-0
- Ben-Dor, E., Irons, J. R., & Epema, J. F. (1999). Soil reflectance. In A. N. Rencz (ed.), Manual of remote sensing: Remote sensing for the earth sciences (Vol. 3, pp. 111–188). John Wiley & Sons.
- Ben-Dor, E., Inbar, Y., & Chen, Y. (1997). The reflectance spectra of organic matter in the visible near-infrared and short wave infrared region (400–2500 nm) during a controlled decomposition process. Remote Sensing of Environment, 61(1), 1–15. https://doi.org/10.1016/S0034-4257(96)00120-4
- Bishop, J. L., Pieters, C. M., & Edwards, J. O. (1994). Infrared spectroscopic analyses on the nature of water in montmorillonite. Clays and Clay Minerals, 42(6), 702–716. https://doi.org/10.1346/CCMN.1994.0420606
- Boggia, R., Forina, M., Fossa, P., & Mosti, L. (1997). Chemometric study and validation strategies in the structure-activity relationships of new cardiotonic agents. Quantitative Structure-Activity Relationships, 16(3), 201–213. https://doi.org/10.1002/qsar.19970160303
- Brunet, D., Barthès, B. G., Chotte, J.-L., & Feller, C. (2007). Determination of carbon and nitrogen contents in Alfisols, Oxisols and Ultisols from Africa and Brazil using NIRS analysis: Effects of sample grinding and set heterogeneity. Geoderma, 139(1), 106–117. https://doi.org/org/http://dx.doi.10.1016/j.geoderma.2007.01.007
- Centner, V., Massart, D. L., de Noord, O. E., de Jong, S., Vandeginste, B. M., & Sterna, C. (1996). Elimination of uninformative variables for multivariate calibration. Analytical Chemistry, 68(21), 3851–3858. https://doi.org/10.1021/ac960321m
- Chang, C. W., Laird, D., Mausbach, M. J., & Hurburgh, C. R. J. (2001). Nearinfrared reflectance spectroscopy-principal components regression analyses of soil properties. Soil Science Society of America Journal, 65(2), 480–490. https://doi.org/10.2136/sssaj2001.652480x
- Cipullo, S., Nawar, S., Mouazen, A. M., Campo-Moreno, P., & Coulon, F. (2019). Predicting bioavailability change of complex chemical mixtures in contaminated soils using visible and near-infrared spectroscopy and random forest regression. Scientific Reports, 9(1), 4492. https://doi.org/10.1038/s41598-019-41161-w
- Clark, R. N., King, T. V. V., Klejwa, M., Swayze, G. A., & Vergo, N. (1990). High spectral resolution reflectance spectroscopy of minerals. Journal of Geophysical Research, 95(B8), 12653–12680. https://doi.org/10.1029/JB095iB08p12653
- Clark, R. N. (1999). Spectroscopy of rocks and minerals, and principles of spectroscopy. In A. N. Rencz (ed.), Manual of remote sensing. (pp. 3–58). John Wiley and Sons, Inc. https://speclab.cr.usgs.gov/PAPERS.refl-mrs/refl4.html
- Conforti, M., Buttafuoco, G., Leone, A. P., Aucelli, P. P. C., Robustelli, G., & Scarciglia, F. (2013). Studying the relationship between water-induced soil erosion and soil organic matter using Vis-NIR spectroscop and geomorphological analysis: A case study in southern Italy. Catena, 110, 44–58. https://doi.org/10.1016/j.catena.2013.06.013
- Conforti, M., Castrignanò, A., Robustelli, G., Scarciglia, F., Stelluti, M., & Buttafuoco, G. (2015). Laboratory-based Vis–NIR spectroscopy and partial least square regression with spatially correlated errors for predicting spatial variation of soil organic matter content. Catena, 124, 60–67. https://doi.org/10.1016/j.catena.2014.09.004
- Conforti, M., Matteucci, G., & Buttafuoco, G. (2018). Using laboratory Vis-NIR spectroscopy for monitoring some forest soil properties. Journal of Soils and Sediments, 18(3), 1009–1019. https://doi.org/10.1007/s11368-017-1766-5
- Cramer, J. A., Kramer, K. E., Johnson, K. J., Morris, R. E., & Rose-Pehrsson, S. L. (2008). Automated wavelength selection for spectroscopic fuel models by symmetrically contracting repeated unmoving window partial least squares. Chemometrics and Intelligent Laboratory Systems, 92(1), 13–21. https://doi.org/org/DOI10.1016/j.chemolab.2007.11.007
- Daniel, K. W., Tripathi, N. K., & Honda, K. (2003). Artificial neural network analysis of laboratory and in situ spectra for the estimation of macronutrients in soils of Lop Buri (Thailand). Australian Journal of Soil Research, 41(1), 47–59. https://doi.org/10.1071/SR02027
- De Santana, F. B., de Souza, A. M., & Poppi, R. J. (2018). Visible and near infrared spectroscopy coupled to random forest to quantify some soil quality parameters. Spectrochimica Acta Part A: Molecular and Biomolecular Spectroscopy, 191, 454–462. https://doi.org/10.1016/j.saa.2017.10.052
- Douglas, R. K., Nawar, S., Alamar, M. C., Mouazen, A. M., & Coulon, F. (2018). Rapid prediction of total petroleum hydrocarbons concentration in contaminated soil using vis-NIR spectroscopy and regression techniques. Science of the Total Environment, 616–617, 147–155. https://doi.org/10.1016/j.scitotenv.2017.10.323
- Du, Y. P., Liang, Y. Z., Jiang, J. H., Berry, R. J., & Ozaki, Y. (2004). Spectral regions selection to improve prediction ability of PLS models by changeable size moving window partial least squares and searching combination moving window partial least squares. Analytica Chimica Acta, 501(2), 183–191. https://doi.org/10.1016/j.aca.2003.09.041
- Emmert-Streib, F., & Dehmer, M. (2019). Evaluation of regression models: Model assessment, model selection and generalization error. Machine Learning and Knowledge Extraction, 1(1), 521–551. https://doi.org/10.3390/make1010032
- Fourty, T., Baret, F., Jacquemoud, S., Schmuck, G., & Verdebout, J. (1996). Leaf optical properties with explicit description of its biochemical composition: Direct and inverse problems. Remote Sensing of Environment, 56(2), 104–117. https://doi.org/10.1016/0034-4257(95)00234-0
- Galvao, L. S., & Vitorello, I. (1998). Role of organic matter in obliterating the effects of iron on spectral reflectance and colour of Brazilian tropical soils. International Journal of Remote Sensing, 19(10), 1969–1979. https://doi.org/10.1080/014311698215090
- Gholizadeh, A., Saberioon, M., Carmon, N., Boruvka, L., & Ben-Dor, E. (2018). Examining the performance of PARACUDA-II data-mining engine versus selected techniques to model soil carbon from reflectance spectra. Remote Sensing, 10(8), 8. https://doi.org/10.3390/rs10081172
- Goicoechea, H. C., & Olivieri, A. C. (2003). A new family of genetic algorithms for wavelength interval selection in multivariate analytical spectroscopy. Journal of Chemometrics, 17(6), 338–345. https://doi.org/10.1002/Cem.812
- Hermansen, C., Knadel, M., Moldrup, P., Greve, M. H., Gislum, R., & de Jonge, L. W. (2016). Visible-near-infrared spectroscopy can predict the clay/organic carbon and mineral fines/organic carbon ratios. Soil Science Society of America Journal, 80(6), 1486–1495. https://doi.org/10.2136/sssaj2016.05.0159
- Hunt, G. R. (1977). Spectral signatures of particulate minerals in the visible and near infrared. Geophysics, 42(3), 501–513. https://doi.org/10.1190/1.1440721
- IUSS Working Group, WRB. (2014). World reference base for soil resources 2014, Update 2015 international soil classification system for naming soils and creating legends for soil maps (World Soil Resources Reports No. 106). Food and Agriculture Organization of the United Nations.
- Jiang, J. H., James, R., Siesler, B. H. W., & Ozaki, Y. (2002). Wavelength interval selection in multicomponent spectral analysis by moving window partial least-squares regression with applications to mid-infrared and near-infrared spectroscopic data. Analytical Chemistry, 74(14), 3555–3565. https://doi.org/10.1021/ac011177u
- Johnson, J.-M., Vandamme, E., Senthilkumar, K., Sila, A., Shepherd, K. D., & Saito, K. (2019). Near-infrared, mid-infrared or combined diffuse reflectance spectroscopy for assessing soil fertility in rice fields in sub-Saharan Africa. Geoderma, 354, 113840. https://doi.org/10.1016/j.geoderma.2019.06.043
- Kasemsumran, S., Du, Y. P., Murayama, K., Huehne, M., & Ozaki, Y. (2004). Near-infrared spectroscopic determination of human serum albumin, [gamma]-globulin, and glucose in a control serum solution with searching combination moving window partial least squares. Analytica Chimica Acta, 512 (2), 223–230. http://www.sciencedirect.com/science/article/B6TF4-4C605NF-3/2/f9907924f85a5243807fc7afc37aca67
- Katuwal, S., Knadel, M., Moldrup, P., Norgaard, T., Greve, M. H., & de Jonge, L. W. (2018). Visible–near-infrared spectroscopy can predict mass transport of dissolved chemicals through intact soil. Scientific Reports, 8(1), 11188. https://doi.org/10.1038/s41598-018-29306-9
- Kawamura, K., Tsujimoto, Y., Nishigaki, T., Andriamananjara, A., Rabenarivo, M., Asai, H., Rakotoson, T., & Razafimbelo, T. (2019). Laboratory visible and near-infrared spectroscopy with genetic algorithm-based partial least squares regression for assessing the soil phosphorus content of upland and lowland rice fields in Madagascar. Remote Sensing, 11(5), 506. https://doi.org/10.3390/RS11050506
- Kawamura, K., Tsujimoto, Y., Rabenarivo, M., Asai, H., Andriamananjara, A., & Rakotoson, T. (2017). Vis-NIR spectroscopy and PLS regression with waveband selection for estimating the total C and N of paddy soils in Madagascar. Remote Sensing, 9(10), 10. https://doi.org/10.3390/rs9101081
- Kawamura, K., Watanabe, N., Sakanoue, S., Lee, H. J., Inoue, Y., & Odagawa, S. (2010). Testing genetic algorithm as a tool to select relevant wavebands from field hyperspectral data for estimating pasture mass and quality in a mixed sown pasture using partial least squares regression. Grassland Science, 56(4), 205–216. https://doi.org/10.1111/j.1744-697X.2010.00196.x
- Knadel, M., Viscarra Rossel, R. A., Deng, F., Thomsen, A., & Greve, M. H. (2013). Visible–near infrared spectra as a proxy for topsoil texture and glacial boundaries. Soil Science Society of America Journal, 77(2), 568. https://doi.org/10.2136/sssaj2012.0093
- Kuang, B., & Mouazen, A. M. (2011). Calibration of visible and near infrared spectroscopy for soil analysis at the field scale on three European farms. European Journal of Soil Science, 62(4), 629–636. https://doi.org/10.1111/j.1365-2389.2011.01358.x
- Kuang, B., Tekin, Y., & Mouazen, A. M. (2015). Comparison between artificial neural network and partial least squares for on-line visible and near infrared spectroscopy measurement of soil organic carbon, pH and clay content. Soil & Tillage Research, 146(Part B), 243–252. https://doi.org/10.1016/j.still.2014.11.002
- Kusumo, B. H., Hedley, C. B., Hedley, M. J., Hueni, A., Tuohy, M. P., & Arnold, G. C. (2008). The use of diffuse reflectance spectroscopy for in situ carbon and nitrogen analysis of pastoral soils. Australian Journal of Soil Research, 46(6–7), 623–635. https://doi.org/10.1071/SR08118
- Leardi, R. (2000). Application of genetic algorithm-PLS for feature selection in spectral data sets. Journal of Chemometrics, 14(5–6), 643–655. https://doi.org/10.1002/1099-128X(200009/12)14:5/6%3C643::AID-CEM621%3E3.0.CO;2-E
- Leardi, R., Boggia, R., & Terrile, M. (1992). Genetic algorithms as a strategy for feature selection. Journal of Chemometrics, 6(5), 267–281. https://doi.org/10.1002/cem.1180060506
- Leardi, R., & González, A. L. (1998). Genetic algorithms applied to feature selection in PLS regression: How and when to use them. Chemometrics and Intelligent Laboratory Systems, 41(2), 195–207. https://doi.org/10.1016/S0169-7439(98)00051-3
- Leardi, R., & Nørgaard, L. Sequential application of backward interval partial least squares and genetic algorithms for the selection of relevant spectral regions. (2004). Journal of Chemometrics, 18(11), 486–497. https://doi.org/10.1002/cem.893
- Li, H. D., Liang, Y. Z., Cao, D. S., & Xu, Q. S. (2012). Model-population analysis and its applications in chemical and biological modeling. TrAC – Trends in Analytical Chemistry, 38, 154–162. https://doi.org/10.1016/j.trac.2011.11.007
- Li, S., Ji, W., Chen, S., Peng, J., Zhou, Y., & Shi, Z. (2015). Potential of VIS-NIR-SWIR spectroscopy from the Chinese soil spectral library for assessment of nitrogen fertilization rates in the paddy-rice region, China. Remote Sensing, 7(6), 7029–7043. https://doi.org/10.3390/rs70607029
- Lucasius, C. B., & Kateman, G. (1994). Gates towards evolutionary large-scale optimization: A software-oriented approach to genetic algorithms–I. General perspective. Computers & Chemistry, 18 (2), 127–136. https://doi.org/10.1016/0097-8485(94)85007-0
- Morellos, A., Pantazi, X. E., Moshou, D., Alexandridis, T., Whetton, R., Tziotzios, G., Wiebensohn, J., Bill, R., & Mouazen, A. M. (2016). Machine learning based prediction of soil total nitrogen, organic carbon and moisture content by using VIS-NIR spectroscopy. Biosystems Engineering, 152, 104–116. https://doi.org/10.1016/j.biosystemseng.2016.04.018
- Nawar, S., & Mouazen, A. M. (2017). Predictive performance of mobile vis-near infrared spectroscopy for key soil properties at different geographical scales by using spiking and data mining techniques. Catena, 151, 118–129. https://doi.org/10.1016/j.catena.2016.12.014
- Ng, W., Minasny, B., Montazerolghaem, M., Padarian, J., Ferguson, R., Bailey, S., & McBratney, A. B. (2019). Convolutional neural network for simultaneous prediction of several soil properties using visible/near-infrared, mid-infrared, and their combined spectra. Geoderma, 352, 251–267. https://doi.org/10.1016/j.geoderma.2019.06.016
- Nørgaard, L., Saudland, A., Wagner, J., Nielsen, J. P., Munck, L., & Engelsen, S. B. (2000). Interval partial least-squares regression (iPLS): A comparative chemometric study with an example from near-infrared spectroscopy. Applied Spectroscopy, 54(3), 413–419. https://doi.org/10.1366/0003702001949500
- Oinuma, K., & Hayashi, H. (1965). Infrared study of mixed-layer clay minerals. American Mineralogist, 50(1958), 1213–1227. https://doi.org/10.1177/1356336X09345226
- Padarian, J., Minasny, B., & McBratney, A. B. (2019). Using deep learning to predict soil properties from regional spectral data. Geoderma Regional, 16, e00198. https://doi.org/10.1016/j.geodrs.2018.e00198
- Partnership, G. R. S. (2013). Rice almanac (4th ed.). International Rice Research Institute.
- Post, J. L., & Noble, P. N. (1993). The near-infrared combination band frequencies of dioctahedral smectites, micas, and illites. Clays and Clay Minerals, 41(6), 639–644. https://doi.org/10.1346/CCMN.1993.0410601
- Ramaroson, V. H., Becquer, T., Sá, S. O., Razafimahatratra, H., Delarivière, J. L., Blavet, D., Vendrame, P. R. S., Rabeharisoa, L., & Rakotondrazafy, A. F. M. (2018). Mineralogical analysis of ferralitic soils in Madagascar using NIR spectroscopy. Catena, 168, 102–109. https://doi.org/10.1016/j.catena.2017.07.016
- Ramifehiarivo, N., Brossard, M., Grinand, C., Andriamananjara, A., Razafimbelo, T., Rasolohery, A., Razafimahatratra, H., Seyler, F., Ranaivoson, N., Rabenarivo, M., Albrecht, A., Razafindrabe, F., & Razakamanarivo, H. (2017). Mapping soil organic carbon on a national scale: Towards an improved and updated map of Madagascar. Geoderma Regional, 9, 29–38. https://doi.org/org/http://dx.doi.10.1016/j.geodrs.2016.12.002
- Rawls, W. J., Pachepsky, Y. A., Ritchie, J. C., Sobecki, T. M., & Bloodworth, H. (2003). Effect of soil organic carbon on soil water retention. Geoderma, 116(1–2), 61–76. https://doi.org/10.1016/S0016-7061(03)00094-6
- Reeves, J., McCarty, G., & Mimmo, T. (2002). The potential of diffuse reflectance spectroscopy for the determination of carbon inventories in soils. Environmental Pollution, 116(Supplement 1), S277–S284. https://doi.org/10.1016/S0269-7491(01)00259-7
- Romero, D. J., Ben-Dor, E., Demattê, J. A. M., Souza, A. B. E., Vicente, L. E., Tavares, T. R., … Eitelwein, M. T. (2018). Internal soil standard method for the Brazilian soil spectral library: Performance and proximate analysis. Geoderma 312, 95–103. https://doi.10.1016/j.geoderma.2017.09.014
- Russell, C. A. (2003). Sample preparation and prediction of soil organic matter properties by near infra-red reflectance spectroscopy. Communications in Soil Science and Plant Analysis, 34(11–12), 1557–1572. https://doi.org/10.1081/CSS-120021297
- Saiano, F., Oddo, G., Scalenghe, R., La Mantia, T., & Ajmone-Marsan, F. (2013). DRIFTS sensor: Soil carbon validation at large scale (Pantelleria, Italy). Sensors, 13(5), 5603. http://www.mdpi.com/1424-8220/13/5/5603.
- Saidy, A. R., Smernik, R. J., Baldock, J. A., Kaiser, K., Sanderman, J., & Macdonald, L. M. (2012). Effects of clay mineralogy and hydrous iron oxides on labile organic carbon stabilization. Geoderma, 173–174, 104–110. https://doi.org/10.1016/j.geoderma.2011.12.030
- Scheinost, A. C., Chavernas, A., Barrón, V., & Torrent, J. (1998). Use and limitations of second-derivative diffuse reflectance spectroscopy in the visible to near-infrared range to identify and quantify Fe oxide minerals in soils. Clays and Clay Minerals, 46(5), 528–536. https://doi.org/10.1346/CCMN.1998.0460506
- Shepherd, D. K., & Walsh, G. M. (2002). Development of reflectance spectral libraries for characterization of soil properties. Soil Science Society of American Journal, 66(3), 988–998. https://doi.org/10.2136/sssaj2002.9880
- Sherman, D. M., & Waite, D. T. (1985). Electronic spectra of Fe3+ oxides and oxide hydroxides in the near IR to near UV. American Mineralogist, 70, 1262–1269.
- Soil Survey Staff. (2014). Keys to soil taxonomy (12th ed.). USDA-Natural Resources Conservation Service.
- Stenberg, B., Viscarra Rossel, R. A., Mouazen, A. M., & Wetterlind, J. (2010). Visible and near infrared spectroscopy in soil science. Advances in Agronomy, 107(C), 163–215. https://doi.org/10.1016/S0065-2113(10)07005-7
- Stevens, A., Nocita, M., Tóth, G., Montanarella, L., & van Wesemael, B. (2013). Prediction of soil organic carbon at the European scale by visible and near infrared reflectance spectroscopy. PlosOne, 8(6), e66409. https://doi.org/10.1371/journal.pone.0066409
- Tsujimoto, Y., Horie, T., Randriamihary, H., Shiraiwa, T., & Homma, K. (2009). Soil management: The key factors for higher productivity in the fields utilizing the system of rice intensification (SRI) in the central highland of Madagascar. Agricultural Systems, 100(1–3), 61–71. https://doi.org/10.1016/j.agsy.2009.01.001
- Tsujimoto, Y., Rakotoson, T., Tanaka, A., & Saito, K. (2019). Challenges and opportunities for improving N use efficiency for rice production in sub-Saharan Africa. Plant Production Science, 22(4), 1–15. https://doi.org/10.1080/1343943x.2019.1617638
- Van De Vreken, P., Gobin, A., Baken, S., Van Holm, L., Verhasselt, A., Smolders, E., & Merckx, R. (2016). Crop residue management and oxalate-extractable iron and aluminium explain long-term soil organic carbon sequestration and dynamics. European Journal of Soil Science, 67(3), 332–340. https://doi.org/10.1111/ejss.12343
- Viscarra Rossel, R. A., Behrens, T., Ben-Dor, E., Brown, D. J., Demattê, J. A. M., Shepherd, K. D., Shi, Z., Stenberg, B., Stevens, A., Adamchuk, V., Aïchi, H., Barthès, B. G., Bartholomeus, H. M., Bayer, A. D., Bernoux, M., Böttcher, K., Brodský, L., Du, C. W., Chappell, A., Genot, V., … Ji, W. (2016). A global spectral library to characterize the world’s soil. Earth-Science Review, 155, 198–230. http://dx.doi.10.1016/j.earscirev.2016.01.012
- Viscarra Rossel, R. A., & Lark, R. M. (2009). Improved analysis and modelling of soil diffuse reflectance spectra using wavelets. European Journal of Soil Science, 60(3), 453–464. https://doi.org/10.1111/j.1365-2389.2009.01121.x
- Viscarra Rossel, R. A., Walvoort, D. J. J., McBratney, A. B., Janik, L. J., & Skjemstad, J. O. (2006). Visible, near infrared, mid infrared or combined diffuse reflectance spectroscopy for simultaneous assessment of various soil properties. Geoderma, 131(1–2), 59–75. https://doi.org/10.1016/j.geoderma.2005.03.007
- Wang, Z., Kawamura, K., Sakuno, Y., Fan, X., Gong, Z., & Lim, J. (2017). Retrieval of chlorophyll-a and total suspended solids using iterative stepwise elimination partial least squares (ISE-PLS) regression based on field hyperspectral measurements in irrigation ponds in Higashihiroshima, Japan. Remote Sensing, 9(3), 264. https://doi.org/10.3390/rs9030264
- White, W. B. (1971). Infrared characterization of water and hydroxyl ion in the basic magnesium carbonate minerals. American Mineralogist, 56(October), 46–53. https://doi.org/10.1128/IAI.00496-08
- Whiting, M. L., Li, L., & Ustin, S. L. (2004). Predicting water content using Gaussian model on soil spectra. Remote Sensing of Environment, 89(4), 535–552. https://doi.org/10.1016/j.rse.2003.11.009
- Yang, H., Kuang, B., & Mouazen, A. M. (2012). Quantitative analysis of soil nitrogen and carbon at a farm scale using visible and near infrared spectroscopy coupled with wavelength reduction. European Journal of Soil Science, 63(3), 410–420. https://doi.org/10.1111/j.1365-2389.2012.01443.x
- Zhang, J., Cui, X., Cai, W., & Shao, X. (2017). Combination of heuristic optimal partner bands for variable selection in near-infrared spectral analysis. Journal of Chemometrics, 32(11), e2971. https://doi.org/10.1002/cem.2971