ABSTRACT
Prediction of crop yield and quality is an essential component of successful implementation of precision agriculture. Given the recent commercialization of low-cost multispectral cameras mounted on unmanned aerial vehicles and advances in machine learning techniques, prediction systems for crop characteristics can be more precisely developed using machine learning techniques. Therefore, the model performances for predicting wheat grain yield and protein content between the machine learning algorithms based on spectral reflectance and plant height (e.g. random forest and artificial neural network) and the traditional linear regression based on vegetation indices were compared. Although the machine learning approaches based on reflectance could not improve the grain yield prediction accuracy, they have great potential for development in predicting protein content. The linear regression model based on a 2-band enhanced vegetation index was capable of predicting the yield with a root-mean-square error (RMSE) of 972 kg ha−1. The random forest model based on reflectance was capable of predicting the protein content with an RMSE of 1.07%. The reflectance may have been linearly correlated with total biomass; thus, it was also linearly correlated with grain yield. There was a nonlinear relationship between the grain yield and protein content, which may have resulted in the higher model performance of the machine learning approaches in predicting protein content. However, this relationship would be variable according to the environment and agronomic practice. Further, field-scale research is required to assess how this relationship can be varied and affect the model generality, particularly when predicting protein content.
Graphical abstract
Introduction
Improving crop yield and quality while reducing production costs and environmental loads is a key goal in precision agriculture. To achieve this goal, variable rate application (VRA) of fertilizer is performed by prescriptions based on crop growth status and soil properties. Thus, the creation of an accurate grain yield and grain protein content map is essential for the successful implementation of precision agriculture technologies. Yield-monitoring systems equipped with a combine harvester are commonly used by farmers at large upland fields in Europe and the US. However, they remain rarely used in Asian countries because of few affordable yield-monitoring combine harvester with a moderate size. Low-cost precise prediction systems for crop yield and quality are urgently required for precision agriculture promotion in Asian countries.
Besides the use of yield maps for creating prescription maps for VRA in the following season, they enable farmers to examine the effect of their treatment such as agronomic practices (e.g. the amount of applied fertilizer and sown seeds) or cultivar selections on crop yield and quality; this is called on-farm experiments. Recently, on-farm experiments have been gaining popularity as they can provide useful information on the efficient crop management practices with farmers through the simple trials (Kyveryga, Citation2019). The conventional statistical approach should not be used for analyzing on-farm data as they do not satisfy the experimental design requirements. However, the novel statistical approaches and experimental designs have been proposed to analyze on-farm data effectively (Marchant et al., Citation2019; Tanaka, Citation2020). Although yield maps generated from yield-monitoring combine harvester are generally used for on-farm experiments, maps of UAV-based vegetation index are also available. However, vegetation index does not relate directly to the crop yield, and might merely reflect crop maturity that could disappear before harvest (Marchant et al., Citation2019).
Plant biomass, leaf area index, and grain yield can be estimated using various remote-sensing technologies (Doraiswamy et al., Citation2003). The optical sensors employed in satellite or handheld remote sensing are capable of measuring solar radiation reflected by vegetation at certain wavelength intervals. The spectral reflectance is known to be correlated with the vegetation characteristics. A normalization procedure is used to minimize confounding factors such as seasonal sun angle differences, soil background reflectance, and atmospheric effect. Therefore, vegetation indices including simple ratio (SR) and normalized difference vegetation index (NDVI) derived from the visible and near-infrared (NIR) bands have been the most widely used to assess spatiotemporal changes in vegetation characteristics for more than 30 years. However, the NDVI tends to saturate when the crops reach canopy closure, producing inaccurate biomass prediction (Huete et al., Citation2002). To overcome this saturation, various vegetation indices such as the 2-band enhanced vegetation index (EVI2) have been developed (Jiang et al., Citation2008). In general, crop yield is hypothesized to correlate with either total biomass (Agegnehu et al., Citation2014) or leaf chlorophyll content (Wood et al., Citation1993). Therefore, relationships between crop yield and many types of vegetation indices should be assessed when establishing prediction systems for crop yield.
Assuming empirical relationships between vegetation indices and crop characteristics, prediction models of crop yield and quality based on linear regression have been developed for a variety of crops including wheat (Liu et al., Citation2006; Serrano et al., Citation2000; Shanahan et al., Citation2001), corn (Teal et al., Citation2006), and rice (Chang et al., Citation2005). The advantage of this traditional approach based on vegetation indices is its simplicity and computational ease. On the other hand, machine learning techniques that are capable of handling large amounts of input variables (e.g. support vector regression (SVR), random forest (RF), artificial neural network (ANN)) have been widely tested for agricultural sciences (Chlingaryan et al., Citation2018; Tsouros et al., Citation2019; Yang et al., Citation2017). Machine learning techniques refer to a large number of non-linear data-driven algorithms that are primarily used for data mining and pattern recognition, and they have frequently outperformed traditional linear regressions. Thus, there is an arising question as to whether crop characteristic prediction based on spectral reflectance can be more efficiently and precisely modeled using machine learning techniques without any prior knowledge compared to traditional approaches based on vegetation indices. Furthermore, commercial multispectral cameras mounted on unmanned aerial vehicles (UAVs) are currently increasingly available not only to researchers but also to farmers and the agricultural consultancy. UAV-based remote sensing primarily has two advantages over satellite platforms: (i) acquisition of higher spatiotemporal resolution data with less atmospheric effects and (ii) capability of height estimation derived from Structure from Motion (SfM) processing (Bendig et al., Citation2013; Holman et al., Citation2016). Plant height is among the essential crop characteristics for wheat to determine yield and susceptibility to lodging (Chapman et al., Citation2014).
In Japan, wheat (Triticum aestivum) is primarily grown in upland fields converted from paddy fields in a multiple cropping system. Wheat production has been strongly recommended in upland fields after converting from paddy fields, because of the low price of rice and the high domestic demand. However, wheat yield in Japan has been nearly half of that in European countries (e.g. UK and France) over 10 years (FAO, Citation2020). There is an urgent need to improve wheat yield in Japan. On the other hand, grain protein content is a very important wheat quality as it determines flour processability. The vegetation indices were well correlated with the wheat grain yield and protein contents during the grain filling stage (Liu et al., Citation2006; Shanahan et al., Citation2001). A previous study using satellite imagery observed that accumulated vegetation indices including NDVI from the jointing to grain filling stage were significantly positively correlated with either wheat grain yield or protein content (Wang et al., Citation2014). Vegetation index would just represent the high total biomass and N stock, which could positively be correlated with wheat grain yield. Therefore, the positive relationships between vegetation index and grain protein content may have indicated that plant N status was sufficient for protein accumulation in the grain until the grain filling stage. However, inverse relationships between wheat grain yield and protein content have been a controversial topic (Cox et al., Citation1986; Rharrabti et al., Citation2001); thus, balancing between wheat yield and quality is of interest to farmers, milling industry, and crop scientists. A study on crop model further indicated that relationships between grain yield and protein content were not always simply linear, depending on availability of tissue N (Asseng et al., Citation2002). Thus, there might be nonlinear relationships between wheat grain protein content and remotely sensed data (e.g. reflectance). This indicates a possibility for establishing precise prediction systems not only for grain yield but also for protein content using machine learning approaches.
The objective of this study was to assess the potential of machine-learning algorithms and commercial multispectral cameras for the development of within-field prediction of grain yield and protein content of winter wheat. The model performance between the machine learning algorithms including SVR, RF, and ANN and the traditional regression approaches based on vegetation indices including SR, NDVI, green NDVI (GNDVI), EVI2, Green chlorophyll index (CIgreen), Red-edge chlorophyll index (CIred-edge), and normalized difference red-edge index (NDRE) were compared. The effect of plant height (PH) derived from SfM processing on model performance was considered. To create a practical model for predicting grain yield and protein content in winter wheat, a wide range of data is required. Data obtained from farmers’ fields include more variable and unpredictable yield-limiting factors than that from experimental fields; thus, yield surveys were conducted in farmers’ fields. According to the best fit models, maps of predicted yield and protein content were generated to discuss their feasibility for practical applications including on-farm experiments in the field.
Materials and methods
Plant sampling and analysis
Yield surveys were conducted in farmers’ fields in Sotohama, Kaizu, Gifu, Japan (35°11ʹ N, 136°40ʹ E) for 2 years (2018 and 2019). The mean annual precipitation in this location is 1773 mm and the mean annual temperature is 15.4°C. The land use system involved the cropping of three crops (paddy rice-winter wheat-soybean) over 2 years. The most popular local winter wheat cultivar ‘Satonosora’ was grown under a rainfed condition. The soil is a sandy loam with C:N ratio 11 and pH 6.5.
In 2018, two upland fields converted from paddy fields were surveyed (Fields 1 and 2). Winter wheat at 80 kg seeds ha−1 was sown in rows 0.15 m apart on 25 November 2017. Both fields received the same amounts of basal fertilizer (11.7 g N m−2, 1.1 g P2O5 m−2, and 1.1 g K2O m−2), which have a slow-release characteristic, and top dressing (5.0 g N m−2, 1.0 g P2O5 m−2, and 4.0 g K2O m−2) during the tillering stage. Plant samples were collected from four transects at each field. The sampling points occurred at 5-m intervals along the long-side transect (east–west axis) and at 2.5-m intervals along the three narrow-side transects (north–south axes) to investigate within-field spatial variability. Plant samples were harvested from a 0.6-m2 area during the maturity stage (4 June 2018). The number of established seedling ranged from 27 to 180 plants m−2 (the mean value was 103 plants m−2). In 2019, 2 upland fields converted from paddy fields were further surveyed (Fields 3 and 4). The management practices were nearly the same as those in 2018 although there were differences in the sowing date. Winter wheat was sown on 17 November 2018. Plant samples were collected from 10 m × 15 m grid points across each field. Plant samples were harvested from a 1.0-m2 area during the maturity stage (on 5 June 2019). The number of established seedlings ranged from 40 to 142 plants m−2 (the mean value was 96 plants m−2).
After measuring the number of panicles, the plant materials were divided into grain and straw. Threshed grain was sieved through a 2.2-mm mesh. The dry matter weight was determined after the subsamples were oven-dried at 70°C to a constant weight. The wheat yield was calculated at 13.0% moisture content. A total of 327 samples, comprising 192 samples in 2018 and 136 samples in 2019, were collected. All grain samples were finely ground using a plant mill. The total N content of the grain was determined using an indophenol method (Mulvaney, Citation1996) following Kjeldahl digestion. Grain protein content was calculated as total N content × 5.70 at 13.5% moisture content.
Analysis of UAV-based imagery
A multispectral camera (sequoia+, Parrot, France) was mounted in a UAV (Solo, 3DR, USA). The spectral band widths were green (530–570 nm), red (640–680 nm), red edge (730–740 nm), and near infrared (NIR) (770–810 nm). Flights were conducted during the tillering stage (14 February 2018, and 22 February 2019) and grain filling stage (5 May 2018, and 3 May 2019) using an autopilot software (Mission planner version 1.3.68, ArduPilot Dev Team, Citation2019). The images captured in the tillering stage were used as a reference when estimating crop height, as described hereafter. All images were taken between 12:00, 14:00 under a clear sky condition. The flight altitude was 65 m above ground level with a flight speed of 5 m s−1. These settings allowed an 85% image forward overlap, 65% image side overlap, and ground sample distance (GSD) of 0.06 m pixel−1. The coordinates of the ground control points (GCPs) were determined using global navigation satellite system (GNSS) receivers (M8T, U-Blox, Switzerland) and an open-source program package for GNSS positioning (RTKLIB version 2.4.3) (Takasu, Citation2007) with 0.01-m precision. The relative GCP heights were measured using a millimetric total station (NST-Clr, Nikon, Japan). The X, Y, and Z values of the GCPs were used for the geometric correction of the orthomosaic during the subsequent SfM processing. The captured multispectral images were processed to generate a digital surface model (DSM) and reflectance maps using an SfM software (Pix4D mapper version 4.4.12, Pix4D, Switzerland). The DSM representing the crop surface is referred to as the crop surface model (CSM) hereafter. Plant height was evaluated by subtracting the ground DSM during the tillering stage from the CSM during the grain filling stage. The DSM during the tillering stage can be used as a ground height reference because the wheat canopy had not developed well and was ignorable during the early tillering stage. The workflow for PH from CSM (PHCSM) is described in detail by Bendig et al. (Citation2013). Vegetation indices including SR, NDVI, GNDVI, CIgreen, CIred-edge, and NDRE were calculated, as shown in . Vegetation indices such as SR and NDVI represent the most conventional indices while the others represent lately developed ones. Further processing was carried out in QGIS 3.4.0. The mean values of the PHCSM, reflectance, and vegetation indices were calculated in the harvested plots, which form the area of interest, and were used for further regression analyses. The DSM accuracy was validated by the measured height which was not used for the GCP (root-mean-square error (RMSE) = 0.22 m) value.
Table 1. Vegetation indices
Data analysis and statistics
In the present study, the model accuracy for predicting grain yield and protein content in winter wheat was compared among the linear regression (LM), SVR, RF, and ANN models. A total of 327 samples, including values of PHCSM and reflectance of 4 wave bands as predictor variables and grain yield and grain protein content as dependent variables, were prepared during the 2-year experiment. The linear regression analyses were performed using the Python module statsmodels (version 0.10.1) (Seabold & Perktold, Citation2010). SVR and RF were performed using the Python module scikit-learn (version 0.21.3) (Pedregosa et al., Citation2011). ANN was performed using the Keras (version 2.2.4) machine learning application programming interface (Chollet et al., Citation2015) with the TensorFlow (version 1.14.0) (Abadi et al., Citation2015) backend.
Prior to model training, all predictor variables were standardized. A total of 327 samples were randomly split into 227 samples as the training dataset and 100 samples as the test dataset. The random number seed was fixed to ensure that both the grain yield and protein content had an equality of variance between the training and test datasets according to the F-test. The linear regression analyses were directly applied to the entire training dataset to establish the model. For the parameter optimization in the machine learning algorithms (SVR, RF, and ANN), a grid search with 5-fold cross-validation was performed for the training dataset to minimize mean square error as an evaluation metric. Randomized cross-validation splitters may return different results for each call of the split, which also affects the estimation of the best parameters. Thus, consecutive integers were used for the K-fold iterator to run at least 30 trials. The most frequent combinations of the best parameters derived from the grid search with a 5-fold cross-validation were used for the parameter tuning. After the parameter determination, the output accuracies were evaluated based on the r2 and RMSE values calculated from the relationship between the predicted values from each trained model and observed values in the test dataset.
Support vector machine analysis is among the popular machine learning tools for both classification and regression and was mainly developed by Vapnik (Citation1995). The first step in using SVR is the selection of a kernel function. The most frequently used kernel function is the radial basis function (RBF), which is used in this study. Three parameters should be optimized in the SVR model: C, the penalty parameter of the error term (default = 1.0); γ, the Kernel coefficient for the RBF (default = 1/the number of independent variables); and ε, the loss function that ignores errors (default = 0.1).
Random Forest is an ensemble learning technique developed by Breiman (Citation2001) to improve the classification and regression tree method by combining a large set of tree predictors. Three parameters should be optimized in the RF regression model: ntree, the number of trees grown based on a bootstrap sampling (default = 10); mtry, the number of different predictors tested at each node (default = 2); and nodesize, the minimal size of the terminal nodes of the trees (default = 1). Gini importance index was calculated to assess the relative importance of each predictor.
Artificial neural network is a computational structure based on a collection of connected units or nodes termed artificial neurons. Artificial neural network consists of input and output layers as well as hidden layers that transform the previous layer (input or hidden layers) into subsequent layers (hidden or output layers). Thus, the appropriate number of hidden layers is among the most critical tasks in neural network design. A network with too few hidden nodes is incapable of modeling complex patterns, which may lead to only a linear estimate of the actual trend. In contrast, a network with too many hidden nodes will follow the noise in the data because of overparameterization, which may lead to poor generalization for untrained data. The training time including the process of parameter optimization increases with the number of hidden layers. Hence, networks with 1–3 hidden layers (ANN-1, ANN-2, and ANN-3) were adopted to compare their performance in our study. Furthermore, the ANN model requires optimization of the parameters including epoch, batch size, optimizer, learning rate, network weight initialization, neuron activation function, and number of neurons.
Linear regression analyses were performed as the traditional approach to model the relationships between the vegetation indices and grain yields and protein contents. Furthermore, simple linear regression and polynomial regression (2nd–5th degree) analysis were performed to understand the relationships between the grain yield and protein content. Model selection was performed according to the r2 and Akaike information criteria (AIC). A P-value <0.05 was considered to be statistically significant.
Mapping yield and protein content
According to the validation results, the best fit models for predicting yield and protein content were selected. The models were applied to the reflectance and vegetation indices obtained from Fields 1 and 3 to generate maps of predicted grain yield and protein content. The mean values of reflectance and vegetation indices were calculated in each 1-m-grid-sized plot which approximately corresponded to the harvested areas for sampling.
Results
Grain yield and protein content prediction models
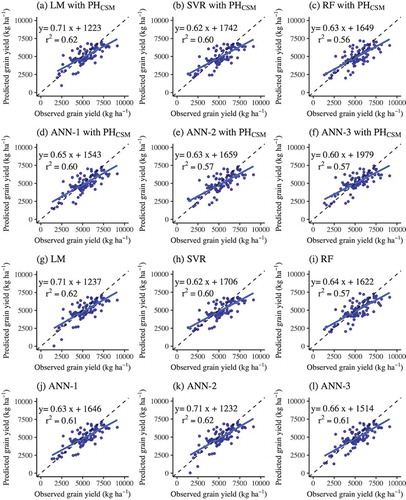
The models for predicting wheat grain yields accounted for 56–62% of the variance for the validation (). The RMSE values ranged from 990 to 1059 kg ha−1 for the validation. Although the RF model with PHCSM and reflectance showed the highest r2 (0.79) and the lowest RMSE (676 kg ha−1) for the calibration, it showed the lowest r2 (0.52) and highest RMSE (1059 kg ha−1) for the validation. The r2 and RMSE values of each model with the input of PHCSM and reflectance were nearly the same as those without the input of PHCSM. The LM underestimated the grain yields for the samples with low yields (<2500 kg ha−1) ().
Table 2. Results of reflectance-based prediction models of grain yield with different predictors
Figure 1. Relationships between observed and predicted grain yield derived from machine learning approaches: (a) LM, (b) SVR, (c) RF, (d) ANN-1, (e) ANN-2, and (f) ANN-3 with predictor variables of PHCSM and reflectance, and (g) LM, (h) SVR, (i) RF, (j) ANN-1, (k) ANN-2, and (l) ANN-3 with predictor variables of reflectance. The solid lines represent regression lines. The broken lines represent the 1:1 relationships. The graphs include the r2 and regression equations
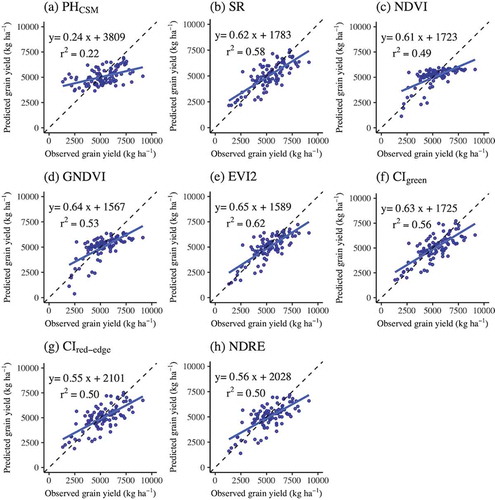
The results of the simple linear regression models based on PHCSM and vegetation indices showed that the r2 values ranged from 0.22 to 0.62 and that of the RMSE ranged from 972 to 1361 kg ha−1 (). The model based on EVI2 resulted in the highest r2 (0.62) and the lowest RMSE (972 kg ha−1) for the validation. The models based on the GNDVI and NDVI showed that the predicted grain yields asymptotically reached saturation under the moderate-to-high observed grain yields (>3000 kg ha−1) ().
Table 3. Results of vegetation-index-based prediction models of grain yield
Figure 2. Relationships between observed and predicted grain yield derived from traditional linear regression analyses based on (a) PHCSM and vegetation indices including (b) SR, (c) NDVI, (d) GNDVI, (e) EVI2, (f) CIgreen, (g) CIred-edge, and (h) NDRE. The solid lines represent regression lines. The broken lines represent the 1:1 relationships. The graphs include the r2 and regression equations
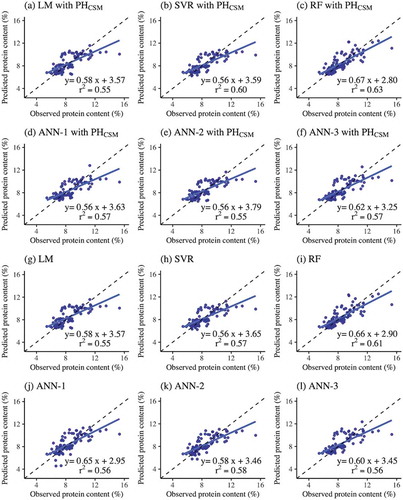
Prediction models for wheat grain protein content accounted for 55–63% of the variance for the validation (). The RMSE values ranged from 1.07% to 1.18% for the validation. The RF model based on PHCSM and reflectance showed the highest r2 and the lowest RMSE for both calibration (r2 = 0.73, RMSE = 1.02%) and validation (r2 = 0.63, RMSE = 1.07%). There were no substantial differences in the values of r2 and RMSE between the models with PHCSM and reflectance and the models without PHCSM. All models showed lower predicted grain protein content than that of the observed value for the samples with high protein content (>12%) ().
Table 4. Results of prediction models of grain protein content using different predictors
Figure 3. Relationships between observed and predicted grain protein content derived from machine learning approaches: (a) LM, (b) SVR, (c) RF, (d) ANN-1, (e) ANN-2, and (f) ANN-3 with predictor variables of PHCSM and reflectance and (g) LM, (h) SVR, (i) RF, (j) ANN-1, (k) ANN-2, and (l) ANN-3 with predictor variables of reflectance. The solid lines represent regression lines. The broken lines represent the 1:1 relationships. The graphs include the r2 and regression equations
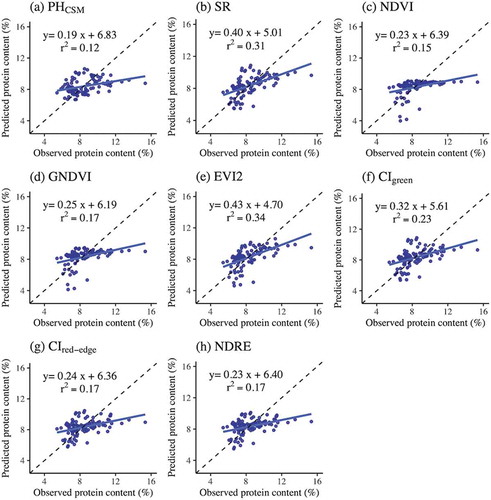
The results of the simple linear regression models based on PHCSM and vegetation indices showed that the r2 values ranged from 0.12 to 0.34 and the RMSE ranged from 1.45% to 1.67% (). The model based on the EVI2 resulted in the highest r2 (0.34) and the lowest RMSE (1.45%) for the validation. The relationships between the observed and predicted grain protein content for the validation showed relatively low values of r2 for all models ().
Figure 4. Relationships between observed and predicted grain protein content deriving from traditional linear regression analyses based on (a) PHCSM and vegetation indices including (b) SR, (c) NDVI, (d) GNDVI, (e) EVI2, (f) CIgreen, (g) CIred-edge, and (h) NDRE. The solid lines represent regression lines. The broken lines represent the 1:1 relationships. The graphs include the r2 and regression equations
In both RF models predicting grain yield and protein content, the values of Gini importance index of the NIR and red bands were relatively high while those of PHCSM and green band were very low (). The values of Gini importance index of the red and red-edge bands were slightly higher in the RF models predicting grain protein content rather than grain yield.
Figure 5. Random forest Gini importance index for models predicting (a) grain yield and (b) protein content
Relationship between wheat grain yield and protein content
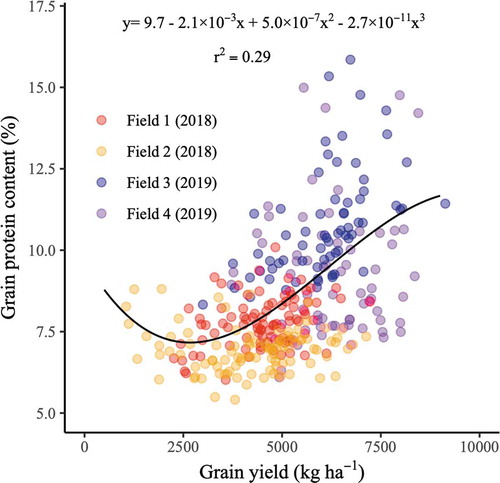
The grain yield and protein content showed a different tendency comparing the 2017 and 2018 experiments (). Grain yield and protein content were also low-to-moderate during 2017. Meanwhile, grain yield was moderate-to-high and protein content largely varied among samples during 2018. Simple linear regression and polynomial regression (2nd–5th degree) analyses were performed to model the relationships between grain yield and protein content. The cubic model provided the best fit model with the highest r2 value (0.29) and lowest AIC (1248). The grain protein content decreased along with the grain yield up to the inflection point of 2675 kg ha−1. In contrast, it increased along with grain yield from the inflection point.
Figure 6. Relationship between observed grain yield and protein content. The solid line represents the regression curve with the r2 and regression equations. The red and orange circles represent samples in 2017 from Field 1 and Field 2, respectively. Blue and purple circles represent samples in 2018 from Field 3 and 4, respectively
Within-field spatial variability in yield and protein content
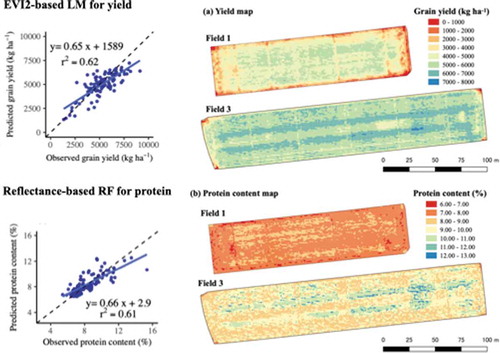
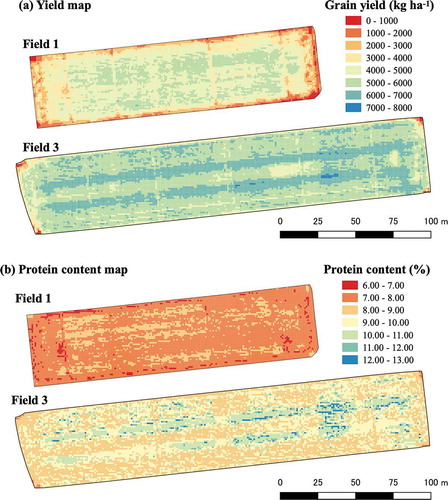
According to the mode validation results (), the EVI2-based linear regression model and reflectance-based RF models were employed for creating yield and protein content maps, respectively. The lower yield occurred approximately 5 m from the edge of the fields while the higher yield occurred in strips along the tractor’s direction of travel (). The protein content showed a similar within-field variation.
Table 5. Results of vegetation-index-based prediction models of protein content
Figure 7. Maps of predicted (a) grain yield and (b) protein content for Field 1 and Field 3. The yield was predicted using the EVI2-based linear regression model and protein content using the reflectance-based RF model
Discussion
The model performances for predicting wheat grain yield and protein content were compared between the machine learning approaches based on reflectance and traditional linear regression based on vegetation indices. The validation results (r2 and RMSE) indicated that the machine learning approaches generally outperformed the traditional regression approaches in predicting both grain yield and protein content with the exception of the EVI2-based model for grain yield prediction (). Among the models for predicting grain yield, the linear regression model based on EVI2 showed the best model performance with the highest r2 (0.62) and lowest RMSE (972 kg ha−1) (). The relationship between the observed and predicted grain yield showed that the LM based on PHCSM and reflectance provided better yield estimation (slope = 0.71, intercept = 1223) whereas it greatly underestimated grain yield for the samples with low yields (<2500 kg ha−1) (). Thus, the relationships between the observed and predicted grain yield also support that the EVI2-based model had a higher performance (slope = 0.65, intercept = 1589). However, this finding is inconsistent with the assumption that the machine learning approaches would be superior to traditional linear regression. Indeed, the results of RF were superior to the other models in the training stage, but the lowest in the validation stage (). Minasny and McBratney (Citation2013) also observed that RF can easily overfit the data, implying that the model describes the noise in the data. Furthermore, there was no clear difference in model accuracy between the LM and ANN even with the different number of hidden layers. According to previous research predicting corn yield from hyperspectral data with 72 wavebands (Uno et al., Citation2005), the difference in model performance between the ANN and LM was not clearly identified. Thus, the relationship between crop yield and reflectance may not be as complex as the machine learning approaches (e.g. RF and ANN) results in a significant improvement in the yield prediction.
Among the models for predicting grain protein content, the machine learning models outperformed the traditional regression models (). Although overfitting was observed for the RF models for predicting grain protein content as well as grain yield, as the r2 and RMSE values provided much better fitting for calibration than for validation, the RF models showed the best performance with the highest r2 and lowest RMSE (). The Gini importance index indicated that the NIR and red bands were important predictors for both of the models predicting grain yield and protein content (). The relative importance of the red-edge band was not ignorable in the prediction model for grain protein content. On the other hand, there were no vegetation indices including all three bands (red, red edge, and NIR bands). Thus, the red-edge band may have contributed to improve the model accuracy for grain protein content.
Contrary to expectations, there were no great improvements in model performance of the machine learning approaches by the addition of PHCSM as a predictor variable (). The Gini importance index also indicated that PHCSM was not an important predictor for the both RF models predicting grain yield and protein content (). These results may be attributed to the PHCSM data quality. The DSM accuracy depends on the spatial resolution, and our accuracy (RMSE = 0.22 m at a GSD of 0.06 m pixel−1) corresponded to that of a previous study (RMSE = 0.35 m at a GSD of 0.05 m pixel−1) by Zarco-Tejada et al. (Citation2014). In contrast, Holman et al. (Citation2016) demonstrated that the DSM accuracy could be enhanced by a very high spatial resolution (RMSE = 0.03–0.07 m at a GSD of 0.01 m pixel−1). Furthermore, the accuracy of PHCSM depends on metrics extracting pixels (e.g. top 1% values in regions of interest) (Kawamura et al., Citationin press), so the mean values in regions of interest might not have reflected actual plant height. To improve model performance via the addition of PHCSM, it may be necessary to capture the images at a lower height to enhance the GSD and to consider the best metrics extracting essential pixels representing actual plant height. However, this would also increase the cost of image acquisition and processing (e.g. the number of times to capture and total flight time, and data preprocessing). A multispectral camera with a higher resolution may be required; otherwise, PHCSM would not play a role in increasing the model accuracy for predicting wheat grain yield and protein content in practical use.
It is crucial to understand the relationship between grain yield and protein content because this physiological relationship can potentially affect model performance, specifically for predicting protein content. The cubic model was the best fit model to assess the relationship between grain yield and protein content (). Inverse relationships between wheat grain yield and protein content have been widely discussed in previous literature (Cox et al., Citation1986; Rharrabti et al., Citation2001). There was also an inverse relationship up to an inflection point of 2675 kg ha−1 in this study (). This inverse relationship may be attributed to the dilution effect of protein by nonprotein compounds (Acreche & Slafer, Citation2009; Cox et al., Citation1986; Kibite & Evans, Citation1984). However, this relationship turned positive from the inflection point. This nonlinear relationship might be among the reasons why the machine learning approaches based on reflectance outperformed the traditional regression model when predicting protein content. According to the previous investigation, the farmers’ fertilizer broadcaster without GPS positioning and a spreader control computer easily resulted in uneven fertilizer distribution, which may have greatly affected the within-field spatial variability in wheat grain yield at the study site (Tanaka et al., Citation2019). Because there was a one and one-half lap course for the broadcaster with an application width of approximately 18 m, the strips along the tractor’s direction of travel probably coincided with the fertilizer application overlap (). Not only increasing the N fertilization rate but also splitting the N rate had a significantly positive effect on grain protein content (Fuertes-Mendizábal et al., Citation2010). Delayed N application generally contributed to an increase in the grain protein content (Zebarth et al., Citation2007). Considering slow-release fertilizer was used as the basal fertilizer in the study site, the high-yield canopy may have been more accessible to N not only during the tillering stage but also during the grain filling stage, which in turn sufficiently contributed to enhancing the grain protein content. However, the relationship between grain yield and protein content showed a different tendency over the two-year experiment. The large differences between years could be attributed to the different sowing dates. The plants may have had longer growing durations in the fields harvested in 2019 as these fields were sown 8 days earlier than the former year. Furthermore, the correlations between grain yield and protein content were not significant in Field 2 and 4, while these were significantly positive in Field 1 and 3 (data not shown). Various factors including not only climate and spatial variability in soil properties but also spatial heterogeneity caused by farmers’ operations (e.g. fertilizer application) could also affect this relationship. Further field experiments under various environments and agronomic practices are required to evaluate the relationship between the yield and protein content and model generality, particularly for protein content prediction.
Table 6. Results of simple linear regression and polynomial regression analyses of the relationship between observed grain yield and protein content
The UAV-based prediction systems developed in this study can provide substantial spatial data on crop yield and quality without high-cost investment on the yield-monitoring combine harvester. It can further provide an opportunity of on-farm experiments for farmers particularly in Asian countries where the yield-monitoring combine harvester has rarely been used. However, the RMSE value of the best yield prediction model was 971 kg ha−1. Standard errors detected in on-farm experiments for winter wheat using yield-monitoring combine harvester ranged from 30 to 320 kg ha−1 (Marchant et al., Citation2019). Given the 95% confidence intervals or least significant differences can be computed multiplying standard errors by 1.96, these values ranged from 58 to 627 kg ha−1. Therefore, the accuracy of the UAV-based prediction systems may be imperfect. Further studies are needed to enhance the yield prediction accuracy by using multi-temporal imagery and machine learning approaches. On the other hand, the maps of predicted yield and protein content indicated that extremely low values were observed around the edge of the fields, and the high values were observed in strips along the tractor’s direction of travel (). As discussed above, these variations may have been associated with the uneven fertilizer spreading due to the limitation of machinery performance (Tanaka et al., Citation2019). These kinds of artificial noises become identifiable if the resolution is very high. Yield-monitoring combine harvester may not be able to detect such artifacts because the header width might be larger than the noises. Therefore, UAV-based prediction systems are advantageous as it can facilitate to identify the artificial noises that should be trimmed before statistical analysis for on-farm experiments.
Conclusions
Machine learning approaches based on reflectance were not able to improve the prediction accuracy of grain yield. However, our results indicated a great potential of machine learning approaches to predict grain protein. Furthermore, PHCSM did not contribute to an increase in the model accuracy in predicting both grain yield and protein. Consequently, the linear regression model based on EVI2 was capable of predicting wheat grain yield with an RMSE of 972 kg ha−1. The RF model based on reflectance was capable of predicting grain protein content with an RMSE of 1.07%. The UAV-based prediction systems developed in this study can provide substantial spatial data without high-cost investment on the yield-monitoring combine harvester, which can further enable farmers to implement on-farm experiments. However, the model accuracy may not be sufficient to detect the relatively small treatment effect in on-farm experiments. The result indicated a nonlinear relationship between grain yield and protein content. This relationship may vary according to the environment and agronomic practice which may have included the effect of the farmers’ operation to explain the within-field variability (e.g. fertilizer application). Further, field-scale research is required to assess how this relationship can be varied and affect the model performance in predicting protein content.
Acknowledgments
The authors wish to thank Dr. Kensuke Kawamura for his help in applying statistical analyses and cross-validation and the farming company ‘Fukue-eino’ for allowing survey of their fields.
Disclosure statement
No potential conflict of interest was reported by the authors.
Additional information
Funding
References
- Abadi, M., Agarwal., A., Barham, P., Brevdo, E., Chen, Z., Citro, C., Corrado, G. S., Davis, A., Dean, J., Devin, M., Ghemawat, S., Goodfellow, I., Harp, A., Irving, G., Isard, M., Jia, Y., Jozefow- icz, R., Kaiser, L., Kudlur, M., Levenberg, J., Mané, D., Monga, R., Moore, S., Murray, D., Olah, C., Schuster, M., Shlens, J., Steiner, B., Sutskever, I., Talwar, K., Tucker, P., Vanhoucke, V., Vasudevan, V., Viégas, F., Vinyals, O., Warden, P., Watten- berg, M., Wicke, M., Yu, Y., & Zheng, X. (2015). TensorFlow: Large-scale machine learning on heterogeneous systems. Software Retrieved October 31, 2019 from tensorflow.org
- Acreche, M., & Slafer, G. A. (2009). Variation of grain nitrogen content in relation with grain yield in old and modern Spanish wheats grown under a wide range of agronomic conditions in a Mediterranean region. The Journal of Agricultural Science, 147(6), 657–667. https://doi.org/10.1017/S0021859609990190
- Agegnehu, G., vanbeek, C., & Bird, M. I. (2014). Influence of integrated soil fertility management in wheat and tef productivity and soil chemical properties in the highland tropical environment. Journal of Soil Science and Plant Nutrition, 14(3), 532–545. http://doi.org/10.4067/S0718-95162014005000042
- ArduPilot Dev Team. (2019). Mission planner home. Retrieved October 27, 2019 from http://ardupilot.org/planner/index.html
- Asseng, S., Bar-Tal, A., Bowden, J. W., Keating, B. A., Van Herwaarden, A., Palta, J. A., Huth, N. I., & Probert, M. E. (2002). Simulation of grain protein content with APSIM-Nwheat. European Journal of Agronomy, 16(1), 25–42. https://doi.org/10.1016/S1161-0301(01)00116-2
- Bendig, J., Bolten, A., & Bareth, G. (2013). UAV-based Imaging for Multi-Temporal, very high Resolution Crop Surface Models to monitor Crop Growth Variability<br>Monitoring des Pflanzenwachstums mit Hilfe multitemporaler und hoch auflösender Oberflächenmodelle von Getreidebeständen auf Basis von Bildern aus UAV-Befliegungen. Photogrammetrie Fernerkundung Geoinformation, 6(6), 551–562. https://doi.org/10.1127/1432-8364/2013/0200
- Breiman, L. (2001). Random Forests. Machine Learning, 45(1), 5–32. https://doi.org/10.1023/A:1010933404324
- Chang, K. W., Shen, Y., & Lo, J. C. (2005). predicting rice yield using canopy reflectance measured at booting stage. Agronomy Journal, 97(3), 872–878. https://doi.org/10.2134/agronj2004.0162
- Chapman, S. C., Merz, T., Chan, A., Jackway, P., Hrabar, S., Dreccer, M. F., Holland, E., Zheng, B., Ling, T., & Jimenez-Berni, J. (2014). Pheno-copter: A low-altitude, autonomous remote-sensing robotic helicopter for high-throughput field-based phenotyping. Agronomy, 4(2), 279–301. https://doi.org/10.3390/agronomy4020279
- Chlingaryan, A., Sukkarieh, S., Whelan, B., (2018). Machine learning approaches for crop yield prediction and nitrogen status estimation in precision agriculture: A review. Computers and Electronics in Agriculture, 151, 61–69. https://doi.org/10.1016/j.compag.2018.05.012
- Chollet, F. (2015). Keras: Deep learning library for Theano and TensorFlow. Retrieved October 31, 2019 from http://github.com/fchollet/keras
- Cox, M. C., Qualset, C. O., & Rains, D. W. (1986). Genetic variation for nitrogen assimilation and translocation in wheat. III. Nitrogen translocation in relation to grain yield and protein 1. Crop Science, 26(4), 737–740. https://doi.org/10.2135/cropsci1986.0011183X002600040022x
- Doraiswamy, P. C., Moulin, S., Cook, P. W., & Stern, A. (2003). Crop yield assessment from remote sensing. Photogrammetric Engineering and Remote Sensing, 69(6), 665–674. https://doi.org/10.14358/PERS.69.6.665
- FAO. 2020. FAOSTAT. FAO. Retrieved June 18, 2020 from http://www.fao.org/faostat/en/#home
- Fuertes-Mendizábal, T., Aizpurua, A., González-Moro, M. B., & Estavillo, J. M. (2010). Improving wheat breadmaking quality by splitting the N fertilizer rate. European Journal of Agronomy, 33(1), 52–61. https://doi.org/10.1016/j.eja.2010.03.001
- Gitelson, A. A., Kaufman, Y. J., & Merzlyak., M. N. (1996). Use of a green channel in remote sensing of global vegetation from EOS-MODIS. Remote Sensing of Environment, 58(3), 289–298. https://doi.org/10.1016/S0034-4257(96)00072-7
- Gitelson, A. A., & Merzlyak., M. N. (1994). Spectral reflectance changes associated with autumn senescence of Aesculus hippocastanum L. and Acer platanoides L. leaves. Spectral features and relation to chlorophyll estimation. Journal of Plant Physiology, 143(3), 286–292. https://doi.org/10.1016/S0176-1617(11)81633-0
- Holman, F. H., Riche, A. B., Michalski, A., Castle, M., Wooster, M. J., & Hawkesford, M. J. (2016). High throughput field phenotyping of wheat plant height and growth rate in field plot trials using UAV based remote sensing. Remote Sensing, 8(12), 1031. https://doi.org/10.3390/rs8121031
- Huete, A., Didan, K., Miura, T., Rodriguez, E. P., Gao, X., & Ferreira, L. G. (2002). Overview of the radiometric and biophysical performance of the MODIS vegetation indices. Remote Sensing of Environment, 83(1–2), 195–213. https://doi.org/10.1016/S0034-4257(02)00096-2
- Jiang, Z., Huete, A. R., Didan, K., & Miura, T. (2008). Development of a two-band enhanced vegetation index without a blue band. Remote Sensing of Environment, 112(10), 3833–3845. https://doi.org/10.1016/j.rse.2008.06.006
- Jordan, C. F. (1969). Derivation of leaf-area index from quality of light on the forest floor. Ecology, 50(4), 663–666. https://doi.org/10.2307/1936256
- Kawamura, K., Asai, H., Yasuda, T., Khanthavong, P., Soisouvanh, P., & Phongchanmixay, S. (in press). Field phenotyping of plant height in an upland rice field in laos using low-cost small unmanned aerial vehicles (UAVs). Plant Production Science. https://doi.org/10.1080/1343943X.2020.1766362
- Kibite, S., & Evans, L. E. (1984). Causes of negative correlations between grain yield and grain protein concentration in common wheat. Euphytica, 33(3), 801–810. https://doi.org/10.1007/BF00021906
- Kyveryga, P. M. (2019). On-farm research: Experimental approaches, analytical frameworks, case studies, and impact. Agronomy Journal, 111(6), 2633–2635. https://doi.org/10.2134/agronj2019.11.0001
- Liu, L., Wang, J., Bao, Y., Huang, W., Ma, Z., & Zhao, C. (2006). Predicting winter wheat condition, grain yield and protein content using multi-temporal EnviSat-ASAR and Landsat TM satellite images. International Journal of Remote Sensing, 27(4), 737–753. https://doi.org/10.1080/01431160500296867
- Marchant, B., Rudolph, S., Roques, S., Kindred, D., Gillingham, V., Welham, S., Coleman, C., & Sylvester-Bradley, R. (2019). Establishing the precision and robustness of farmers’ crop experiments. Field Crops Research, 230, 31–45. https://doi.org/10.1016/j.fcr.2018.10.006
- Minasny, B., & McBratney, A. B. (2013). Jenny, PCA and random forests. Pedometron, 33, 10–13.
- Mulvaney, R. L. (1996). Nitrogen—Inorganic forms. In D. L. Sparks (Ed.), Methods of soil analysis. Part 3. chemical methods. SSSA book series no. 5 (pp. 1123–1184). Soil Science Society of America and American Society of Agronomy.
- Pedregosa, F., Varoquaux, G., Gramfort, A., Michel, V., Thirion, V., Grisel, O., Blondel, M., Prettenhofer, P., Weiss, R., Dubourg, V., Vanderplas, J., Passos, A., Cournapeau, D., Brucher, M., Perrot, M., & Duchesnay, É. (2011). Scikit-learn: Machine learning in python. Journal of Machine Learning Research, 12, 2825–2830. https://jmlr.org/papers/volume12/pedregosa11a/pedregosa11a.pdf
- Rharrabti, Y., Villegas, D., Garcia Del Moral, L., Aparicio, F., Elhani, N., & Royo, C. (2001). Environmental and genetic determination of protein content and grain yield in durum wheat under mediterranean conditions. Plant Breeding, 120(5), 381–388. https://doi.org/10.1046/j.1439-0523.2001.00628.x
- Rouse, J. W., Haas, R. H., Schell, J. A., & Deering, D. W. (1974). Monitoring vegetation systems in the great plains with ERTS. In S. C. Freden & M. A. Becker (Eds.), Third earth resources technology satellite symposium (pp. pp. 309–317). NASA.
- Seabold, S., & Perktold, J. (2010). Statsmodels: Econometric and statistical modeling with python. Proceedings of the 9th Python in Science Conference, 57–61. https://conference.scipy.org/proceedings/scipy2010/pdfs/seabold.pdf
- Serrano, L., Filella, I., & Peñuelas, J. (2000). Remote sensing of biomass and yield of winter wheat under different nitrogen supplies. Crop Science, 40(3), 723–731. https://doi.org/10.2135/cropsci2000.403723x
- Shanahan, J. F., Schepersa, J. S., Francisa, D. D., Varvela, G. E., Wilhelma, W. W., Tringea, J. M., Schlemmer, M. R., & Major, D. (2001). Use of remote-sensing imagery to estimate corn grain yield. Agronomy Journal, 93(3), 583–589. https://doi.org/10.2134/agronj2001.933583x
- Takasu, T. (2007). RTKLIB: An open source program package for GNSS positioning. Retrieved October 27, 2019 from http://www.rtklib.com/rtklib.htm
- Tanaka, T. S. T. (2020). Assessment of research frameworks for on-farm experimentation through a simulation study of wheat yield in Japan. Preprint 12741. http://arxiv.org/abs/2004
- Tanaka, T. S. T., Kono, Y., & Matsui, T. (2019). Assessing the spatial variability of winter wheat yield in large-scale paddy fields of Japan using structural equation modelling. Precision Agriculture, 19, 751–757. https://doi.org/10.3920/978-90-8686-888-9_93
- Teal, R. K., Tubana, B., Girma, K., Freeman, K. W., Arnall, D. B., Walsh, O., & Raun, W. R. (2006). In-season prediction of corn grain yield potential using normalized difference vegetation index. Agronomy Journal, 98(6), 1488–1494. https://doi.org/10.2134/agronj2006.0103
- Tsouros, D. C., Bibi, S., & Sarigiannidis, P. G. (2019). A review on UAV-based applications for precision agriculture. Information, 10(11), 349. https://doi.org/10.3390/info10110349
- Uno, Y., Prasher, S. O., Lacroix, R., Goel, P. K., Karimi, Y., Viau, A., & Patel, R. M. (2005). Artificial neural networks to predict corn yield from Compact Airborne Spectrographic Imager data. Computers and Electronics in Agriculture, 47(2), 149–161. https://doi.org/10.1016/j.compag.2004.11.014
- Vapnik, V. (1995). The nature of statistical learning theory. Springer.
- Wang, L., Tian, Y., Yao, X., Zhu, Y., & Cao, W. (2014). Predicting grain yield and protein content in wheat by fusing multi-sensor and multi-temporal remote-sensing images. Field Crops Research, 164(1), 178–188. https://doi.org/10.1016/j.fcr.2014.05.001
- Wood, C. W., Reeves, D. W., & Himelrick, D. G. (1993). Relationships between chlorophyll meter readings and leaf chlorophyll concentration, N status, and crop yield: A review. Proceedings of Agronomy Society of New Zealand, 23, 1–9.
- Yang, G., Liu, J., Zhao, C., Li, Z., Huang, Y., Yu, H., Xu, B., Yang, X., Zhu, D., Zhang, X., Zhang, R., Feng, H., Zhao, X., Li, Z., Li, H., & Yang, H. (2017). Unmanned aerial vehicle remote sensing for field-based crop phenotyping: Current status and perspectives. Frontiers in Plant Science, 8, 1111. https://doi.org/10.3389/fpls.2017.01111
- Zarco-Tejada, P. J., Diaz-Varela, R., Angileri, V., & Loudjani, P. (2014). Tree height quantification using very high resolution imagery acquired from an unmanned aerial vehicle (UAV) and automatic 3D photo-reconstruction methods. European Journal of Agronomy, 55, 89–99. https://doi.org/10.1016/j.eja.2014.01.004
- Zebarth, B. J., Botha, E. J., & Rees, H. (2007). Rate and time of fertilizer nitrogen application on yield, protein and apparent efficiency of fertilizer nitrogen use of spring wheat. Canadian Journal of Plant Science, 87(4), 709–718. https://doi.org/10.4141/CJPS06001