ABSTRACT
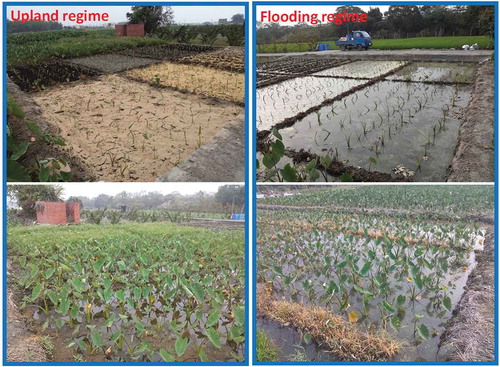
Taro (Colocasia esculenta L. Schott) is an important food staple in developing countries in Africa, West Indies, the Pacific region, and Southeast Asia. Because taro can be grown in almost all tropical regions of the world, it will play a crucial role in food security. The use of organic mulches, which contribute to soil water management, weed control, and fertilization simultaneously, shows promise as an eco-friendly approach in agronomy. In the present study, a field experiment including two cropping seasons (I and II) was conducted to evaluate the effects of water regimes with organic mulching on the taro growth and corm nutritive values. In results, compared with that under the upland regime, taro cultivation under the flooding regime had a higher level of soil fertility and better weed control. The flooding regime promoted more the taro plant growth and further enhanced the yields of the harvested corms; also, sugarcane bagasse and rice husk would be the superior mulch to obtain better corm attributes. By contrast, cultivation under the upland regime enhanced the nutritive values of taro corm more than did that under the flooding regime. Regardless of the upland or flooded regime, mulching treatments with rice husk could enrich taro corm nutrition more than could those with sugarcane bagasse and peanut hull. Also, the effects of water regime and mulching on taro plant growth and corm attributes would be varied with the rainfalls during the period of vegetative growth.
Graphical abstract
1. Introduction
Taro (Colocasia esculenta L. Schott) is one of the oldest crops known to the human being; it was first used in India and Southeast Asia more than 9000 years ago (Ramanatha Rao et al., Citation2010). Currently, taro has become an important food staple in developing countries in Africa, West Indies, the Pacific region, and Southeast Asia (Alcantara et al., Citation2013; Mabhaudhi et al., Citation2013; Misra et al., Citation2008; Miyasaka et al., Citation2001). Over 400 million people worldwide regularly consume corm and leaves (Brown, Citation2000). Taro has become one of the popular edible root vegetables in West Africa, the Pacific Islands, and South America (Suminarti et al., Citation2016). Because taro can be grown in almost all tropical regions of the world, it can play a crucial role in food security (Akwee et al., Citation2015).
All parts of the taro plant (e.g., corm, cormels, stalk, inflorescence, and flowers) can be used for food, medicinal, ornamental, and industrial purposes. Both the tuber and the leaf of taro are usually eaten as fried and cooked vegetables. The tuber of taro usually includes a central corm, several small side cormels, and suckers. The corm is the major economic part of the taro plant, and small cormels or side suckers are commonly kept in nurseries to develop good sprouts for further planting (Tsedalu et al., Citation2014). Taro corm is rich in starch, protein, and dietary fiber (Lewu et al., Citation2010); thus, taro plant cultivation is mainly focused on the yield and quality of its starchy corms. Lebot et al. (Citation2006) showed that the taro corm yield was positively correlated with the vegetative traits (e.g., plant height, leaf width, leaf length, etc.). Further, the corm quality was usually stated as a function of taste, texture in mouth, aroma, shape, and flesh color (Lebot et al., Citation2011).
According to a recent statistical report by the Food and Agriculture Organization (FAO, Citation2018), global taro production approached 10.6 million tons and was harvested from 1.66 million hectares in 2018, resulting in an average yield of ~6.4 ton/hectare. The top ten producers were Nigeria, China, Cameroon, Ghana, Papua New Guinea, Madagascar, Rwanda, Japan, Central African Republic, and Egypt. Nigeria, the largest producer, accounted for 31.1% of global production; however, its yield is still very low (i.e., 4.6 t ha−1) compared with the yields in China and Japan (i.e., 19.6 and 12.5 t ha−1, respectively). The very low yield in Nigeria may be attributed to poor agronomical practices such as insufficient fertilizer application, unsuitable water management, and lack of weed control (Hartemink et al., Citation2000; Son & Rutto, Citation2002; Ganança et al., Citation2015; Iwuagwu et al., Citation2016). Nevertheless, to realize the maximum potential yields of taro immediately, which could contribute to food security and income generation (Suminarti et al., Citation2016; Tsedalu et al., Citation2014), it will be effective to improve plant materials; optimize plant density; apply fertilizer and irrigation reliably; and well control diseases, insects, and weeds. Nowadays, limited information is available on many aspects of the agronomical management of taro; the crop’s level of utilization remains low in much of the world.
The nutrient content and nutritional quality of the taro corm have been adopted as the target indexes for plant cultivation and breeding strategies (Mergedus et al., Citation2015; Suja et al., Citation2017). Many studies have investigated the nutritive quality of taro corms (Banjaw, Citation2017; Champagne et al., Citation2013; Kaushal et al., Citation2015). Compared with other tuber crops, taro corms have higher nutritive and medical value (Kundu et al., Citation2011). Because the starch granules of taro corm are small (0.25–0.5 μm) (Nand et al., Citation2008), they are estimated to have high digestibility of 98% (Deo et al., Citation2009). Because taro corms contain easily digestible starch and highly soluble dietary fibers, they can be easily assimilated by persons with digestive problems. Also, taro corms could be consumed by people who are allergic to cereals (Huang et al., Citation2000) and children who are sensitive to milk (Boampong et al., Citation2018; Opara, Citation2001).
Previous studies on taro cultivation (Mabhaudhi et al., Citation2013; Nedunchezhiyan et al., Citation2013; Suja et al., Citation2017) have reported that the yield and quality of taro plants respond well to fertilization, organic farming, and optimal irrigation. Mulching is an integrated management action to limit soil erosion and water evaporation, suppress weed growth, maintain soil fertility, and improve crop yield and quality (Azad et al., Citation2015; Miyasaka et al., Citation2001; Nachimuthu et al., Citation2017; Ruíz-Machuca et al., Citation2014). Particularly, organic mulching materials including decomposable cover crop mulches aid weed control, water, and soil conservation, and soil fertility improvement (Adekalu et al., Citation2007; Cao et al., Citation2012; Lordan et al., Citation2015). Organic mulches generally reduce the soil temperature and conserve soil moisture by slowing evaporation while allowing rainfall to better penetrate the soil (Kosterna, Citation2014). Busari et al. (Citation2019) also showed that soil water regimes controlled for flooding by irrigation techniques significantly influenced the corm yield components, such as biomass, corm mass, corm number, corm size, and harvest index. Maintaining a suitable water regime during the vegetative growth of the taro plant is thus one of the most important practices in taro corm production. Also, organic mulch is left in the field after harvest; then, as it breaks down, it helps to improve soil fertility and add soil organic matter (McIntyre et al., Citation2000).
To the best of our knowledge, few studies have focused on assessing the effectiveness of mulching practice to integrate soil fertility, weed control, and water management for taro cultivation on farms (Manu et al., Citation2018; Miyasaka et al., Citation2001; Suja et al., Citation2017). Further, no study has focused on the effects of different organic mulches on taro plant responses under different water regimes. The present study thus conducted a taro field experiment including two cropping seasons to investigate the efficiency of the use of organic mulches on soil fertility, weed control, plant growth, and corm yield and nutritive quality. Soil water regimes for taro planting (i.e., upland and flooding) were adopted and combined with different mulching materials (i.e., sugarcane bagasse, peanut hull, and rice husk) in the field experiment for illustration.
2. Materials and methods
2.1 Plant material preparation and experimental design
A field experiment was conducted in farmland at Yunlin county, western Taiwan (23° 46ʹ N, 120° 36ʹ E). The experimental site had an area of ~0.2 ha, which was separated into two equal-size subareas for the winter cropping from 24 December 2013, to 30 September 2014 (Season I), and the spring cropping from 14 March to 31 December 2014 (Season II). The partial growth period from 14 March to 30 September 2014, that was more than 6 months, overlapped for the Seasons I and II. This study used a taro landrace, Binlung-Xin-Yu, sourced from a taro farm in Yunlin county, where the farmers rely on landraces for planting materials. Binlung-Xin-Yu, which is known as the dasheen type of taro (C. esculenta L. Schott var. esculenta) and thus characterized by a large central corm and very few cormels (Devi, Citation2012), was identified as the most actively cultivated taro variety in Taiwan (Tsai et al., Citation2016). Onwueme (Citation1999) reported that most of the taro grown in the Asia/Pacific region is of the dasheen type. Compared with the eddoes type of taro (var. antiquorum), the dasheen type does better when grown in flooded or reducing soil conditions. Thus, the Binlung-Xin-Yu is generally cultivated by farmers in the paddy field.
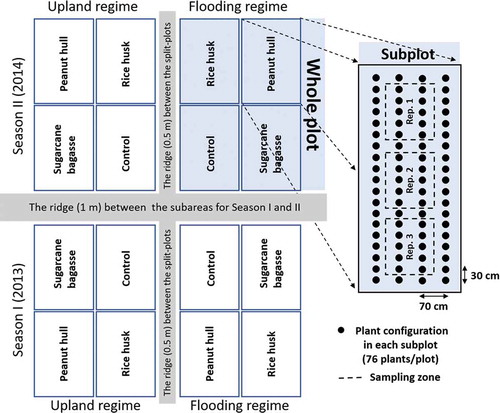
The experimental design was given the split-plot design with a factorial treatment structure including two levels of experimental units as shown in . The treatment of water regimes (i.e. upland and flooding) was assigned to the first level and applied to the whole plot. The whole plot was split into four subplots; and the treatment of mulches (i.e. sugarcane bagasse, peanut hull, rice husk, and control) was assigned to the second level and applied to the subplot. The four subplots for mulching treatments were randomly configured in the whole plot. Upland cultivation of taro was conducted while keeping a field capacity of soil water moisture (Mabhaudhi et al., Citation2013). For flooding cultivation of taro, the water level was kept at 5 cm from the soil surface (O’Hair et al., Citation1982). The treatment amounts of sugarcane bagasse, peanut hull, and rice husk were 20, 36, and 45 kg/plot, respectively. Each treatment was applied after transplanting on the soil surface in each subplot to form a ~ 3-cm-thick layer (Kasirajan & Ngouajio, Citation2012; Ramírez-López et al., Citation2003). The control did not use mulching material on the soil surface in the subplot. The subplot size for each treatment had an area of 3.5 m × 6 m. A total of 76 taro seedlings were planted in each subplot; the column-to-column distance was 70 cm, and the plant-to-plant distance in each row was 30 cm (). The taro seedlings were prepared by using side camels obtained from the previous harvest and kept in nurseries to develop sprouts. Around 3–4 weeks after the nursing, uniformly sized seedlings, which consist of a central corm with an average weight of ~30 g and a petiole with a length of ~22 cm, were selected out to plant in the subplots. Then, the mulching treatments with sugarcane bagasse, peanut hull, and rice husk and the control were conducted according to the layout of the experimental design (). Sugarcane bagasse, peanut hull, and rice husk are the common agricultural byproducts in Taiwan. According to the recommendations by Huang and Lee (Citation1997) and Ramírez-López et al. (Citation2003), the application rates of sugarcane bagasse, peanut hull, and rice husk were 20 kg, 36 kg, and 45 kg per subplot, respectively, to spread out a thin layer of mulch about 2–3 cm. The materials of sugarcane bagasse, peanut hull, and rice husk were soaked in water for three days in advance to be stamped on the soil surface, and then completely covered each subplot. During the growth periods, the irrigation frequencies were set as two times per week for upland cultivation and four times per week for flooding cultivation. The application rates of nitrogen, phosphorus, and potassium fertilizers were set as150 N-kg ha−1, 40 P-kg ha−1, and 90 K-kg ha−1, respectively.
Figure 1. Layout of the experimental plots showing the split-plot design with the two treatment factors, water regime (i.e. upland and flooding) and mulching (i.e. control, sugarcane bagasse, peanut hull, and rice husk), assigned in the whole plot and subplot, respectively, for taro cultivation in the two cropping seasons. Season I was the winter cropping from 24 December 2013 to 30 September 2014 and Season II was the spring cropping from 14 March to 31 December 2014. Three sampling zones in a subplot are delineating with the dash lines, in which was one plant randomly selected as the replicates (i.e. Reps. 1, 2, and 3)
The growth periods for Seasons I and II were from 24 December 2013, to 30 September 2014, and from 14 March to 31 December 2014, respectively. The taro plants were cultivated for about 9 months and then harvested. The taro plant growth and corm yield and quality would be given by the seasonal dynamics of regional whether. During the growth periods, the data set of the weather factors (i.e. air temperature, relative humidity, daylight hour, and rainfall) were recorded at the Yulin and Chiayi weather stations, which are responsible to report the regional whether around both Yulin and Chiayi counties for the agricultural consultation and research by Tainan District Agricultural Research and Extension Station (TND_ARES), Taiwan. The weather observations recorded by the Yunlin and Chiayi stations are presentative enough for monitoring the seasonal dynamic of weather factors on the experimental site. The recorded data of air temperature and rainfall were obtained from the Yunlin station (23° 38.19ʹ N, 120° 28.60ʹ E), where is ~19 km southwest of the experimental site. The Yunlin station is located at the Yuinlin branch, TND_ARES. The branch service covers Yunlin and Chiayi Counties. Additionally, the records of the relative humidity and daylight hour were from the Chiayi station (23° 29.75ʹ N, 120° 25.97ʹ E), which is located ~32 km southwest of the experimental site. The patterns in detail of the weather records per month among the growth periods were shown in . In Season I, the averages of the mean monthly temperature, mean monthly relative humidity, and monthly daylight hours were 23.6°C, 77.9%, and 174.1 h, respectively; the accumulation of monthly rainfalls was 1152.1 mm. And in Season II, they were 25.0°C, 77.5%, 176.9 h, and 1109.8 mm, respectively.
Figure 2. Profiles of the monthly temperature (Mon. temp.), relative humidity (RH), daylight hour, and rainfall from Dec. 2013 to Dec. 2014
2.2 Measurements of plant and soil samples
2.2.1 Plant growth, corm yield, and weed density
As shown in , three sampling zones were delineating with the dash lines in each subplot. We randomly selected one plant from each sampling zone to obtain three replicates for the measurements of taro growth characters. The taro growth characters such as plant height and leaf production (i.e., leaf blade length and width) were measured at 240 days after transplanting (DAT). There are three growth stages in taro (Sivan, Citation1984); after the vegetative growth stage approaching to the peak (i.e. about 150 DAT), there is a rapid decline in shoot growth, such as a decrease in the total leaf area per plant and the mean plant height (Onwueme, Citation1999). To obtain presentative data of the growth factors concerning the corm production, plant height was measured from the soil surface up to the blade tip of the second youngest and fully unfolded leaf (Sibiya, Citation2015). Also, the blade length and width of the second youngest and fully unfolded leaf were measured as the leaf growth indices for each replicate plant sample. At harvest, that is, at ~270 DAT, ten plants in each sampling zone () were drawn to record their main corm shape, size, and fresh weight, then the average values and the yield for each zone were calculated as one replicate. There were three replicates for the measurement of the taro corm attributes. In addition, weed species compositions in the experimental site were assessed by throwing a quadrat (50 cm × 50 cm) randomly located at each sampling zone. Weed plants were counted and recorded at 60, 120, 180, and 240 DAT of taro seedlings. Weed abundance was determined by counting and recording the weed species within the quadrat. In the three sampling zones, one obtained three replicates of weed abundance measuring for each subplot. Weed species have been identified in our previous study (Lin & Hou, Citation2017). Weed species within each quadrat were pooled together for calculating the weed density. The average weed densities from three replicates for each subplot were then expressed in plant m−2.
2.2.2 Proximate analysis of taro corm
In a complete proximate evaluation, moisture, starch, crude protein, crude lipid, crude fiber, soluble sugar, ash, and energy value are analyzed. Proximate analysis was conducted for each corm sample. Fresh corms were thoroughly washed and peeled, and they were subsequently dried in a forced-air oven at ~65°C for 72 h for constant weighing (Benesi et al., Citation2004; Osorio et al., Citation2003). Their moistures were presented as a ratio of the difference between the fresh and dry weights to the fresh weight. The dried samples were then ground (passed through a 1-mm sieve) for analyzing the starch, crude protein, crude lipid, crude fiber, soluble sugar, and ash (Ilodibia et al., Citation2014).
Crude protein was determined using the Kjeldahl method according to the modified AOAC method 991.20 (Thiex et al., Citation2002). Around 5 g of ground solid of a dried sample was weighed in the Kjeldahl digestion flask, and the catalyst mixture (K2SO4 mixed with CuSO4 · 5H2O in 1:10 ratio) was added to each flask. Then, 15 ml of concentrated H2SO4 (98%) was added and the sample was digested at 420°C for at least 4 h until the solution was clear. Next, 150 ml of 40% NaOH was added into each digestion flask to distill out the ammonia from the digestion tube, and 50 ml of 2% boric acid solution was used to collect the ammonia distillate. The ammonia distillate in the boric acid solution was titrated against standardized 0.1 N H2SO4 to determine the nitrogen content in the digestion tube. The nitrogen content in the sample was multiplied with the traditional conversion factor of 6.25 to obtain the protein content.
Crude fat was measured by using AOAC method 920.39 with the traditional Soxhlet extraction with diethyl ether (Thiex et al., Citation2003). The modified procedures used to determine the crude fat contents of the samples were as follows. First, ~3 g of ground solid of the dried sample was exactly weighed and placed in a pre-weighed thimble lined with a circle of filter paper inside. The thimble and sample were then transferred into a Soxhlet extraction apparatus and extracted with diethyl ether solvent at ~50°C for 16 h. After extraction, the sample in the thimble was defatted. Then, the thimble and sample were dried in an oven for 2 h at 50°C. After cooling down to room temperature, they were weighted to calculate the lost weight during the defatting extraction; this represents the crude fat content.
The crude fiber was estimated by determining the amylase-treated neutral detergent fiber (aNDF). The measurement procedure was modified according to AOAC method 962.09 (Hiraoka et al., Citation2012; Mertens, Citation2002). First, ~1 g of ground solid of the dried sample was weighed and placed in a 250 mL beaker. Next, 50 mL of neutral detergent solution and 100 μL of alpha-amylase was added in the beaker. The beaker contents were stirred to ensure that all sample particles were suspended, heated continuously by a conventional heating apparatus, and refluxed at 95°C for 15 min. After refluxing, the sample particles were washed by using hot distilled water, completely filtered, and then returned to a beaker. Then, 10 mL of 0.275 N sodium hydroxide solution was added in the beaker for refluxing again at 95°C for 15 min. Next, the sample particles were washed again by using hot distilled water and filtrated to drain dry. The filtrated sample particles were further oven-dried for 2 h at 130°C to obtain the dry weight (M1). Finally, they were ignited at 550°C in a Muffle furnace for at least 6 h to obtain the constant ash weight (M2). The crude fiber percentage can be calculated as (M1-M2)∙100%.
The ash content of each sample was determined according to the modified AOAC method 941.12 (Sójka et al., Citation2013). First, ~1 g of ground solid of the dried samples were accurately weighed and ignited at 550°C in a Muffle furnace for at least 6 h and usually up to 17 h to obtain a constant ash weight. The ash content of each sample could be weighed using an analytical balance.
The total carbohydrate content was usually determined by the difference from other composites including moisture, crude protein, crude lipid, crude fiber, and ash contents (Alcantara et al., Citation2013). However, the total carbohydrates could be divided into two parts: starch and sugar (Khan et al., Citation2014; Kiran Kumar & Sandeep, Citation2016). In this study, the starch content of the corm was determined by using the modified AOAC method 996.11 (McCleary et al., Citation2019), and then, the sugar content was obtained by subtracting the starch content from the total carbohydrate content. The starch content was measured by the following procedure. First, ~0.1 g of ground solid of the dried sample was accurately weighed and placed in a glass tube for incubation with thermostable α-amylase in a sodium acetate buffer containing calcium chloride at 80–85°C for 15 min, with periodic mixing to gelatinize and hydrolyze the starch to maltodextrins. After cooling to 50°C, amyloglucosidase was added to complete the further hydrolysis of maltodextrins to glucose within 30 min. Next, one can use a glucose oxidase/peroxidase (GOPOD) reagent to determine glucose in the mixture. In other words, duplicate 0.1 mL aliquots of the mixture were transferred to glass test tubes and 3.0 mL of GOPOD reagent was added to each test tube. After incubation at 50°C for 20 min, the absorbance at 510 nm was measured for each tube solution. Simultaneously, a standard solution of glucose (0.1 mL, 1.0 mg/mL) and a blank (0.1 mL, 100 mM acetate buffer/pH 5.0) were incubated with 3.0 mL of GOPOD reagent in quadruplicate, respectively. Based on the assumption of a glucose/GOPOD standard curve being linear and passing through the origin, the glucose value for each sample can be calculated from the absorbances at 510 nm for both the standard solution of glucose and the blank. Eventually, the amounts of glucose obtained by the decomposition of starch by α-amylase and amyloglucosidase could be used to estimate the starch content.
The energy values for the taro corm samples were calculated with values of 4 kcal g−1 for carbohydrates and proteins and 9 kcal g−1 for lipids (Livesey, Citation1995). The energy value expressed in kcal/100 g fresh weight for each corm sample was obtained by summing 9 × crude lipids (g/100 g fresh weight), 4 × crude protein (g/100 g fresh weight), and 4 × total carbohydrates (g/100 g fresh weight) (Melese et al., Citation2015).
2.2.3 Properties of soil and mulching materials
The selected soil properties for the experimental site were measured for assessing the soil fertility and fertilizer recommendation. Before the field experiment, a soil sample was drawn from the site, air-dried, and passed through a 2-mm sieve for analyzing the soil properties. Sand, silt, and clay contents were determined using the hydrometer method (Gee & Bauder, Citation1986). The soil pH was measured by using soil to water ratio of 1:1 (w/v) (McLean, Citation1982). Soil organic matter was determined using the Walkley–Black method (Nelson & Sommers, Citation1996). Total nitrogen (N) in the soil was determined using the Kjeldahl method (Bremner & Mulvaney, Citation1982). The cation exchange capacity (CEC) and exchangeable potassium (K), calcium (Ca), and magnesium (Mg) were determined using ammonium acetate extraction (pH 7.0) (Thomas, Citation1982). Available phosphorous (P) in the soil was determined using Bray-1 extraction (Bray & Kurtz, Citation1945). The chemical compositions of the mulching materials (i.e., sugarcane bagasse, peanut hull, and rice husk) were determined for assessing the effects of the decomposition of mulching materials on the distributions of major nutrients (e.g., N, P, K, Ca, and Mg) in the soil. Each mulching material was milled and passed through a sieve (20 mesh); then, the powder sample was digested with concentrated sulfuric acid (98%) for determining the major nutrients.
According to the experimental design, additional soil samples were drawn from each subplot, while the taro corms were harvested at ~270 DAT. There were three replicates of soil obtained from the three sampling zones of each subplot. The properties (i.e., pH; organic matter; total N; Bray-1 extractable P; and exchangeable K, Ca, and Mg) of the soil samples were analyzed for assessing the effects of the water regimes and mulching materials on soil fertility.
2.3 Statistical analyses
According to the split-plot design, data analyses for all observations of taro plant growth, corm yield and chemical composition, soil fertility, and weed density were conducted by using the GLM process of the SAS program. Analysis of variance (ANOVA) was performed to test the cross-effects of water management (i.e., upland and flooding regimes) and mulching materials (i.e., sugarcane bagasse, peanut hull, rice husk, and control) on the soil property, weed density, taro plant growth, and corm yield and nutrition. Also, there was a nested structure in ANOVA. Thus, least squares means (i.e. lsmeans) and standard errors were obtained by using the GLM procedure and the t-test was carried out to examine the differences between two treatment combinations’ lsmeans at a significant level of 0.05.
3. Results and discussion
3.1 Soil properties and compositions of mulching materials
shows the averages of selected soil properties of the site and the chemical compositions of the mulching materials adopted for the field experiment. According to the sand and clay contents of the soil (i.e., 23% and 26%, respectively), its texture could be classified as silty loam. The soil pH, CEC, and organic matter (OM) are 5.33, 11.49 cmol kg−1, and 2.39%, respectively. The values indicate that the soil is moderately acidic and has an organic matter level slightly lower than the average of organic matters (i.e., ~2.64%) for the surface 30 cm of Taiwanese agricultural soils (Tsui et al., Citation2013). The soil could be classified into a group with an intermediate CEC value of ~15 cmol (+) kg−1 for paddy fields in Taiwan (Römkens et al., Citation2009). In general, the finer the texture, the more is the high-value OM content, and the higher the pH of a soil, the higher is the CEC of the soil. Fooladmand (Citation2008) suggested that the percentages of clay, sand, and OM content could be used to estimate the soil CEC reliably. lists the total N (TN); Bray 1-P (B1P); and exchangeable K, Ca, and Mg of the soil. The TN value was 1.43 g kg−1 at a normal level for most cropped lands in Taiwan. According to the suggestion by Owen et al. (Citation2010), the pool of soil TN to a depth of 30 cm was ~1.73 g kg−1 for forests in northeastern Taiwan. Mukhtar and Lin (Citation2019) reported that the soil TN of the cropped lands for regions with different climate (including Chiayi, Taoyuan, Miaoli, and Pingtung) in Taiwan ranged from 1.47 to 2.21 g kg−1. The B1P (50.57 mg kg−1) and exchangeable K (113.7 mg kg−1), Ca (698.3 mg kg−1), and Mg (136.0 mg kg−1) of the soil approached the recommended levels (i.e., 10 < P < 80, 30 < K < 100, 350 < Ca < 650, and 50 < Mg < 100 mg kg−1) for crops including rice, wheat, corn, sweet potato, sugarcane, and peanut (Yang, Citation1991).
Table 1. Selected physicochemical properties of the soil (i.e. caly, sand, pH, cation exchangeable capacity (CEC), organic matter (OM), total nitrogen (TN), Bray 1-phosphorous (B1P), and exchangeable potassium (Ex. K), calcium (Ex. Ca) and magnesium (Ex. Mg)) and the compositions of the mulching materials (i.e. ash, OM, N, P, K, Ca, Mg, and ratio of carbon to nitrogen (C/N))
also shows the chemical compositions of the mulching materials. The ash content of sugarcane bagasse was superior to those of peanut hull and rice husk; conversely, the OM content of peanut hull and rice husk was higher than that of sugarcane bagasse. For the three mulches, the ash content was positively related to the P, Ca, and Mg concentrations. The ash composition of sugarcane bagasse was higher than those of peanut hull and rice husk. Thus, the use of sugarcane bagasse for mulching would enrich the amounts of P, Ca, and Mg in farm soils more than would the use of peanut hull and rice husk. Also, the K concentration in rice husk was higher than those in sugarcane bagasse and peanut hull. Thus, using rice husk would be beneficial for increasing the amount of K in farm soils. However, the ratio of C to N (C/N) for rice husk (86.18) was much higher than those for sugarcane bagasse and peanut hull (29.03 and 34.78, respectively); this would potentially result in soil nitrogen immobilization, owing to the application of high-value C/N materials in farmlands (Chen et al., Citation2014).
3.2 Influences of water regimes combined with different mulches for taro cultivation on soil properties and weed density
shows the soil properties including pH; OM; TN; B1P; and exchangeable K, Ca, and Mg during taro cultivation with different mulches and under upland and flooding regimes. For Season I, compared with the control, mulching treatment with sugarcane bagasse, peanut hull, and rice husk resulted in significant changes in the soil properties. Under the upland regime, rice husk mulching significantly increased soil pH, OM, TN, B1P, and exchangeable K, Ca and Mg; peanut hull mulching significantly increased soil OM, TN, B1P, and exchangeable K, Ca and Mg; and sugarcane bagasse mulching significantly increased soil pH, TN, and exchangeable K, Ca and Mg. Nzeyimana et al. (Citation2020) recently reported that applying different combinations of organic mulch in coffee farming systems significantly increased soil organic matter, N, P, K, Ca, and Mg. Under the flooding regime, rice husk and peanut hull mulching significantly increased all soil properties; and sugarcane bagasse mulching significantly increased soil pH, OM, TN, B1P, and exchangeable Ca and Mg. Regardless of the upland or flooding regime, mulching with any one of the materials could increase soil TN and improve Ca and Mg availabilities. And using rice husk and peanut hull as mulch could enhance more the accumulation of organic matter and the available P into the soil. Awopegba et al. (Citation2017) suggested that the herbaceous mulches increased soil organic carbon, TN, and exchangeable cations more significantly. Eventually, the enhancement of soil fertility by the application of organic mulches along with crop residue retention in farms can improve soil functions and enhance nutrient use efficiency by recycling them through soils (Murphy et al., Citation2016; Mwango et al., Citation2016). For Season II, the mulches under the upland regime for taro cultivation could increase all of the soil properties. And under the flooding regime, the mulches could simultaneously increase soil organic matter, TN, and exchangeable K and Mg. Alterations of the soil properties by the mulches were not the same among the two seasons. The enhancement of soil fertilities (e.g., OM, TN, and Ex. K, Ca, and Mg) by the mulches was more pronounced in Season I. Nevertheless, nutrient release from organic mulching materials to improve soil fertility should be regulated by the amounts of mulch applied, crop managements, agroecological conditions, and environmental properties at each site (Azam et al., Citation1993; Ngoran et al., Citation1998).
Table 2. Least squares means of the soil properties (i.e. pH, organic matter (OM), total nitrogen (TN), Bray 1-phosphorous (B1P), and exchangeable potassium (Ex. K), calcium (Ex. Ca) and magnesium (Ex. Mg)) for the taro cultivation with different mulching materials under the upland (UPL) and flooding (FLO) regimes in cropping seasons I and II during 2013-2014
shows the weed densities at 60, 120, 180, and 240 DAT for taro cultivation with different mulches. There were similar results observed in Season I and II. Under the upland regime, the weed densities for the control were higher than 50 plant m−2 at 120 and 180 DAT; however, with mulching treatments, the weed densities decreased to less than 50 plant m−2. Compared with the control, mulching could reduce the weed density significantly at 120, and 180 DAT; however, the weed density did not show any significant differences with different mulching materials. In other words, the effect of mulching on weed control under the upland regime was significant but did not vary with different mulching materials. Then approaching the later period (i.e. at 240 DAT), there was not any significant difference in weed density for the mulching treatments in Season I, and only rice husk mulching resulted in a significant reduction in weed density in Season II. Overall, rice husk mulching showed more effective suppression of weed growth than the others mulching in Season I and II. The rice husk was wetted and stuck with soil surface then mixed up more in topsoil to enhance the decomposition of the rice husk. In , rice husk mulching resulted in the relatively high soil OM contents, especially in Season II. We inferred that the faster decomposition course of rice husk would be related to the more effective suppression of weed growth. De la Peña and Melchor (Citation1993) emphasized the effects of mulching treatments on weed control and moisture conservation to improve the yields of taro corm. Alternatively, under the flooding regime, the weed densities were almost all less than 10 plant m−2 at 60, 120, and 180 DAT, regardless of Seasons I and II. Compared with those under the upland regime, the weed densities under flooding were much low. That is, the weed densities were dramatically depressed by flooding. The findings are consistent with the effectiveness of the flooding regime on suppressing weeds in the previous study by Ismail et al. (Citation2012). They suggested that flooding will help the design of management options and will allow rice genotypes to adequately establish in flooded soils while simultaneously suppressing weeds. Also, under the flooding regime in Season II, there were significant reductions in the weed densities at 120 and 240 DAT due to the mulching treatments. This suggested that under flooding, the mulches still could be effective for weed control in a taro farm.
Table 3. Least squares means of the weed density during 60, 120, 180, and 240 days after transplanting (DAT) for the taro cultivation with different mulching materials under the upland (UPL) and flooding (FLO) regimes in cropping seasons I and II during 2013-2014
3.3 Growth of taro plants under water regimes combined with different mulches
shows the growth factors of taro plants under upland and flooding regimes, respectively. In Season I, under the upland and flooding regimes, taro plant heights were 137.2–153.4 cm and 170.1–176.6 cm, respectively; taro leaf lengths were 44.2–49.6 cm and 46.9–49.4 cm, respectively; and taro leaf widths were 35.4–40.6 cm and 37.1–40.3 cm, respectively. The significant differences in taro plant heights between under upland and flooding indicated that the flooding regime could enhance the growth of the taro plant. As shown in , under the flooding regime, the soil pH; organic matter; total N; Bray 1-P; and exchangeable K, Ca, and Mg were almost all higher than those under the upland regime. Thus, in Season I, the flooding regime maintained a higher level of soil fertility and thereby promoted taro growth. Fageria et al. (Citation2011) emphasized that the availabilities of P, K, Si, Fe, Mn, and Mo in soils would be increased with flooding for rice plant growth. Sahrawat (Citation2005) and Sun et al. (Citation2012) suggested that the flooding to change the soil’s chemical properties would stimulate the release of macro- and micronutrient from mulches to improve soil fertility and thereby better promote taro growth. On the other hand, the use of the flooding regime could promote the taro plant growth due to more efficiently depressing weeds. In Season II, under the upland and flooding regimes, plant heights were 132.7–137.5 cm and 134.1–139.6 cm, respectively; leaf blade lengths were 35.7–40.4 cm and 37.8–39.0 cm, respectively; and leaf blade widths were 30.0–31.5 cm and 30.4–30.9 cm, respectively. However, there was little difference in the taro growth factors between under upland and flooding. The growths of the above-ground part were not the same among the two seasons. According to the statements by Sivan (Citation1984), the growth rate of the above-ground part of the taro plant would be approaching the plateau for five months after planting. This is the period of vegetative growth with an increase in plant height, the number of leaves and leaf area, and slow corm growth (Silva et al., Citation2008; Tumuhimbise et al., Citation2009). Thus, the phenotyping of the above-ground part for Season I was given the partial growth period by Jun. 2014; that for Season II was given the period by Sep. 2014. According to , the profile of rainfall from Jan. to May 2014 showed that in Season I, the period for the vegetative growth of taro plants was dry; however, the period from Apr. to Aug. 2014 for the vegetative growth in Season II had relatively high rainfalls. This would be a reason why there was much difference in the taro plant high and leaf blade growth between under upland and flooding in Season I, but there was not in Season II.
Table 4. Least squares means of the growth factors (i.e. plant height, leaf length, and leaf width) at 240 days after transplanting, for the taro cultivation with different mulching materials under the upland (UPL) and flooding (FLO) regimes in cropping seasons I and II during 2013-2014
In addition, mulching treatments would have a significant influence on taro plant growth. In Season I, under the upland and flooding regimes, peanut hull and rice husk as mulch significantly increased the plant height and leaf length and width, compared with the control; the sugarcane bagasse mulching only enhanced the growths of leaf length and width. In Season II, the mulching treatments rarely had a significant influence on the growth of the above-ground part regardless of the upland and flooding regimes. The mulching effects on the growth in Season II were different from those in Seasons I. Recall ; the soil OM, TN, and Ex. K, Ca, and Mg were more enriched by the mulches in Season I, and then the growth of the above-ground part was enhanced significantly. However, in Season II, the relatively high rainfalls during the vegetative growth period might reduce the mulching effect on the prevention of soil nutrients and there were rare effects on improvement of the taro growth.
3.4 Attributes of taro corms affected by water regimes combined with different mulches
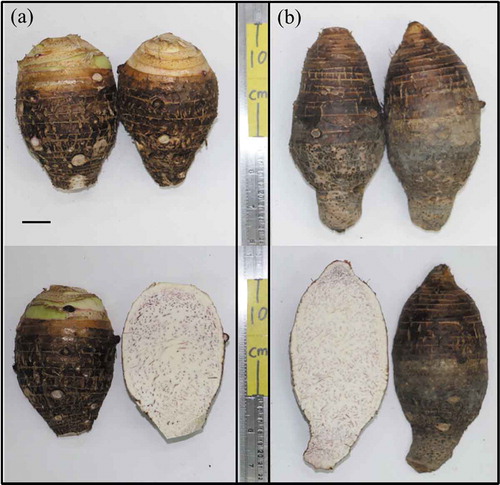
show the morphological characters of the taro corms grown under the upland and flooding regimes, respectively, in Season I. The photographs of the corm sample showed that corms grown under the flooding regime were more elongated and seemed larger than those grown under the upland regime. Lebot (Citation2009) stated that upland taro corms are round and slightly elongated, whereas paddy taro corms are significantly more elongated. Drier conditions such as those in the upland regime tend to result in dumbbell-shaped corms (Tong, Citation2016). The taro corm is an enlarged underground stem that stores starch and nutrients; the corm size, shape, and color depending on the interactions between genotypic and environmental factors. Most taro varieties grown in Taiwan are of the dasheen type, which is characterized by a large edible central corm and very few side cormels (Devi, Citation2012). Tong (Citation2016) reported that several varieties of taro are of dasheen type and were selected to be grown in the Kinta Valley of Malaysia after the 1950s; white- and pink-fleshed cultivars have been recognized. The pink-fleshed variety has a strong taro flavor and is considered to taste better. In , more darkly purplish dots and strips on the vertical section profile were observed on the taro corm grown under the upland regime. Peeled raw taro corms, although obtained from the upland regime, would have a more purplish color and stronger flavor.
Figure 3. Photographs of the corms for the taro plants under (a) upland and (b) flooded cultivations, showing the morphological characters (i.e. shape, size and internal color of raw corm). Scale bar = 2 cm
shows the taro corm attributes and corm yields obtained from cultivations under the upland and flooding regimes in Seasons I and II. In Season I, under the upland regime, there were significant differences in each corm attribute owing to the use of different mulches. Compared with the control, mulching with the three materials simultaneously increased all corm attributes. Alternatively, under the flooding regime, the use of the mulching materials could significantly increase the corm’s fresh weight and yield. Moreover, with any mulching treatment, the corm length, fresh weight, and yield under the flooding regime were significantly higher than those under the upland regime. Also, rice husk was the superior mulch to obtain better corm attributes under the upland and flooding regimes. In Season II, under the upland regime, using sugarcane bagasse as mulch resulted in a significant increase in each corm attribute. The use of rice husk mulching also significantly enhanced the fresh weight and yield of the corm. And the similar results were found for the corms grown under the flooding regime. Regardless of the upland and flooding regimes, the mulching with sugarcane bagasse and rice husk may promote the corm growth to obtain larger corm size and higher fresh weight and yield.
Table 5. Least squares means of the taro corm attributes (i.e. length, major axis, fresh weight, and yield) for the cultivation with different mulching materials under the upland (UPL) and flooding (FLO) regimes in cropping seasons I and II during 2013-2014
Nevertheless, the effects of water regime on the corm attributes were not the same among the two seasons. In Season I, compared with the upland regime, the flooding regime resulted in higher corm length and enhanced the yields of the harvested corms. The results were consistent with the differences in the morphological characteristics of the corm () and the growth of plant height () between the upland and the flooding regimes. However, in Season II, there was less difference in the corm attributes as well as in the plant height () between the upland and flooding regimes. The different parts of results for the corm attributes between Season I and II were obviously related to the growth of plant height. Thus, the relatively high rainfalls in the period (Apr. – Aug. 2014) of the vegetative growth for Season II () reduced the treatment effect of water regimes not only on the growth factors but also on the corm attributes.
3.5 Nutrition of taro corms affected by water regimes combined with different mulches
shows the proximate compositions of taro corms grown under the upland and flooding regimes with different mulches. In Season I, the corm showed moisture of 62.7–68.9 g, starch of 22.5–27.5 g, crude protein of 1.00–1.18 g, and crude lipid of 0.28–0.42 g per 100 g fresh weight (fw). In Season II, the corm showed moisture of 61.4–69.2 g, starch of 22.8–28.7 g, crude protein of 0.97–1.22 g, and crude lipid of 0.15–0.20 g per 100 g fresh weight (fw). These results were similar to those reported by Wills et al. (Citation1983), who found the nutrient composition of corm for taro cultivars from Papua New Guinea, and by A.S. Huang et al. (Citation2000), who compared the nutrient compositions of different varieties of taro corm that are commonly consumed in Hawaii. The crude protein and lipid contents were lower than those (i.e., 6.62 and 0.67% fw, respectively) of the Boloso taro corm grown in Ethiopia, as reported by Azene and Molla (Citation2017). The soluble sugar contents of 6.9%–11.5% and 6.7%-11.5% in Seasons I and II, respectively were much higher than those reported by C.-C. Huang et al. (Citation2007). The crude fiber contents were 0.59%–0.72% in Season I and 0.60%-0.75% in Season II. According to the FAO report by Onwueme (Citation1999), the crude fiber in the taro corm was 0.60%–1.18% fw. The similar fiber content of taro corm was reported previously by Lewu et al. (Citation2010) and Suja et al. (Citation2017). The ash contents ranged 0.17%–0.62% fw and 0.15%-1.2% in Seasons I and II, respectively. The values of ash content were approaching the value of ~1% reported by some studies (A.S. Huang et al., Citation2000; Lewu et al., Citation2010; Suja et al., Citation2017). The differences observed in the ash contents of taro corm in different studies may be due to climatic effect, soil type, water regime, and plant variety (Azene & Molla, Citation2017). Further, the caloric values of taro corm were calculated from the crude protein, crude lipid, and carbohydrate (i.e., starch and soluble sugar) contents, as described by Melese et al. (Citation2015). They ranged from 121 to 164 kcal per 100 g fw in Season I and from 123 to 167 kcal per 100 g fw in Season II and were near the value of 126.5 ± 3.5 kcal reported by Lewu et al. (Citation2010).
Table 6. Least squares means of the proximate compositions (i.e. moisture (Moist.), starch (Star.), crude protein (CP), crude lipid (CL), crude fiber (CF), soluble sugar (SS), ash, and energy value (EV)) of taro corm from the cultivation with different mulching materials under the upland (UPL) and flooding (FLO) regimes in cropping seasons I and II during 2013-2014
In Season I, for the taro corm grown under the upland regime, the crude lipid content increased with the use of peanut hull and rice husk; the crude fiber content, with the use of only rice husk; and the ash content, with the use of sugarcane bagasse and peanut hull. Under the flooding regime, the use of only rice husk mulching could significantly enhance the moisture of taro corm. However, the starch, crude protein, crude fiber, and soluble sugar contents were significantly reduced by using the three mulches. In Season II, for the taro corm grown under the upland regime, the moisture increased by using peanut hull as mulch; the starch, crude protein, crude fiber, and soluble sugar contents increased with the use of rice husk. Under the flooding regime, the use of only sugarcane bagasse mulching could significantly increase the starch content of taro corm. Overall, taro cultivation in the upland regime promotes the nutritive values of corms more than does that in the flooding regime. C.-C. Huang et al. (Citation2007) also showed that taro corm cultivated under the upland regime had higher crude protein, mineral, and soluble sugar contents than those cultivated under the paddy regime; however, the starch and crude lipid contents and caloric values of taro corms were higher under the paddy regime. In summary, regardless of the upland or flooded regime, the use of rice husk as mulch improved the nutritive value of taro corm more than did the use of sugarcane bagasse and peanut hull.
Author contributions
C.-J. Hou and K.-W. Juang designed the research. M.-C. Lin, K.-W. Juang, and C.-J. Hou participated in the measurements and data analysis. K.-W. Juang and C.-J. Hou wrote the manuscript. All authors read and approved the final manuscript.
Disclosure statement
No potential conflict of interest was reported by the authors.
Additional information
Funding
References
- Adekalu, K. O., Olorunfemi, I. A., & Osunbitana, J. A. (2007). Grass mulching effect on infiltration, surface runoff and soil loss of three agricultural soils in Nigeria. Bioresource Technology, 98(4), 912–917. https://doi.org/10.1016/j.biortech.2006.02.044
- Akwee, P. E., Netondo, G., Kataka, J. A., & Palapala, V. A. (2015). A critical review of the role of taro Colocasia esculenta L. (Schott) to food security: A comparative analysis of Kenya and Pacific Island taro germplasm. Scientia Agriculturae, 9(2), 101–108. https://doi.org/10.15192/PSCP.SA.2015.9.2.101108
- Alcantara, R. M., Hurtada, W. A., & Dizon, E. I. (2013). The nutritional value and phytochemical components of taro [Colocasia esculenta (L.) Schott] powder and its selected processed foods. Journal of Nutrition & Food Sciences, 3(3), 207. https://doi.org/10.4172/2155-9600.1000207
- Awopegba, M., Oladele, S., & Awodun, M. (2017). Effect of mulch types on nutrient composition, maize (Zea mays L.) yield and soil properties of a tropical Alfisol in Southwestern Nigeria. Eurasian Journal of Soil Science, 6(2), 121–133. https://doi.org/10.18393/ejss.286546
- Azad, B., Hassandokht, M. R., & Parvizi, K. (2015). Effect of mulch on some characteristics of potato in Asadabad, Hamedan. International Journal of Agronomy and Agricultural Research, 6(3), 139–147.
- Azam, F., Simmons, F. W., & Mulvaney, R. L. (1993). Mineralization of N from plant residues and its interaction with native soil N. Soil Biology & Biochemistry, 25(12), 1787–1792. https://doi.org/10.1016/0038-0717(93)90184-D
- Azene, H., & Molla, T. (2017). Nutritional Composition and Effects of Cultural Processing on Anti-nutritional Factors and Mineral Bioavailability of Colocasia Esculenta (Godere) Grown in Wolaita Zone, Ethiopia. Journal of Food and Nutrition Sciences, 5(4), 147–154. https://doi.org/10.11648/j.jfns.20170504.12
- Banjaw, D. T. (2017). Review of taro (Colocasia esculenta) genetics and breeding. The Horticulture Journal, 4(1), 196. https://doi.org/10.4172/2376-0354.1000196
- Benesi, I. R. M., Labuschagne, M. T., Dixon, A. G. O., & Mahungu, N. M. (2004). Stability of native starch quality parameters, starch extraction and root dry matter of cassava genotypes in different environments. Journal of the Science of Food and Agriculture, 84(11), 1381–1388. https://doi.org/10.1002/jsfa.1734
- Boampong, R., Aboagye, L. M., Nyadanu, D., & Esilfie, M. (2018). Agro-morphological characterization of some taro (Colocasia esculenta (L.) Schott.) germplasms in Ghana. Journal of Plant Breeding and Crop Science, 10(8), 191–202. https://doi.org/10.5897/JPBCS2018.0734
- Bray, R. H., & Kurtz, L. T. (1945). Determination of total, organic, and available forms of phosphorous in soils. Soil Science, 59(1), 39–45. https://doi.org/10.1097/00010694-194501000-00006
- Bremner, J. M., & Mulvaney, C. S. (1982). Nitrogen - total. In A. L. Page, R. H. Miller, & D. R. Keeney (Eds.), Methods of soil analysis, Part 2, Chemical and microbiological properties (pp. 595–624). ASA and SSSA.
- Brown, D. (2000). Aroids: Plants of the Arum family. Timber Press.
- Busari, T. I., Senzanje, A., Odindo, A. O., & Buckley, C. A. (2019). Evaluating the effect of irrigation water management techniques on (taro) madumbe (Colocasia esculenta (L.) Schott) grown with anaerobic filter (AF) effluent at Newlands, South Africa. Journal of Water Reuse and Desalination, 9(2), 203–212. https://doi.org/10.2166/wrd.2019.058
- Cao, J., Zhou, X., Zhang, W., Liu, C., & Liu, Z. (2012). Effects of mulching on soil temperature and moisture in the rain-fed farmland of summer corn in the Taihang Mountain of China. Journal of Food Agriculture and Environment, 10(1), 519–523.
- Champagne, A., Legendre, L., & Lebot, V. (2013). Biofortification of taro (Colocasia esculenta) through breeding for increased contents in carotenoids and anthocyanins. Euphytica, 194(1), 125–136. https://doi.org/10.1007/s10681-013-0980-5
- Chen, B., Liu, E., Tian, Q., Yan, C., & Zhang, Y. (2014). Soil nitrogen dynamics and crop residues. A Review. Agronomy for Sustainable Development, 34(2), 429–442. https://doi.org/10.1007/s13593-014-0207-8
- De la Peña, R. S., & Melchor, F. M. (1993). Effects of mulching and intercropping on upland taro. In L. Ferentinos (Ed.), Proceedings of the sustainable taro culture for the Pacific conference (pp. 46–47). HITAHR, University of Hawaii Research Extension Series 140.
- Deo, P. C., Harding, R. M., Taylor, M., Tyagi, A. P., & Becker, D. K. (2009). Somatic embryogenesis, organogenesis and plant regeneration in taro (Colocasia esculenta var. esculenta). Plant Cell, Tissue and Organ Culture, 99(1), 61–71. https://doi.org/10.1007/s11240-009-9576-0
- Devi, A. A. (2012). Genetic diversity analysis in taro using molecular markers - An overview. Journal of Root Crops, 38(1), 15–25.
- Fageria, N. K., Carvalho, G. D., Santos, A. B., Ferreira, E. P. B., & Knupp, A. M. (2011). Chemistry of lowland rice soils and nutrient availability. Communications in Soil Science and Plant Analysis, 42(16), 1913–1933. https://doi.org/10.1080/00103624.2011.591467
- FAO. (2018). FAOSTAT. Food and Agriculture Organization of the United Nations, Retrieved 24 February, 2020, from. http://www.fao.org/faostat/en/#data/QC/visualize
- Fooladmand, H. R. (2008). Estimating cation exchange capacity using soil textural data and soil organic matter content: A case study for the south of Iran. Archives of Agronomy and Soil Science, 54(4), 381–386. https://doi.org/10.1080/03650340802158193
- Ganança, J. F. T., Freitas, J. G. F., Nóbrega, H. G. M., Rodrigues, V., Antunes, G., Rodrigues, M., de Carvalho, M. Â. A. P., & Lebot, V. (2015). Screening of elite and local taro (Colocasia esculenta) cultivars for drought tolerance. Procedia Environmental Sciences, 29, 41–42. https://doi.org/10.1016/j.proenv.2015.07.146
- Gee, G. W., & Bauder, J. W. (1986). Particle-size analysis. In A. Klute (Ed.), Methods of soil analysis, Part 1, Physical and mineralogical methods (pp. 383–411). ASA and SSSA.
- Hartemink, A. E., Johnston, M., O’Sullivan, J. N., & Poloma, S. (2000). Nitrogen use efficiency of taro and sweet potato in the humid lowlands of Papua New Guinea. Agriculture, Ecosystems & Environment, 79(2–3), 271–280. https://doi.org/10.1016/S0167-8809(00)00138-9
- Hiraoka, H., Fukunaka, R., Ishikuro, E., Enishi, O., & Goto, T. (2012). Improvement and validation of the method to determine neutral detergent fiber in feed. Animal Science Journal, 83(10), 690–695. https://doi.org/10.1111/j.1740-0929.2012.01019.x
- Huang, A. S., Titchenal, C. A., & Meilleur, B. A. (2000). Nutrient composition of taro corms and breadfruit. Journal of Food Composition and Analysis, 13(5), 859–864. https://doi.org/10.1006/jfca.2000.0936
- Huang, C.-C., Chen, W.-C., & Wang, C.-C. R. (2007). Comparison of Taiwan paddy- and upland-cultivated taro (Colocasia esculenta L.) cultivars for nutritive values. Food Chemistry, 102(1), 250–256. https://doi.org/10.1016/j.foodchem.2006.04.044
- Huang, T. F., & Lee, T. C. (1997). The influence of different mulching materials and the irrigation water quality on the growth of tea plants. C. Y. Lin, H. S. Lu, & S. Y. Liu Eds., Proceedings of a symposium on the experimental results of special crops 1997. TARI Special Publication No. 74. (103–111). Taiwan Agricultural Research Institute.
- Ilodibia, C. V., Ugwu, R. U., Okeke, C. U., Ezeabara, C. A., Okeke, N. F., Akachukwu, E. E., & Aziagba, B. O. (2014). Determination of proximate composition of various parts of two Dracaena species. International Journal of Botany, 10(1), 37–41. https://doi.org/10.3923/ijb.2014.37.41
- Ismail, A. M., Johnson, D. E., Ella, E. S., Vergara, G. V., & Baltazar, A. M. (2012). Adaptation to flooding during emergence and seedling growth in rice and weeds, and implications for crop establishment. AoB Plants, 2012, pls019. https://doi.org/10.1093/aobpla/pls019
- Iwuagwu, M. O., Okpara, D. A., Muoneke, C. O., & Ukaoma, A. A. (2016). Organic and mineral fertilizer effects on growth and yield of cocoyam in a tropical Ultisol in South Eastern Nigeria. Journal of Plant Breeding and Crop Science, 8(10), 175–181. https://doi.org/10.5897/JPBCS2016.0583
- Kasirajan, S., & Ngouajio, M. (2012). Polyethylene and biodegradable mulches for agricultural application s: A review. Agronomy for Sustainable Development, 32(2), 501–529. https://doi.org/10.1007/s13593-011-0068-3
- Kaushal, P., Kumar, V., & Sharma, H. K. (2015). Utilization of taro (Colocasia esculenta): A review. Journal of Food Science and Technology, 52(1), 27–40. https://doi.org/10.1007/s13197-013-0933-y
- Khan, A. H., Minhas, N. M., Asad, M. J., Iqbal, A., Ilyas, M., & Mahmood, R. T. (2014). Estimation of protein, carbohydrate, starch and oil contents of indigenous maize (Zea mays L.) germplasm. European Academic Research, 2(4), 5230–5240.
- Kiran Kumar, M., & Sandeep, B. V. (2016). Comparative study of proximate composition and total antioxidant activity in leaves and seeds of. Oryza Sativa and Myriostachya Wightiana. International Journal of Advanced Research, 4(2), 842–852.
- Kosterna, E. (2014). The effect of covering and mulching on the temperature and moisture of soil and broccoli yield. Acta Agrophysica, 21(2), 165–178.
- Kundu, R., Pal, S., & Bandopadhyay, P. (2011). Response of taro to arsenic contamination in the Ganga basin of Eastern India. Journal of Root Crops, 37(2), 168–173.
- Lebot, V. (2009). Tropical root and tuber crops: Cassava, sweet potato, yams and aroids. CABI International.
- Lebot, V., Ivancic, A., & Quero-García, J. (2006). Comparative performance of local and introduced cultivars of taro (Colocasia esculenta (L.) Schott) in Vanuatu. In Proceedings of the 14th symposium of the international society for tropical root crops (pp. 1–12). Central Tuber Crops Research Institute, Trivandrum, India.
- Lebot, V., Malapa, R., & Bourrieau, M. (2011). Rapid estimation of taro (Colocasia esculenta) quality by near-infrared reflectance spectroscopy. Journal of Agricultural and Food Chemistry, 59(17), 9327–9334. https://doi.org/10.1021/jf202310w
- Lewu, M. N., Adebola, P. O., & Afolayan, A. J. (2010). Comparative assessment of the nutritional value of commercially available cocoyam and potato tubers in South African. Journal of Food Quality, 33(4), 461–476. https://doi.org/10.1111/j.1745-4557.2010.00325.x
- Lin, M.-C., & Hou, C.-J. (2017). Effect of mulch management on weed control of taro cultivated in lowland and upland field. Weed Science Bulletin, 38, 169–184. ( in Chinese).
- Livesey, G. (1995). Metabolizable energy of macronutrients. The American Journal of Clinical Nutrition, 62(5), 1135S–1142S. https://doi.org/10.1093/ajcn/62.5.1135S
- Lordan, J., Pascual, M., Villar, J. M., Fonseca, F., Papió, J., Montilla, V., & Rufat, J. (2015). Use of organic mulch to enhance water-use efficiency and peach production under limiting soil conditions in a three-year-old orchard. Spanish Journal of Agricultural Research, 13(4), e0904. https://doi.org/10.5424/sjar/2015134-6694
- Mabhaudhi, T., Modi, A. T., & Beletse, Y. G. (2013). Response of taro (Colocasia esculenta L. Schott) landraces to varying water regimes under a rainshelter. Agricultural Water Management, 121, 102–112. https://doi.org/10.1016/j.agwat.2013.01.009
- Manu, V., Whitbread, A., & Blair, G. (2018). Effects of vegetative mulches on growth of indigenous crops in the Kingdom of Tonga. Soil Use and Management, 34(1), 147–153. https://doi.org/10.1111/sum.12398
- McCleary, B. V., Charmier, L. M. J., & McKie, V. A. (2019). Measurement of starch: Critical evaluation of current methodology. Starch/Stärke, 71(1–2), 1800146. https://doi.org/10.1002/star.201800146
- McIntyre, B. D., Speijer, P. R., Riha, S. J., & Kizito, F. (2000). Effects of mulching on biomass, nutrients, and soil water in banana inoculated with nematodes. Agronomy Journal, 92(6), 1081–1085. https://doi.org/10.2134/agronj2000.9261081x
- McLean, E. O. (1982). Soil pH and lime requirement. In A. L. Page, R. H. Miller, & D. R. Keeney (Eds.), Methods of soil analysis, Part 2, Chemical and microbiological properties (pp. 199–223). ASA and SSSA.
- Melese, T., Negussie, R., Etalem, T., & Rikard, L. (2015). Effect of pre-gelatinization on nutritive and non-nutritive constitutes of taro (Colocasia Esculenta L) corm. Journal of Nutrition & Food Sciences, S14, 005. https://doi.org/10.4172/2155-9600.S14-005
- Mergedus, A., Kristl, J., Ivancic, A., Sober, A., Sustar, V., & Krizan, T. (2015). Variation of mineral composition in different parts of taro (Colocasia esculenta) corms. Food Chemistry, 170, 37–46. https://doi.org/10.1016/j.foodchem.2014.08.025
- Mertens, D. R. (2002). Gravimetric determination of amylase-treated neutral detergent fiber in feeds with refluxing in beakers or crucibles: Collaborative study. Journal of AOAC International, 85(6), 1217–1240.
- Misra, R., Sharma, K., & Mishra., A. (2008). Phytophthora leaf blight of taro (Colocasia esculenta) – A review. The Asian and Australasian Journal of Plant Science and Biotechnology, 2(2), 55–63.
- Miyasaka, S. C., Hollyer, J. R., & Kodani, L. S. (2001). Mulch and compost effects on yield and corm rots of taro. Field Crops Research, 71(2), 101–112. https://doi.org/10.1016/S0378-4290(01)00154-X
- Mukhtar, H., & Lin, Y.-P. (2019). Soil nitrification potential influences the performance of nitrification inhibitors DCD and DMPP in cropped and non-cropped soils. Agronomy, 9(10), 599. https://doi.org/10.3390/agronomy9100599
- Murphy, R. P., Montes-Molina, J. A. M., Govaerts, B., Six, J., van Kessel, C., & Fonte, S. J. (2016). Crop residue retention enhances soil properties and nitrogen cycling in smallholder maize systems of Chiapas, Mexico. Applied Soil Ecology, 103, 110–116. https://doi.org/10.1016/j.apsoil.2016.03.014
- Mwango, S. B., Msanya, B. M., Mtakwa, P. W., Kimaro, D. N., Deckers, J., & Poesen, J. (2016). Effectiveness OF Mulching Under Miraba in Controlling Soil Erosion, Fertility Restoration and Crop Yield in the Usambara Mountains, Tanzania. Land Degradation & Development, 27(4), 1266–1275. https://doi.org/10.1002/ldr.2332
- Nachimuthu, G., Halpin, N. V., & Bell, M. J. (2017). Productivity benefits from plastic mulch in vegetable production likely to limit adoption of alternate practices that deliver water quality benefits: An on-farm case study. Horticulturae, 3(3), 42. https://doi.org/10.3390/horticulturae3030042
- Nand, A. V., Charan, R. P., Rohindra, D., & Khurma, J. R. (2008). Isolation and properties of starch from some local cultivars of cassava and taro in Fiji. The South Pacific Journal of Natural and Applied Sciences, 26(1), 45–48. https://doi.org/10.1071/SP08007
- Nedunchezhiyan, M., Ravindran, C. S., & Ravi, V. (2013). Weed management in root and tuber crops in India: Critical analysis. Journal of Root Crops, 39(2), 13–20.
- Nelson, D. W., & Sommers, L. E. (1996). Total carbon, organic carbon, and organic matter. In D. L. Sparks (Ed.), Methods of soil analysis, Part 3, Chemical methods (pp. 961–1010). ASA and SSSA.
- Ngoran, K., Zapata, F., & Sanginga., N. (1998). Availability of N from Casuarina residues and inorganic N to maize, using 15 N isotope techniques. Biology and Fertility of Soils, 28(1), 95–100. https://doi.org/10.1007/s003740050468
- Nzeyimana, I., Hartemink, A. E., Ritsema, C., Mbonigaba, J. J. M., & Geissen., V. (2020). Mulching effects on soil nutrient levels and yield in coffee farming systems in Rwanda. Soil Use and Management, 36(1), 58–70. https://doi.org/10.1111/sum.12534
- O’Hair, S. K., Snyder, G. H., & Morton, J. F. (1982). Wetland taro: A neglected crop for food, feed and fuel. Proceedings of the Florida State Horticultural Society, 95, 367–374.
- Onwueme, I. (1999). Taro cultivation in Asia and the Pacific. FAO Regional Office for Asia and the Pacific.
- Opara, L. U. (2001). Edible aroids: Post-harvest operations. AGST/FAO.
- Osorio, N. W., Shuai, X., Miyasaka, S., Wang, B., Shirey, R. L., & Wigmore, W. J. (2003). Nitrogen level and form affect taro growth and nutrition. HortScience, 38(1), 36–40. https://doi.org/10.21273/HORTSCI.38.1.36
- Owen, J. S., King, H. B., Wang, M. K., & Sun, H. L. (2010). Net nitrogen mineralization and nitrification rates in forest soil in northeastern Taiwan. Soil Science and Plant Nutrition, 56(1), 177–185. https://doi.org/10.1111/j.1747-0765.2009.00427.x
- Ramanatha Rao, V., Matthews, P. J., Eyzaguirre, P. B., & Hunter, D. (2010). The global diversity of taro: Ethnobotany and conservation. Bioversity International.
- Ramírez-López, E., Corona-Hernández, J., Dendooven, L., Rangel, P., & Thalasso, F. (2003). Characterization of five agricultural by-products as potential biofilter carriers. Bioresource Technology, 88(3), 259–263. https://doi.org/10.1016/S0960-8524(02)00315-2
- Römkens, P. F., Guo, H. Y., Chu, C. L., Liu, T. S., Chiang, C. F., & Koopmans, G. F. (2009). Characterization of soil heavy metal pools in paddy fields in Taiwan: Chemical extraction and solid-solution partitioning. Journal of Soils and Sediments, 9(3), 216–228. https://doi.org/10.1007/s11368-009-0075-z
- Ruíz-Machuca, L. M., Ibarra-Jiménez, L., Valdez-Aguilar, L. A., Robledo-Torres, V., Benavides-Mendoza, A., & Cabrera-De La Fuente, M. (2014). Cultivation of potato – Use of plastic mulch and row covers on soil temperature, growth, nutrient status, and yield. Acta Agriculturae Scandinavica, Section B - Soil & Plant Science, 65(1), 30–35. https://doi.org/10.1080/09064710.2014.960888
- Sahrawat, K. L. (2005). Fertility and organic matter in submerged rice soils. Current Science, 88, 735–739.
- Sibiya, S. G. (2015). Planting density effect on growth and yield of taro (Colocasia esculenta) landraces. The MSc. thesis. University of KwaZulu-Natal.
- Silva, E. E., Da, Azevedo, P. H. S. D., Almeida, M. M. T. B., De-Polli, H., & Guerra, J. (2008). Influence of intercropping and irrigation frequency in the leaf development and taro (Cocoyam) productivity under organic management. In D. Neuhoff, N. Halberg, T. Alföldi, W. Lockeretz, A. Thommen, I. A. Rasmussen, J. Hermansen, M. Vaarst, L. Lueck, F. Caporali, H. H. Jensen, P. Migliorini, & H. Willer (Eds.), Cultivating the future based on science. Volume 1: Organic Crop Production. Proceedings of the Second Scientific Conference of the International Society of Organic Agriculture Research (ISOFAR) (pp. 404–407). ISOFAR.
- Sivan, P. (1984). Review of taro research and production in Fiji. In S. Chandra (Ed.), Edible aroids (pp. pp. 52–63). Oxford, UK.
- Sójka, M., Klimczak, E., Macierzyński, J., & Kołodziejczyk, K. (2013). Nutrient and polyphenolic composition of industrial strawberry press cake. European Food Research and Technology, 237(6), 995–1007. https://doi.org/10.1007/s00217-013-2070-2
- Son, C. Y., & Rutto, K. L. (2002). Are herbicides essential for paddy weed-control in East Asia? Pakistan Journal of Biological Sciences, 5(12), 1352–1362. https://doi.org/10.3923/pjbs.2002.1352.1362
- Suja, G., Byju, G., Jyothi, A. N., Veena, S. S., & Sreekumar, J. (2017). Yield, quality and soil health under organic vs conventional farming in taro. Scientia Horticulturae, 218, 334–343. https://doi.org/10.1016/j.scienta.2017.02.006
- Suminarti, N. E., Ariffin, G. B., & Rayes, M. L. (2016). Effect of fertilizer application and plant density on physiological aspect and yield of taro (Colocasia esculenta (L.) Schott var. Antiquorum). International Journal of Agricultural Research, 11(1), 32–39. https://doi.org/10.3923/ijar.2016.32.39
- Sun, Z., Mou, X., & Liu, J. S. (2012). Effects of flooding regimes on the decomposition and nutrient dynamics of Calamagrostis angustifolia litter in the Sanjiang Plain of China. Environmental Earth Sciences, 66(8), 2235–2246. https://doi.org/10.1007/s12665-011-1444-7
- Thiex, N. J., Anderson, S., & Gildemeister, B. (2003). Crude fat, diethyl ether extraction, in feed, cereal grain, and forage (Randall/Soxtec/Submersion Method): Interlaboratory study, ISO/IUPAC/AOAC harmonized protocol. Journal of AOAC International, 86(5), 899–908. https://doi.org/10.1093/jaoac/86.5.899
- Thiex, N. J., Manson, H., Anderson, S., & Persson, J.-Å. (2002). Determination of crude protein in animal feed, forage, grain, and oilseeds by using block digestion with a copper catalyst and steam distillation into boric acid: Collaborative study. Journal of AOAC International, 85(2), 309–317. https://doi.org/10.1093/jaoac/85.2.309
- Thomas, G. W. (1982). Exchangeable cations. In A. L. Page, R. H. Miller, & D. R. Keeney (Eds.), Methods of soil analysis, Part 2, Chemical and microbiological properties (pp. 159–165). ASA and SSSA.
- Tong, P. S. (2016). Colocasia esculenta (taro, yam, keladi) as a small farm crop in the Kinta Valley of Malaysia. Utar Agriculture Science Journal, 2(1), 49–56.
- Tsai, Y.-F., Tang, M.-H., & Wang, M.-H. (2016). Effects of compost and mulching on the soil fertility and yield performance of organic dryland taro (Colocasia esculenta). Bulletin of Taichung District Agricultural Research and Extension Station, 132, 37–46.
- Tsedalu, M., Tesfaye, B., & Goa, Y. (2014). Effect of type of planting material and population density on corm yield and yield components of taro (Colocasia Esculenta L.). Journal of Biology, Agriculture and Healthcare, 4(17), 124–137.
- Tsui, -C.-C., Guo, H.-Y., & Chen, Z.-S. (2013). Estimation of soil carbon stock in Taiwan arable soils by using legacy database and digital soil mapping. In M. C. H. Soriano (Ed.), Soil processes and current trends in quality assessment (pp. 311–335). IntechOpen Limited.
- Tumuhimbise, R., Talwana, H. L., Osiru, D. S. O., Serem, A. K., Ndabikunze, B. K., Nandi, T. O. M., & Palapala, V. (2009). Growth and development of wetland grown taro under different plant populations. African Crop Science Journal, 17(1), 49–60. https://doi.org/10.4314/acsj.v17i1.54210
- Wills, R. B. H., Lim, J. S. K., Greenfield, H., & Bayliss-Smith, T. (1983). Nutrient composition of taro (Colocasia esculenta) cultivars from the Papua New Guinea highlands. Journal of the Science of Food and Agriculture, 34(10), 1137–1142. https://doi.org/10.1002/jsfa.2740341015
- Yang, K. S. (1991). Study on building a fertilizer recommendation system. [Unpublished doctoral dissertation]. National Taiwan University.