 ?Mathematical formulae have been encoded as MathML and are displayed in this HTML version using MathJax in order to improve their display. Uncheck the box to turn MathJax off. This feature requires Javascript. Click on a formula to zoom.
ABSTRACT
Currently, most rice farmers in the central highlands of Madagascar do not apply mineral fertilizer in their fields and we investigated whether a fertilizer micro-dose applied to the seedling nursery could serve as an entry point for intensification. Effects of nursery applications of a micro-dose of mineral (P and NPK) or locally produced sources of fertilizers (Guanomad, Vermicompost) on seedling vigour were evaluated, as was final grain yield after transplanting to main fields that were either not fertilized (farmers’ practice) or received combinations of mineral N, P and K fertilizer. Applying only P to the nursery had minor effects and we conclude that early seedling vigor is more limited by N than P, while grain yield in the main field was more limited by P than N. Carry-over effects of the nursery application of NPK and of guano on final grain yield were observed under farmers’ practice and when only urea was applied. The nursery NPK application significantly increased agronomic nitrogen use efficiency of urea application. We conclude that the low cost of micro-dosing NPK in the nursery makes this a profitable option for small-scale farmers cultivating rice on poor-fertility soils. Sole urea application in the main field is not a profitable option but would at least need additional nursery NPK application as an insurance against losing investments in N fertilization. Longer-term sustainability would require direct nutrient inputs into the main plot and additional low-cost nutrient management options should therefore be considered.
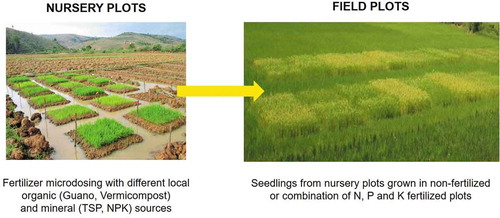
Graphical Abstract
Introduction
Rice yields in sub-Saharan Africa (SSA) are currently low and limited fertilizer inputs combined with the poor nutrient supplying capacity of soils are key factors limiting rice productivity. P deficiency is one major stress (Dogbe et al., Citation2015; Saito et al., Citation2019) caused by its poor mobility in soils as P is rapidly bound as a result of fixation/adsorption reactions with Fe and Al oxyhydroxide minerals in soils (Nishigaki et al., Citation2019). Farmers in SSA are generally smallholders and lack financial means to purchase adequate quantities of mineral fertilizers that could alleviate P deficiency and improve grain yields. Although a strong relationship between agriculture production and the availability of credit to farmers has been established for SSA (Akinkunmi, Citation2017), the lack of appropriate credit facilities and high interest rates still remain a constraint (Africa Rice, Citation2011). As a result, fertilizer application rates remain low and for Madagascar, the 3rd largest rice producer in Africa, annual fertilizer application rates on cropland were estimated to be as low as 8.7 kg N ha−1, 1.1 kg P2O5 ha−1 and 1 kg K2O ha−1 in 2017 (FAOSTAT, Citation2019).
Recommended fertilizer application rates are often high and pose a rather large cost for smallholder farmers in SSA. Micro-dosing fertilizers may represent an alternative and for rice, options exist to do so in the seedling nursery, where seedlings are raised before transplanting, as well as in the main field. The application of a micro-dose of P in the nursery bed can improve seedling growth was shown to have a carry-over effect on grain yield of transplanted rice under P deficient conditions (Vandamme et al., Citation2016). This strategy consists of concentrating small rates of P fertilizer in the densely planted nursery. The high density of seedlings assures applied fertilizer is in close proximity to roots and therefore nutrient uptake is optimized, unlike in the main plot where larger spacing between rows reduces contact between roots and broadcast fertilizer. This method had been developed to increase crop productivity at low fertilizer rates (Valluru et al., Citation2010), and increased rice grain yields are an effect of vigorous seedling growth and an accumulation of nutrients in these seedlings (Ros et al., Citation2003; Vandamme et al., Citation2016). Since P uptake of rice can start as early as 2 days after germination (Julia et al., Citation2018), P is expected to rapidly accumulate in seedlings and excess stored P may give seedlings a boost in growth after they were transplanted into a low-P main field.
A second reason to consider micro-dosing of P stems from the fact that P fertilizer prices are predicted to increase in the coming years because of the decrease in world reserves of high-quality rock phosphates, which are the non-renewable resource from which P fertilizers are made (Cordell et al., Citation2009). It is clear that such a situation calls for alternatives to blanket recommendations of mineral P fertilizers at high doses, especially in the context of smallholder farmers in SSA. However, as far as we are aware, studies related to P micro-dosing in the nursery bed have all focussed on the effect of P when combined with NK application, without considering sole effects of P or combined effects with fertilizer management in the main field. Phosphorus deficiency is often associated with other macronutrient deficiencies both at nursery and field scales in SSA (Saito et al., Citation2019; Tsujimoto et al., Citation2019) and these potential effects should be considered when evaluating the efficacy of micro-dosing P in the seedling nursery.
Consequently, we follow two main objectives in this field study conducted in the lowland rice system in central Madagascar: i) we investigate the effect of micro-dose P applications of different mineral and local P sources to the nursery on seedling vigor and subsequent crop performance in an unfertilized main plot (not applying fertilizers to fields is current farmers’ practice on about 80% of the lowland rice area in Madagascar (Tsujimoto et al., Citation2019)); and ii) to extend this analysis to include different blanket fertilizer applications to the main plot.
Materials and methods
Field sites
The experiments were conducted in three different paddy fields located in Behenjy 1 (19°10ʹ46.5312 S, 47°29ʹ49.3872” E, 1361 m elevation), in Behenjy 2 (19°10ʹ47.71”S, 47°29ʹ37.46”E, 1376 m elevation) and Antohobe (19°46ʹ41.016”S, 46°41ʹ59.99”E, 1238 m elevation) in the Vakinankaratra Region in Madagascar. Temperature conditions for each experiments are as follows (average/average minimum/average maximum): 21°C/16°C/28°C for Behenjy 1; 23°C/19°C/30°C for Behenjy 2 and 22°C/18°C/29°C for Antohobe. Selected soil physical and chemical characteristics of composite samples (0–20 cm depth) from the three fields are shown in . All three fields can be considered P-deficient based on soil extractable resin-P values below 19 mg P kg−1, which is considered the threshold necessary to produce 80% of the biomass achievable under P-sufficient conditions (Six et al., Citation2013).
Table 1. Selected soil characteristics of fields Behenjy 1, Behenjy 2 and Antohobe. Values are mean of 4 replicates and standard deviations are between brackets
Experiments
Experiments were conducted over two seasons under irrigated lowland conditions. In year 1 rice was grown between October 2016 and May 2017 at the Behenjy 1 site, and in year two at the Behenjy 2 and Antohobe sites, again between October 2017 to May 2018. In the nursery, rice was grown for 30 days without any fertilization applied (control or nCt), application of sole 6 g P m−2 soil as Triple Superphosphate (nTSP), Guanomad (nGN), Vermicompost (nVC) or NPK fertilizer (nNPK) in two replications ().
Table 2. Nutrients (N, P and K) application rates with different fertilizer treatments in nursery for the three different sites
Nursery plots were ridges of 1 m2 area per treatment elevated 20 cm above irrigation/drainage furrows. Watering was done with a watering can during the initial 2 weeks of seedling establishment, and by furrow irrigation (not submerging the plots) until transplanting. The amendments and fertilizers were crushed to powder, mixed well with about 1 kg of the hand-crushed surface soil from each nursery plot in a plastic cuvette and then uniformly applied. After that, nursery beds were wetted and 60 g (2200 seeds m−2) of pregerminated (for nRB, nGN, nVC) and non-germinated (for nTSP and nNPK) seeds of X265 variety were sown and covered with a fine layer of hand-crushed soil and dry grass. Using pre-germinated seeds was supposed to compensate for the delayed nutrient release because inorganic fertilizers nTSP and nNPK release their nutrients fast while the release is expected to be slower for the three organic amendments. At 30 days after sowing (DAS), seedlings were transplanted to the main field. On the same day, seedlings (shoot and root) were sampled from three different 10 cm x 10 cm squares of each nursery plot. First, a small shovel was used to excavate the roots by inserting from the top of the ridge to its bottom following the edges of each 10 cm x 10 cm square. Roots were gently pulled together with any sticking soil and shaken gently in the irrigation water to rinse, shoots and roots were separated afterwards. Shoots and roots were further washed with tap water and oven dried at 75°C for 48 hours, and weight recorded. Shoots were ground and analyzed for N concentrations after an overnight extraction with sulfosalicylic reagent and digestion in concentrated H2SO4 at 200°C followed by colorimetric analyses in a flow injection analyzer (Skalar) (adapted from Rabeharisoa and al (Rabeharisoa et al., Citation2012)). Phosphorus concentrations in shoots were analyzed after hot HNO3 digestion with the molybdenum blue colorimetric method in a spectrophotometer at 882 nm (Murphy & Riley, Citation1962). Nitrogen and P contents in shoots were calculated from tissue concentration and dry weight.
In the main field, four treatments were applied for Behenjy 1 in year 2017 and that increased to five for Behenjy 2 and Antohobe in year 2018. For Behenjy 1, treatments were control (no fertilizer), P only as TSP at 25 kg P ha−1 (57.3 kg P2O5 ha−1), NK as urea at 100 kg N ha−1 and KCl at 50 kg K ha−1 (60 kg K2O ha−1), and NPK as NPK fertilizer completed with urea and KCl to have 25 kg P ha−1, 100 kg N ha−1 and 50 kg K ha−1. This experiment in year 2017 was to assess the effect of nursery fertilization on final rice yields in the absence/presence of P with or without NK fertilizer addition. For experiments in year 2018, the no fertilizer control, sole P and NPK additions were as in 2017.Instead of the NK fertilization we applied sole N as urea at 100 kg N ha−1 and combined NP as urea at 100 kg N ha−1 and TSP at 25 kg P ha−1. Here, nursery treatment effects on final yields under sole N, sole P, combined N and P, and K omission can be evaluated. Treatments were arranged in a split-plot design with field treatments as main plots with 4 replications and nursery treatments as sub-plots randomized within each main plot. Main plots (field treatments) were separated to each other by 50 cm-wide bunds. Main plot size was 6 m x 3 m and contained 6 sub-plots of 3 m x 1 m. Nitrogen and K were split applied at transplanting (basal) and maximum tillering (top-dressed). Irrigation and drainage were done by avoiding inter-exchange of water from plots. Soil was ploughed, submerged with water and subsequently puddled prior to transplanting which was manually done with two seedlings per hill with spacing of 20 × 20 cm between hills. The water level was maintained at 10 cm above the soil surface after transplanting to the harvest. Two weedings were done at 4 and 7 weeks after transplanting with a hand-pushed weeder. At harvest, the maturity date was recorded and panicle and straw of plants excluding borders (one row) were collected with 2.24 m2 of harvest area per treatment. Panicle and straw weight was recorded after air-drying (~ 14% of samples humidity).
Agronomic efficiency of N application (AEN) in the main field
Agronomic N use efficiency (AEN, g g−1) as the increase in grain yield per kg of fertilizer N input in the main field was compared under different nursery fertilizer treatments in the following equation:
where YnX-N indicates the grain yield when N was applied in the main field – NK and NPK treatments in Behenjy 1 and N, NP and NPK treatments in Behenjy 2 and Antohobe – at a given nursery fertilizer treatment, nCt, nTSP, nVC, nGN or nNPK. YnX-Ct indicates the grain yield without fertilizer application in the main field under the given nursery fertilizer treatment. Napplied refers to the amounts of N rates in the main field that were all 10 g m−2 in both NK and NPK treatments in Behenjy 1 and N, NP and NPK treatments in Behenjy 2 and Antohobe.
Economic analyses
Benefits related to the use of different micro-dose P nursery fertilizations were calculated based on fertilizer, labor and seed costs incurred from each nursery and main field treatments for year 2018 in Behenjy 2 and Antohobe. Fertilizer costs, seed cost and paddy price were of 2018. Labor costs included for the nursery: field preparation, fertilizer application, sowing, watering and transplanting. For the main field, labor costs are field preparation, fertilizer application, weeding, harvest, transport and post-harvest tasks.
Statistical analyses
Nursery treatment effects were analyzed across all three sites using a mixed model ANOVA with nursery treatment as a fixed effect and sites and nursery treatment x site interactions as random effects. This was then followed by Tukey HSD post-hoc analyses for nursery treatment means. To analyze carry-over effects of nursery treatments on grain yields in the main plot, two separate analyses were conducted. Since one of our main objectives was to test nursery treatment effects on grain yield under farmer practice (Ct in main field), one separate ANOVA was conducted for just this sub-set of data. This was followed by a split-plot ANOVA with field treatment as main plot and nursery treatment as sub-plot for the entire data set. Tukey HSD post-hoc analyses were afterwards run for group means for both field and nursery treatments. Nursery treatment effect on AEN was analyzed by one-way ANOVA also followed by Tukey HSD post-hoc tests. Statistical analyses were done with the R(x64) 3.4.0 program (https://www.r-project.org/) with significance set at P < 0.05.
Results
Seedlings characteristics affected by nursery treatments
Using a mixed model to analyze nursery treatment effects on seedling characteristics showed highly significant nursery treatment effects for all measured parameters at the time of transplanting (P values ranging from P < 0.001 for shoot biomass, plant height, leaf number, root number, root:shoot ratio, P uptake and N uptake; to P < 0.05 for root biomass, data not shown). Site effects were only significant for traits root number (P < 0.01) and leaf number and root:shoot ratio (P < 0.05) and the interaction effect of nursery treatment x site was generally not significant. Given that interaction effects were negligible and that seedling characteristics were most strongly affected by nursery treatments, mean nursery effects across sites shall be further investigated.
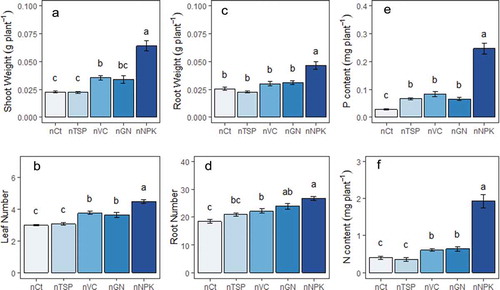
Nursery application of mineral NPK fertilizer (nNPK) and of compost (nVC) increased seedling shoot biomass relative to the control (nCt) () with NPK application having the most pronounced effect (2.8 times increase over nCt). Application of phosphate fertilizer only (nTSP) and of guano (nGN) had no effect on shoot biomass. Very similar effects were observed for leaf number ()), indicating nursery fertilization increased seedling biomass partly through speeding up plant development. For root biomass ()), only seedlings with nNPK had significantly bigger roots compared to the control treatment with nNPK increasing root biomass by 69%. In terms of seedling root number ()), nTSP had no effect compared to the control with other treatments increasing root number by 20, 29, or 45% for nVC, nGN and nNPK, respectively. The strong nursery treatment effects on biomass are reflected by similar effects on seedling shoot P and N content (). The increases in P and N content were most pronounced in the nNPK treatment (> 400%), while compost and guano also significantly increase P and N content over control but to a lesser extent. Supplying TSP to the nursery had a positive effect on P content only but the soluble P was apparently not better in supplying P compared to the organic P sources.
Figure 1. Data from seedlings sampled on the day of transplanting (30 days after sowing): shoot weights (a) and leaf number (b) root weights (c) and number (d), P (e) and N (f) contents of seedlings from nursery plots affected by different types of fertilizers. Values are mean of all three fields (n = 6), error bars are standard errors and letters represent significant differences between nursery treatments within each field treatment. For shoot weight was log-transformed and square-root transformed for P content and N content and the statistical analysis performed on the transformed data. Nursery mean data shown is non-transformed data
Grain yields affected by nursery and field treatments
shows combined effects of nursery treatments and main field fertilization on grain yield for the Behenjy experiment in 2017. Relative to the main plot control without any fertilizer application (Ct), significant yield increases were observed for the NK and NPK treatments. While applying only P had no significant effect, the application of P when N and K were present had a significant and large effect (+50% for NPK compared to NK). Average effects of nursery treatments (across main plots) were detected and showed that all nursery treatments resulted in significantly improved grain yield compared to nCt, with advantages ranging from 10% for nTSP to 22% for nNPK (). A further breakdown of nursery effects within main plots only detected significant effects for the NK main plot treatment, where the nNPK and guano additions had lasting effects relative to no additions in the nursery ().
Table 3. Year 1 (2017) grain yield affected by nursery treatments across field treatments. Values are mean of nursery treatments (n = 16) with standard deviations between brackets
Figure 2. Year 1 (2017) grain yield affected by nursery and field treatments in Behenjy 1 site. Values are mean of 4 replicates and error bars represent standard error of mean. Different letters above lines represent significant difference between field treatments. Significant differences between nursery treatments within field treatment are indicated by different letters. NT: nursery treatment, FT: field treatment, NTxFT: interaction nursery and field treatments. *: p-value < 0.05, **: p-value < 0.01 and ***: p-value < 0.001
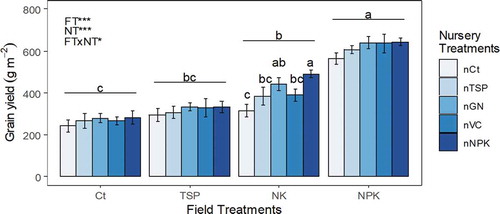
Main plot fertilization and nursery treatments furthermore affected crop maturity that ranged between 154 days (NPK) and 166 days after sowing in the control without fertilizer application (suppl Fig. S1). Thus, the lack of fertilizer application delayed maturity by up to 12 days and this was mostly attributable to the lack of P, as the NK treatment showed a delay of 11 days compared to only 5 days in the P treatment. Average nursery effects were smaller and not detectable when P was applied in the main plot (P or NPK). However, in the absence of main plot P application (Ct, NK) a nursery application of NPK was able to reduce the delay in maturity by 11–13 days.
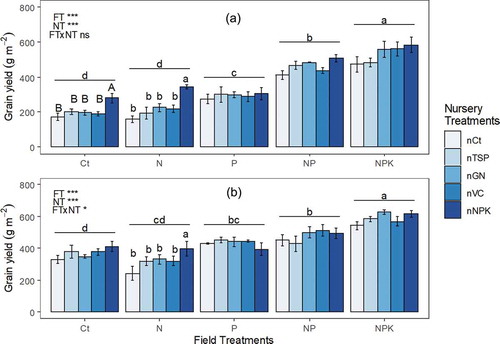
The effect of nursery treatment and field treatment on grain yield is shown in for the two sites used in 2018. Main plot and sub-plot (nursery treatments) were highly significant at both sites, while the interaction term was only significant in Antohobe. In both sites, highest yields were achieved with NPK fertilizer followed by NP and P treatments. In these three higher yielding treatments nursery effects were not significant. This changed for the lower yielding N treatment where the nursey application of NPK significantly increased yields compared to the nCt control (no application in nursery). When no fertilizer was applied to the main plots, the nursery NPK application improved yield in Behenjy (). However, this effect only became significant in an ANOVA testing nursery effects within the Ct main plot in Behenjy 2 but not in Antohobe (). This may be related to the higher general soil fertility in Antohobe where yields in Ct plots were 50% higher compared to Behenjy. As in year one, a delay in maturity of 15 to 17 days relative to the NPK treatment was observed in main plots not having received any P fertilizer (Ct and N treatments) (Figure S2). Nursery effects on reducing the delayed maturity were not detected in year 2.
Figure 3. Year 2 (2018) grain yield affected by nursery and field treatments in Behenjy 2 (a) and Antohobe (b) sites. Values are mean of 4 replicates and error bars represent standard error of mean. Different letters above lines represent significant difference between field treatments. Significant differences between nursery treatments within field treatment are indicated by different letters. Significant differences between nursery treatments within Ct treatment only are indicated by different capital letters. N T: nursery treatment, FT: field treatment, NTxFT: interaction nursery and field treatments. ns: not significant, *: p-value < 0.05, **: p-value < 0.01 and ***: p-value < 0.001
Agronomic efficiency of N application (AEN) in the main field affected by nursery treatment
Because nursery treatment effects on grain yields were only significant in NK (Behenjy 1) or N (Behenjy 2 and Antohobe) applications in the main field (), AEN values as affected by nursery treatments were compared for the NK plots in Behenjy 1 and N plots in Behenjy 2 and Antohobe (). In Behenjy1, the small amount of NPK application to the nursery (nNPK) significantly increased AEN in the main field from 7.3 to 20.8 kg kg−1. For the other sites, nNPK tended to produce higher AEN values than nCt while differences were not statistically significant.
Table 4. Agronomic efficiency of N field application (NK for Behenjy 1 in year 2017, N for year 2018 in Behenjy 2 and Antohobe) affected by nursery treatments. Values are mean of 4 replicates, standard deviations are between brackets and letters represent significant differences between nursery treatments for each site. AEN of a given nursery treatment is difference between grain yield of that nursery treatment in the N or NK main field minus that of main field control
Economic benefits
In order to calculate benefits of nursery and main plot fertilizer options, we have calculated the general costs of rice production that occur irrespective of fertilizer application such as costs for seed or labour for nursery and main plot activities, and we calculated the specific costs of fertilizer application in the nursery or main plot. General costs amount to an equivalent of 397 US$ ha−1 (, nCt/Ct treatment combination). These include 14 US$ ha−1 for seeds, from labour costs of 41 US$ ha−1 (28.5 man days ha−1 at 1.45 US$ day−1) for the nursery preparation and maintenance plus 342 US$ ha−1 (236 man days ha−1 at 1.45 US$ day−1) for the main field operations from land preparation to transplanting, weeding and harvesting. Specific additional costs of nursery and main plot fertilizer applications were added to these general costs for each treatment combination (). Nursery fertilizer additions generally incur a negligible labour cost of 2 US$ plus rather small fertilizer costs of between 12 and 27 US$, with the exception of compost application (VC: 344 US$). Main plot costs are due to 14 US$ for labour in applying fertilizers and fertilizer costs of between 98 US$ (TSP only) to 310 US$ ha−1 for NPK. When nursery and main plot costs are combined, treatments with nursery application of VC across main plot treatments cost on average 1.6-times more compared to other nursery treatments.
Table 5. Year 2 (2018) total costs for each nursery/field treatments combination for Behenjy 1 and Antohobe fields. NT: nursery treatment, FT: field treatment
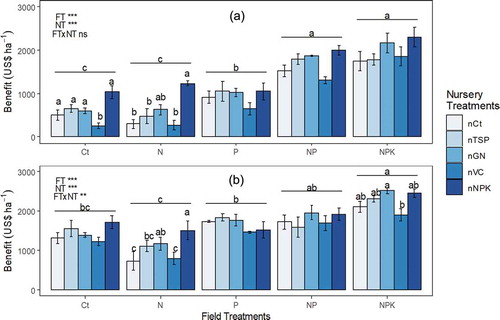
For the calculation of economic benefits of different treatment combinations, we estimated the market value of the harvested rice (0.54 US$ kg−1) and subtracted the cost listed in . Benefits from the farmers practice of not applying any fertilizer to nursery nor main plot (nCt/Ct) amount to 499 US$ ha−1 at Behenjy 2 and that increases to around 2000 US$ ha−1 for the NPK application in the main plot, with the NP treatment being a close second (). In the more fertile Antohobe site, farmers’ practice incurs a benefit of 1320 US$ ha−1 and that almost doubles to about 2200 US$ ha−1 when NPK is applied in the main plot. Nursery applications of fertilizers had minor effects, but application of the expensive compost tended to suppress economic benefits. Surprisingly, sole N application in the main field resulted in overall low economic benefits and that could only be reversed when NPK was applied in the nursery. When nursery treatment effects were analyzed for the main plot farmers’ practice (Ct) alone, nursery NPK treatment increased benefits in the low-fertility site ()), but not in the more fertile site.
Figure 4. Year 2 (2018) benefits (US$ per hectare) affected by nursery and field treatments in Behenjy 2 (a) and Antohobe (b) sites. Values are mean of 4 replicates and error bars represent standard error of mean. Different letters above lines represent significant difference between field treatments. Significant differences between nursery treatments within field treatment are indicated by different letters. NT: nursery treatment, FT: field treatment, NTxFT: interaction nursery and field treatments. ns: not significant, *: p-value < 0.05, **: p-value < 0.01 and ***: p-value < 0.001
Discussion
Most rice in Central Highlands of Madagascar is produced without addition of inorganic fertilizers (> 80%, (Tsujimoto et al., Citation2019)) and average national rice yields are below 3 t ha−1 (USDA, Citation2020). Some intensification is therefore desirable and a main objective of this study was to evaluate fertilizer micro-dosing options in the nursery since this has been reported as effective in studies from Benin and Tanzania (Vandamme et al., Citation2018, Citation2016).
Effects of micro-dosing in the nursery on seedling vigor and final grain yield
Across all three sites the NPK treatment produced by far the most vigorous seedlings. Applying only TSP did not improve seedling growth markedly in contrast to the NPK treatments, suggesting that seedling growth was more limited by N than P. This is likely due to seed reserves of N being exhausted earlier compared to P reserves, coupled with the inability of the soils in the nursery to supply either N or P in sufficient quantities. As a result, the application of P alone (as TSP) had no positive effect on seedling vigour and, surprisingly, only marginal effects on P uptake. Thus, the objective to load seedlings with P as a reservoir to be used for boosting crop growth following transplanting was not achieved by the TSP application. NPK application fulfilled above objective well while locally available sources GM and VC having effects comparable to TSP. NPK supplied seedlings had 90% higher root growth compared to TSP supplied seedlings yet P and N uptake increased by 300% (compared to nTSP; ). Thus, better root growth can only partly explain the high nutrient uptake in NPK supplied seedlings and it is possible that this uptake was also driven by higher demands of more rapidly growing seedlings, at least compared to the equally soluble TSP. In case of organic sources, solubilization rates may have been an additional factor, especially for VC with more than 3-fold higher total N content compared to NPK.
Farmers’ practice in the study area of the central highlands of Madagascar is to not apply any mineral fertilizer to rice (Tsujimoto et al., Citation2019) and one objective of the present study was to evaluate whether a micro-dose of fertilizer to the nursery may offer an entry point to intensification in this system. Considering the consistently positive effect of NPK application on seedling vigour in the nursery and the importance of this trait in transplanted rice (Ros et al., Citation2003; Sarwar et al., Citation2014), we expected carry-over effects on grain yield in the unfertilized main field. However, these were not consistent across sites being low and not significant in Behenjy 1 (+16.4% over the farmer’s practice) () and Antohobe (+25.1% over the farmer’s practice) but rather pronounced in Behenjy 2 (+62.8% over the farmer’s practice) (). Studies conducted elsewhere in Africa (Ros et al., Citation2003; Vandamme et al., Citation2016) reported micro-dosing P to the nursery increased grain yield by 30–40%, which is in the range of the nNPK effects but would contradict the insignificant effect of sole P application seen here. Yet above studies estimated P effects in the comparison on nursery NK vs. NPK application, not the effects of sole P application. It is therefore likely that benefits arose from combined P and N effects similar to the NPK effect reported here.
Application of NPK to the seedling nursery incurs very low costs (27 US$ ha−1, ) yet leads to increased economic benefits compared to current farmers practice by up to 500 US$ (Behenjy 2, ). Even where yield increases were small and not significant, benefits remained positive. The risk associated with nursery NPK applications, therefore, seems negligible while benefits can be substantial and we conclude that nursery application of NPK, but not TSP, is economically recommendable. It is likely that a similar positive effect could be achieved by the nursery addition of Diammonium phosphate (DAP), however NPK offers advantages over DAP in terms of lower cost with 0.6 US$ kg−1 for the first against 0.8 US$ kg−1 for the second one. Locally produced fertilizers were either too costly as in case of VC, or did not show benefits under current farmers practice (GN). Given the low cost of GN, an increase in nursery application rates is feasible and whether these would produce positive grain yield effects should be studied further.
Effects of micro-dosing in the nursery versus fertilization in main field
Our second main objective was to compare micro-dosing in the nursery to macro-dosing fertilizers in the main field. It was obvious that the application of NPK in the main field was the best option across sites in terms of increasing grain yield, as well as in terms of maximizing economic benefits. This is certainly not a novel result as similar fertilizer recommendations have been around for decades. They have more recently been reconfirmed for the Madagascar highlands (PAPRiz, Citation2015). Despite the strong evidence in support of NPK fertilization, farmers have not adopted this technology and in absence of major policy changes making the adoption of fertilizer application a national priority, it is likely that current practices will continue. Relatively high costs and poor availability of sufficient quantities of NPK fertilizers at the local level represent persistent bottlenecks.
For sub-Saharan Africa (SSA), Vandamme et al. (Citation2018) suggested P micro-dosing as an entry point to sustainable intensification for rice. They also reported urea application being common practice for lowland rice in Tanzania. Whether this would be an additional intensification option for Malagasy farmers shall be discussed. The relatively low cost of 116 US$ ha−1 for urea compared to 310 US$ ha−1 for NPK would explain why urea application is often the first intensification option adopted by farmers. However, our results clearly indicate that the application of only N in the main field is neither agronomically nor economically viable because the agronomic efficiency of N application (AEN) was either very low (7.3 kg kg−1, Behenjy 1, ) or even negative. This likely indicates that grain yields were more limited by P than by N and that the delay in heading brought about by N application in the absence of P can even have negative effects on grain yield in the highlands of Madagascar. The low AEN of the urea-only treatment could be improved through nursery NPK application at all three sub-experiments but only in Behenjy 1 did they reach acceptable levels of 20.8 kg kg−1. We therefore conclude that sole urea application is not a sustainable option on highly P deficiency soils in Madagascar, and that if urea is applied, the additional nursery NPK application would be needed as an insurance against the loss from investing in N fertilization. It should be also noted that maximum returns with minimal inputs with micro-dosing to the nursery have a risk of nutrient mining. Thus, while the nursery NPK application with its very low costs can be recommended as an entry point to intensification for rice in the central highlands of Madagascar, longer-term sustainability would require direct nutrient inputs into the main plot and additional low-cost nutrient management options should therefore be considered.
PPS2020_010RP-File008.docx
Download MS Word (184.8 KB)Acknowledgments
This research was supported by the Stable Agricultural Production Program of Japan International Research Center (JIRCAS) and by the Science and Technology Research Partnership for Sustainable Development (SATREPS), Japan Science and Technology Agency (JST)/Japan International Cooperation Agency (JICA) – Grant No. JPMJSA1608.
Disclosure statement
No potential conflict of interest was reported by the authors.
Supplementary material
Supplemental data for this article can be accessed here.
References
- Africa Rice Center (AfricaRice). (2011). Boosting Africa’s Rice Sector: A research for development strategy 2011-2020. Cotonou, Benin: ii+77 pp.
- Akinkunmi, M. A. (2017). Analysis of access to credit and agriculture performance in Sub-Saharan Africa. International Journal of Agricultural Economics, 2(6), 160–164. https://doi.org/10.11648/j.ijae.20170206.11
- Aran, D., Maul, A., & Masfaraud, J.-F. (2008). A spectrophotometric measurement of soil cation exchange capacity based on cobaltihexamine chloride absorbance. Comptes Rendus Geoscience, 340(12), 865–871. https://doi.org/10.1016/j.crte.2008.07.015
- Cordell, D., Drangert, J.-O., & White, S. (2009). The story of phosphorus: Global food security and food for thought. Global Environmental Change, 19(2), 292–305. https://doi.org/10.1016/j.gloenvcha.2008.10.009
- Dogbe, W., Sogbedji, J. M., & Buah, S. S. J. (2015). Site-specific nutrient management for lowland rice in the Northern Savannah Zones of Ghana. Current Agriculture Research Journal, 3(2), 109–117. https://doi.org/10.12944/CARJ.3.2.04
- FAOSTAT. (2019). Food and agriculture organization statistical database, United Nations.
- Julia, C. C., Jeong, K., Rose, T. J., Pariasca-Tanaka, J., Matsuda, T., & Wissuwa, M. (2018). Phosphorus uptake commences at the earliest stages of seedling development in rice. Journal of Experimental Botany, 69(21), 5233–5240. https://doi.org/10.1093/jxb/ery267
- Murphy, J., & Riley, J. P. (1962). A modified single method for the determination of phosphates in natural waters. Analytica chimica acta, 27(1962), 31–36. https://doi.org/10.1016/S0003-2670(00)88444-5
- Nishigaki, T., Tsujimoto, Y., Rinasoa, S., Rakotoson, T., Andriamananjara, A., & Razafimbelo, T. (2019). Phosphorus uptake of rice plants is affected by phosphorus forms and physicochemical properties of tropical weathered soils. Plant and Soil, 435(1), 27–38. https://doi.org/10.1007/s11104-018-3869-1
- PAPRiz. (2015). Main activities and achievements of the rice productivity improvement project in the central highland of Madagascar (PAPRiz) in 2009–2015.
- Rabeharisoa, L., Razanakoto, O. R., Razafimanantsoa, M.-P., Rakotoson, T., Amery, F., & Smolders, E. (2012). Larger bioavailability of soil phosphorus for irrigated rice compared with rainfed rice in Madagascar: Results from a soil and plant survey. Soil Use and Management, 28(4), 448–456. https://doi.org/10.1111/j.1475-2743.2012.00444.x
- Ros, C., Bell, R. W., & White, P. F. (2003). Seedling vigour and the early growth of transplanted rice (Oryza sativa). Plant and Soil, 252(2), 325–337. https://doi.org/10.1023/A:1024736104668
- Saito, K., Vandamme, E., Johnson, J.-M., Tanaka, A., Senthilkumar, K., Dieng, I., Akakpo, C., Gbaguidi, F., Segda, Z., Bassoro, I., Lamare, D., Gbakatchetche, H., Abera, B. B., Jaiteh, F., Bam, R. K., Dogbe, W., Sékou, K., Rabeson, R., Kamissoko, N., Tarfa, B. D., … Wopereis, M. C. S. (2019). Yield-limiting macronutrients for rice in sub-Saharan Africa. Geoderma, 338(2019), 546–554. https://doi.org/10.1016/j.geoderma.2018.11.036
- Sarwar, N., Ali, H., Maqsood, M., Ahmad, A., Ullah, E., Khaliq, T., & Hill, J. E. (2014). Influence of nursery management and seedling age on growth and economic performance of fine rice. Journal of Plant Nutrition, 37(8), 1287–1303. https://doi.org/10.1080/01904167.2014.881490
- Schwertmann, U. (1964). The differentiation of iron oxides in soils by extraction with ammonium oxalate solution. Journal of Plant Nutrition and Soil Science, 105(3), 194–202. https://doi.org/10.1002/jpln.3591050303
- Six, L., Smolders, E., & Merckx, R. (2013). The performance of DGT versus conventional soil phosphorus tests in tropical soils - Maize and rice responses to P application. Plant and Soil, 366(1–2), 49–66. https://doi.org/10.1007/s11104-012-1375-4
- Tsujimoto, Y., Rakotoson, T., Tanaka, A., & Saito, K. (2019). Challenges and opportunities for improving N use efficiency for rice production in sub-Saharan Africa. Plant Production Science, 22(4), 413–427. https://doi.org/10.1080/1343943X.2019.1617638
- USDA. (2020). Production, Supply, and Distribution Online. https://apps.fas.usda.gov/psdonline/app/index.html#/app/compositeViz
- Valluru, R., Vadez, V., Hash, C. T., & Karanam, P. (2010). A minute P application contributes to a better establishment of pearl millet (Pennisetum glaucum (L.) R. Br.) seedling in P deficient soils. Soil Use and Management, 26(1), 36–43. https://doi.org/10.1111/j.1475-2743.2009.00245.x
- Vandamme, E., Ahouanton, K., Mwakasege, L., Mujuni, S., Mujawamariya, G., Kamanda, J., Senthilkumar, K., & Saito, K. (2018). Phosphorus micro-dosing as an entry point to sustainable intensification of rice systems in sub-Saharan Africa. Field Crops Research, 222(2018), 39–49. https://doi.org/10.1016/j.fcr.2018.02.016
- Vandamme, E., Wissuwa, M., Rose, T., Ahouanton, K., & Saito, K. (2016). Strategic phosphorus (P) application to the nursery bed increases seedling growth and yield of transplanted rice at low P supply. Field Crops Research, 186(2016), 10–17. https://doi.org/org/10.1016/j.fcr.2015.11.003
- Walkley, A., & Black, I. A. (1934). An examination of the Degtjareff method for determining soil organic matter, and a proposed modification of the chromic and acid titration method. Soil Science, 37(1), 29–38. https://doi.org/10.1097/00010694-193401000-00003