ABSTRACT
Cowpea is an important low-cost protein source for millions of people in West Africa. Although mature seeds are the primary food source, fresh green pods are also consumed to survive food shortages before the harvest of main cereal crops. To increase protein intake from green pod consumption, a visual indicator of pod elongation, namely relative pod length, which enables the nitrogen content of immature seeds to be estimated, was developed. This is a simple visual method to ascertain the optimal time for green pod harvesting and is therefore highly practical for local farmers, the primary consumers of green cowpea pods. The nitrogen content of immature seeds was estimated using Fourier transform infrared spectroscopy. This method was also applied to genetic resources to select cowpea accessions with high nitrogen content in immature seeds.
Graphical abstract

Introduction
Cowpea (Vigna unguiculata (L.) Walp.) is extensively grown in West Africa as a low-cost and high-quality protein source. Mature cowpea seeds contain 23–32% protein on a dry base (Cruz et al., Citation2014) and thus play an important role in food security for millions of people in economically disadvantaged communities (Jayathilake et al., Citation2018; Tarawali et al., Citation1997). Although cowpea is grown mostly for its edible mature seeds, its green pods with immature seeds are also consumed as a vegetable (Ehlers & Hall, Citation1997; Mortimore et al., Citation1997). In West Africa, consumption of green cowpea pods is important for avoiding famine (Badiane et al., Citation2014; Hall, Citation2012) during food shortages before the harvest of the main cereal crops. However, consumption of green cowpea pods is generally not considered to contribute to human protein intake, because seed nitrogen content peaks during pod maturity (Muchow et al., Citation1993).
Awolumate (Citation1983) reported that nitrogen accumulation in cowpea increased substantially from 10 to 20 days after flowering (DAF), which indicates that protein intake from green pods might be improved by adjusting their harvest time to this increasing phase. DAF is difficult to identify by simple visual observation. As a result, it is not feasible for local farmers to recognize the increasing phase of seed nitrogen content to improve protein intake. In contrast, the use of pod length to estimate pod growth stages via visual observation is more feasible. However, the relationship between pod elongation and seed nitrogen accumulation is poorly understood. The objective of this study was therefore to develop a visual indicator of pod elongation and to clarify the relationship between this indicator and nitrogen accumulation in immature seeds.
In this study, the nitrogen content of immature cowpea seeds was estimated using a Fourier transform infrared (FTIR) spectrometer, which enables high-throughput evaluation compared with the conventional Kjeldahl method (Pampana et al., Citation2016) or the dry combustion method. The nitrogen content of 207 accessions of cowpea genetic resources was estimated via the FTIR technique to select accessions with higher nitrogen content in immature seeds for green pod consumption as ‘vegetable cowpea.’
Materials and methods
Plant material and growth conditions
Two cowpea accessions with different seed protein contents were grown in an experimental field at the International Institute of Tropical Agriculture (IITA) in Ibadan, Nigeria (7°29ʹN, 3°54ʹE). The soil was sandy loam with moderate acidity (pH 5.8–6.2). Soil organic carbon, total nitrogen, and available phosphate contents (according to the Bray-1 method) were 4.3 g kg−1, 0.39 g kg−1, and 3.1 mg kg−1, respectively. Before sowing, machine plowing was performed to uniformize soil conditions in the field. Seeds of TVu456 and TVu2723, low- and high-protein accessions, respectively, were sown in early September 2018 in a 4 m single-line plot with 20 cm interplants on ridges 1.5 m apart. The total number of plants per plot was 21, and each accession had three replications. The total area of the experimental field was 4 × 7.5 m. Weeding was performed manually as required. Fertilizers and irrigation were not applied. The total precipitation, average minimum/maximum temperatures, and average solar radiation during the growing period were 549 mm, 22.6/30.8°C, and 15.2 MJ d−1, respectively. The rainfall pattern was bimodal with a dry spell in early–mid August. Because cowpea was sown with the onset of precipitation in September and harvested in mid-November, i.e., before the dry season, no symptoms of water stress occurred during the growing period. Additionally, the plants did not show any signs of nutritional deficiency or insect damage.
Definition of pod elongation stage
Twenty flowers were randomly selected from different plants of each accession and were tagged with the flowering date. The pod length was recorded every two to three days until full pod maturity was reached. Relative pod length (RPL) was determined as the relative value of pod length at any stage of pod maturity to full pod length. The pod elongation curve represented by the RPL relative to DAF was determined using logistic regression. Coefficients of the regression curve were obtained through hierarchical Bayesian analysis using accession as the hierarchical parameter according to Iseki and Olaleye (Citation2020).
Five pod elongation stages were defined: RPL 0.4–0.6 (stage 1), RPL 0.6–0.8 (stage 2), RPL 0.8–0.95 (stage 3), RPL > 0.95 (immature; stage 4), and RPL > 0.95 (fully mature; stage 5). The end of stage 4 was determined three days after RPL exceeded 0.95. The Bayesian analysis was performed using the statistical software R version 3.4.1 (R Core Team, R, Citation2018) with the package ‘rstan.’
Pod length and seed sampling
After the flowering period, 30 pods were sampled as one bulk sample for each pod elongation stage, and three bulk samples were prepared per stage for both accessions. Total seed number and fresh seed weight were measured for each bulk sample, after which the seeds were oven-dried at 80°C for 24 h to determine the dry weight. This procedure was confirmed through a preliminary experiment in which the seed dry weight was not changed when the sample was oven-dried for more than 24 h. Seed water content of the bulk sample was calculated as (fresh weight – dry weight)/fresh weight × 100 and expressed in percentage. The dried seed samples were then ground into a flour using a mixer mill (MM200, Retsch, Germany) and subjected to FTIR analysis.
Genetic diversity in terms of seed nitrogen content of green pod
A total of 207 accessions from the world cowpea germplasm collection developed at IITA (Fatokun et al., Citation2018) was grown in the same experimental field. Before sowing, machine plowing was performed to uniformize soil conditions in the field. Seeds were sown in early September 2019 in a 2 m single-line plot, with 20 cm interplants. The total number of plants per plot was 11, and each accession had three replications with a randomized block design. The total area of the experimental field was 0.12 ha. Weeding was performed manually as required. Fertilizers and irrigation were not applied. The total precipitation, average minimum/maximum temperatures, and average solar radiation during the growing periods were 609 mm, 22.2/33.9°C, and 13.2 MJ d−1, respectively. No symptoms of water stress, nutrient deficiency, or insect damage were evident during the growing period. In stage 4 of pod elongation, a total of 15 green pods were harvested from the three replications. The total seed number and fresh seed weight were measured for each bulk sample, and the seeds were oven-dried at 80°C for 24 h to determine the dry weight. The seed water content of the bulk sample was calculated as described above. The dried bulk samples were then ground into a flour and subjected to FTIR analysis.
Seed nitrogen content
The seed nitrogen content in each pod elongation stage was estimated from diffuse reflectance spectra of the mid-infrared region (400–7000 cm−1) obtained with an FT-IR6100 spectrometer (JASCO Corporation, Tokyo, Japan) at IITA. The total number of samples was 30, comprising three bulk samples, five pod elongation stages, and two accessions. To calculate seed nitrogen concentration (%), a calibration model for mature seed flour by Muranaka et al. (Citation2015) was expansively applied to the immature seeds. To examine the reliability of this calibration model, the total nitrogen content of 10 samples, comprising five pod elongation stages and two accessions, was measured via the dry combustion method with an elemental analyzer (SUMIGRAPH NC-220 F, Sumika Chemical Analysis Service, Tokyo, Japan). Seed nitrogen content was determined using the following equation: seed nitrogen content (mg nitrogen seed−1) = seed nitrogen concentration (%) × total seed weight of bulk sample (mg)/total seed number of bulk sample. Subsequently, the nitrogen contents obtained through the FTIR and dry combustion methods were compared.
Statistical analysis
One-way analysis of variance was performed to detect statistically significant differences in seed water content, nitrogen content, and dry weight between the accessions. The analyses were conducted using the statistical software R version 3.4.1 (R Core Team, R, Citation2018).
Results and discussion
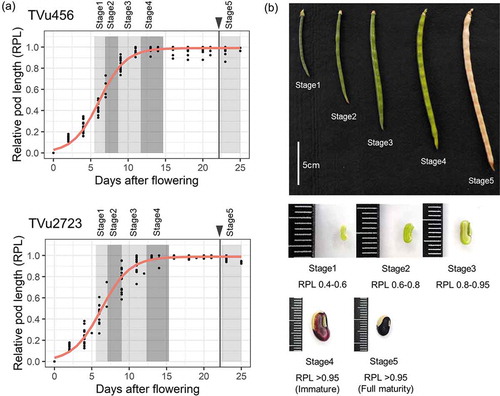
Pod formation and subsequent elongation were initiated within 5 DAF (‘lag phase’), when RPL was less than 0.4 (). During this period, the seeds were less than 2 mm in size (). Pods elongated substantially in the ‘log phase’ 5–9 DAF, and the seeds grew slightly in the pod. This period corresponded to stages 1 and 2. In stage 3 (around 10 DAF), the pod elongation rate started to decrease, and seeds in the pods enlarged. Pod elongation reached the ‘stationary phase’ in stage 4 (13–15 DAF), after which seeds and pods shrank slightly because of dehydration, and matured in stage 5. The pod elongation curves were similar for both accessions, although the maximum pod length in stage 4 was longer for TVu2723 than for TVu456. The time taken to reach full pod maturity after flowering was similar for the two accessions, namely 22.2 and 21.3 days for TVu456 and TVu2723, respectively.
Figure 1. Cowpea-pod growth stages. TVu456 and TVu2723 are low- and high-protein cowpea accessions, respectively. (A) Pod elongation curve relative to days after flowering. Red line represents logistic regression, and black vertical line with triangle represents full maturity. (B) Pod and grain size in each pod growth stage. Photographs of TVu2723 are shown
The trends in seed water content, nitrogen content, and dry weight during pod elongation were same for both accessions (). Seed water content was high (>60%) until stage 3, after which it gradually decreased in stage 4 and dropped sharply as the pod matured after stage 4. Seed dry weight and nitrogen content increased slightly during stages 1–3 and substantially during stages 4–5. This indicated that the protein content of cowpea seeds was low during the pod elongation period and increased greatly after full elongation.
Figure 2. Seed water content, nitrogen content, and dry weight in different cowpea-pod growth stages. Data are means ± standard error for three bulk samples. * and ** represent significant difference between accessions at p = 0.05 and p = 0.01, respectively, and ‘ns’ represents no significance between accessions
From these results, we concluded that RPL can be an effective indicator for detecting the best timing for consuming green pods to optimizing protein intake. The best time to harvest green cowpea pods to ensure maximum protein content was at full maturity. However, harvesting in stage 4 might be another option to improve protein intake, especially under adverse circumstances, such as food shortages. Green pod consumption also contributes to the intake of other nutrients, such as vitamins, which largely decrease before maturity (Deol & Bains, Citation2010; Nielsen et al., Citation1997). Therefore, considering nutrition balance, we recommend that the best time for harvesting green pods for consumption is right after full pod elongation, which corresponds to stage 4.
Although the nitrogen content in stage 5 was significantly higher in TVu2723 than in Tvu456, the opposite was true in stage 4, when nitrogen content was significantly higher in Tvu456 (). This indicated that the nitrogen accumulation rate during pod elongation was not correlated with the final nitrogen content at maturity, and thus the variety with a high nitrogen content in stage 4 was not necessarily a high-nitrogen variety in the mature stage. This might be because the nitrogen accumulation rate depends on the nitrogen sink/source balance in a plant (Gambín & Borrás, Citation2009). The higher nitrogen accumulation rate of TVu456 was attributed to the green leaves being maintained as a nitrogen source during pod maturity, which was related to the longer flowering period of this variety than that of TVu2723 (Iseki et al., Citation2020). On the other hand, the lower final nitrogen content of TVu456 at maturity was attributed to the substantially higher amount of seed per plant than that of TVu2723, which resulted in reduced nitrogen distribution to each seed.
The analyses of the genetic resources revealed large genetic diversity in terms of the nitrogen content of immature green seeds in stage 4 (). The average nitrogen content (mg seed−1) of the 207 accessions was 2.21 ± 0.79 (mean ± SD), the median value was 2.13, and the maximum and minimum values were 4.91 and 0.56, respectively (Supplemental Table 1). In particular, TVu13437, TVu14173, TVu14759, TVu15610, TVU15661, TVu5473, and TVu6855 had high seed nitrogen content (>4 mg seed−1) in stage 4. The seed nitrogen content was not related to seed water content, indicating that the genetic variation in terms of nitrogen content in stage 4 was not related to variations in physiological maturity, i.e., seed dehydration; instead, it was related to varietal characteristics, such as nitrogen mobilization, metabolism, and symbiotic fixation (Cregan & Berkum, Citation1984; Eaglesham et al., Citation1977; Peoples et al., Citation1983).
Figure 3. Genetic variability in terms of seed nitrogen and water content of green cowpea pods in stage 4 of pod growth. Histograms on x- and y-axes indicate distribution of seed water and nitrogen content, respectively. Each point represents one accession and data point. Total of 207 accessions were plotted
Although the FTIR method tended to overestimate the seed nitrogen content in higher nitrogen levels (>4 mg seed−1), the correlation between the FTIR and dry combustion methods was highly significant (). This indicated that the FTIR method developed for mature cowpea seeds (Muranaka et al., Citation2015) could be applied to immature green seeds. The FTIR method is a cost- and time-saving technique that does not require chemical reagents or gases. Therefore, it can be a powerful high-throughput phenotyping tool for cowpea breeders and researchers, especially in developing countries, where timely nitrogen/protein evaluation of genetic resources and crossing lines is crucial in crop breeding.
Figure 4. Relationship between nitrogen content estimated from Fourier transform infrared (FTIR) spectroscopy and dry combustion methods. Dotted line represents regression line. ** indicates statistical significance at p < 0.01
PPS2020_021SR-File006.pdf
Download PDF (107.5 KB)Acknowledgments
We thank Ms. Osisami Oyinda Oluwaseun and Mr. Obanye Chinedu Joseph for technical support during field evaluations, and Ms. Alo Oluwatosin for technical support during seed nitrogen analyses.
Supplemental material
Supplemental data for this article can be accessed here.
Disclosure statement
The authors report no potential conflict of interest.
Additional information
Funding
References
- Awolumate, E. O. (1983). Accumulation and quality of storage protein in developing cowpea, mung bean and soya bean seeds. Journal of the Science of Food and Agriculture, 34(12), 1351–1357. https://doi.org/10.1002/jsfa.2740341206
- Badiane, F. A., Diouf, M., & Diouf, D. (2014). Cowpea. In M. Singh, I. S. Bisht, & M. Dutta (Eds.), Broadening the Genetic Base of Grain Legumes (pp. 95–111). Springer.
- Cregan, P. B., & Berkum, P. (1984). Genetics of nitrogen metabolism and physiological/biological selection for increased grain crop productivity. Theoretical and Applied Genetics, 67(2–3), 97–111. https://doi.org/10.1007/BF00317013
- Cruz, F. J. R., de Almeida, H. J., & Dos Santos, D. M. M. (2014). Growth, nutritional status and nitrogen metabolism in Vigna unguiculata (L.) Walp is affected by aluminum. Australian Journal of Crop Science, 8(7), 1132–1139.
- Deol, J. K., & Bains, K. (2010). Effect of household cooking methods on nutritional and anti nutritional factors in green cowpea (Vigna unguiculata) pods. Journal of Food Science and Technology, 47(5), 579–581. https://doi.org/10.1007/s13197-010-0112–3
- Eaglesham, A. R. J., Minchin, F. R., Summerfield, R. J., Dart, P. J., Huxley, P. A., & Day, J. M. (1977). Nitrogen nutrition of cowpea (Vigna unguiculata): III. Distribution of nitrogen within effectively nodulated plants. Experimental Agriculture, 13(4), 369–380. https://doi.org/10.1017/S0014479700008127
- Ehlers, J. D., & Hall, A. E. (1997). Cowpea (Vigna unguiculata L. Walp.). Field Crops Research, 53(1–3), 187–204. https://doi.org/10.1016/S0378-4290(97)00031-2
- Fatokun, C., Girma, G., Abberton, M., Gedil, M., Unachukwu, N., Oyatomi, O., Boukar, O., Rabbi, I., & Boukar, O. (2018). Genetic diversity and population structure of a mini-core subset from the world cowpea (Vigna unguiculata (L.) Walp.) germplasm collection. Scientific Reports, 8(1), 16035. https://doi.org/10.1038/s41598-018-34555-9
- Gambín, B. L., & Borrás, L. (2009). Resource distribution and the trade-off between seed number and seed weight: a comparison across crop species. Annals of Applied Biology, 156(1), 91–102. https://doi.org/10.1111/j.1744-7348.2009.00367.x
- Hall, A. E. (2012). Phenotyping cowpeas for adaptation to drought Frontiers in Physiology,3, 155. https://doi.org/10.3389/fphys.2012.00155
- Iseki, K., & Olaleye, O. (2020). A new indicator of leaf stomatal conductance based on thermal imaging for field grown cowpea. Plant Production Science, 23(1), 136–147. https://doi.org/10.1080/1343943X.2019.1625273
- Iseki, K., Olaleye, O., & Ishikawa, H. (2020). Intra-plant variation in seed weight and seed protein content of cowpea. Plant Production Science, 23(1), 103–113. https://doi.org/10.1080/1343943X.2019.1677161
- Jayathilake, C., Visvanathan, R., Deen, A., Bangamuwage, R., Jayawardana, B. C., Nammi, S., & Liyanage, R. (2018). Cowpea: An overview on its nutritional facts and health benefits. Journal of the Science of Food and Agriculture, 98(13), 4793–4806. https://doi.org/10.1002/jsfa.9074
- Mortimore, M. J., Singh, B. B., Harris, F., & Blade, S. F. (1997). Cowpea in traditional cropping systems. In B. B. Singh, D. R. Mohan Raj, K. E. Dashiell, & L. E. N. Jackai (Eds.), Advances in Cowpea Research (pp. 99–113). International Institute of Tropical Agriculture (IITA) and Japan International Research Center for Agricultural Sciences (JIRCAS).
- Muchow, R. C., Robertson, M. J., & Pengelly, B. C. (1993). Accumulation and partitioning of biomass and nitrogen by soybean, mungbean and cowpea under contrasting environmental conditions. Field Crops Research, 33(1–2), 13–36. https://doi.org/10.1016/0378-4290(93)90092-2
- Muranaka, S., Shono, M., Manjula, K., Takagi, H., & Ishikawa, H. (2015). Application of near to mid-infrared spectroscopy to estimation of grain nitrogen content in cowpea (Vigna unguiculata) grown under multiple environmental conditions. Journal of Biological and Food Science Research, 4(2), 16–24.
- Nielsen, S. S., Ohler, T. A., & Mitchell, C. A. (1997). Cowpea leaves for human consumption: Production, utilization, and nutrient composition. In B. B. Singh Raj, D. R. Mohan, K. E. Dashiell, & L. E. N. Jackai (Eds.), Advances in Cowpea Research (pp. 326–332). International Institute of Tropical Agriculture (IITA) and Japan International Research Center for Agricultural Sciences (JIRCAS).
- Pampana, S., Masoni, A., & Arduini, I. (2016). Grain legumes differ in nitrogen accumulation and remobilisation during seed filling. Soil and Plant Science, 66(2), 127–132. https://doi.org/10.1080/09064710.2015.1080854
- Peoples, M. B., Pate, J. S., & Atkins, C. A. (1983). Mobilization of nitrogen in fruiting plants of a cultivar of cowpea. Journal of Experimental Botany, 34(5), 563–578. https://doi.org/10.1093/jxb/34.5.563
- R Core Team, R. (2018). A language and environment for statistical computing. R Foundation for Statistical Computing. https://www.R-project.org
- Tarawali, S. A., Singh, B. B., Peters, M., & Blade, S. F. (1997). Cowpea haulms as fodder. In B. B. Singh, D. R. Mohan Raj, K. E. Dashiell, & L. E. N. Jackai (Eds.), Advances in Cowpea Research (pp. 313–325). International Institute of Tropical Agriculture (IIA) and Japan International Research Center for Agricultural Sciences (JIRCAS).