 ?Mathematical formulae have been encoded as MathML and are displayed in this HTML version using MathJax in order to improve their display. Uncheck the box to turn MathJax off. This feature requires Javascript. Click on a formula to zoom.
ABSTRACT
To evaluate soybean performance in response to high night temperature (HNT), a soybean cultivar, Fukuyutaka, was grown in 2 years under different night temperatures on a mini field in a temperature gradient chamber (TGC) at Kyoto, Japan. The average night temperature ranged from 21.7°C to 23.9°C and from 20.3°C to 22.8°C in 2017 and 2018, respectively. An additional experiment was conducted using a phytotron observing the same cv. under NT as high as 28°C (extreme HNT) and the control at 22 C from a R1 to R6.5 period. In the TGC yield tended to decline by 4.6% per °C when the results from the 2 years were combined. The responses of yield components tended to offset and the harvest index did not respond to varying NT. And thus the decrease in yield by HNT resulted from the change in biomass. The reduction of biomass was attributable more to branch growth than to main stem and more to leaf growth thant to other organs. Leaf area and leaf weight showed responses to NT as convex curves, suggesting that HNT may inhibit leaf growth. Reduction of biomass was more evident by extreme HNT in the phytotron. Pn was not significantly affected by HNT in TGC. The estimated maintenance respiration (Rm) increased with HNT but it seemed to explain the biomass response to HNT only partially. The results suggested that the growth and yield of soybean are potentially affected by increased NT through a negative impact on biomass production caused by multiple factors.
GRAPHICAL ABSTRACT
Introduction
Soybean [Glycine max (L.) Merr.] is one of the most important crops in the world. With climate change, the average temperature is predicted to increase by 1.0°C to 3.7°C by the end of this century (IPCC, Citation2014). The night temperature will be more impacted by climate change than the daytime temperature (Peng et al., Citation2004). Since national temperature recordkeeping began in 1985, the global average daily minimum temperature has increased by 0.8°C per century, compared to the increase in the daily maximum temperature by 0.4°C per century (NOAA, Citation2018).
Previous studies have suggested that the optimum air temperature for seed number and biomass production is approximately 25°C based on analysis of 15 years of field data in soybean (Uchikawa et al., Citation2003). This result indicates that an increase in temperature may result in a decline in soybean development and yield. In rice, yield decreased by 11% when NT rose from 22°C to 34°C (Morita et al., Citation2002), but rice yield increased by 12% when NT rose from 22°C to 32°C (Cheng et al., Citation2009). The result of Mohammed and Tarpley’s study (Mohammed & Tarpley, Citation2009) shows that yield is negatively influenced by HNT (27°C -> 32°C). Gibson and Mullen (Citation1996) also found a similar result in soybean when NT increased from 20°C to 30°C.
In previous studies, HNT influenced the yield in many crops, such as rice and soybean, by affecting their reproductive development, but the results are not consistent. In rice, a field experiment showed that the spikelet number declined at 23.7°C compared with the number at 22°C (Y. Zhang et al., Citation2013). This is in accordance with the result from Peng et al. (Citation2004). In soybean, Gibson and Mullen (Citation1996) discovered that pod number and seed number increased under HNT during the seed filling stage. In the study of Djanaguiraman et al. (Citation2013), when NT increased from 20℃ to 29℃, the pod set and pollen germination decreased significantly. In contrast, the pod set and seed number increased but the seed size decreased in another study (NT 20℃→30℃, Zheng et al., Citation2002). Therefore, the impact of HNT on reproductive development was still inconsistent among different crops and experimental conditions and depended on NT.
Another factor influencing yield performance is biomass. Y. Zhang et al. (Citation2013) found that yield decline resulted from a decrease not only in the yield components but also in biomass under HNT. Morita et al. (Citation2002) and Peng et al. (Citation2004) also reported that biomass was reduced by HNT under growth chamber and field conditions. Therefore, biomass may be one factor related to yield decrease under HNT. At the physiological level, HNT caused a decrease in biomass, which may result from lower N-fixation (Shiraiwa et al., Citation2006) and photosynthetic rates and higher respiration.
In previous studies, the photosynthetic functions were affected by high temperatures (HT). Lower CO2 assimilation results from lower PSII efficiency were found under HT (Yin et al., Citation2010). However, the response was inconsistent and unclear. The decrease in the photosynthesis rate occurred in soybean, sorghum, spring wheat, cotton and rice (Djanaguiraman et al., Citation2013; 22C/28C; Prasad & Djanaguiraman, Citation2011; 14C/23C; Prasad et al., Citation2008; 20C/30C; Snider et al., Citation2009; 24C/30C; Alvarado-Sanabria et al., Citation2017), but the photosynthesis rate increased in rice and Populus spp. (17C/27C, Kanno et al., Citation2009; 15C/25C; Turnbull et al., Citation2002), and no significant influence was found on the photosynthesis rate in rice (Mohammed & Tarpley, Citation2009). Prasad and Djanaguiraman (Citation2011) reported that the negative effects of HNT on the photosynthetic rate may result in the acceleration of leaf senescence, decreasing the starch and nonstructural carbohydrate conversion, and that this was associated with increasing thylakoid membrane damage and nonphotochemical quenching (Al-Khatib & Paulsen, Citation1984; Prasad & Djanaguiraman, Citation2011). Therefore, the lower photosynthesis rate can be considered an important factor related to the impact of HNT on biomass and yield performance in rice (You et al., Citation2017) and soybean (Bahuguna et al., Citation2017).
On the other hand, respiration is also related to NT. The respiration rate increases when plants are under HT compared with that under the optimum growth temperature (Hopkins, Citation1999). Dry weight accumulation has been related to the higher respiration rate caused by HNT. When NT increases, the excessive consumption of carbohydrates results in biomass decrease in corn (Hoeft et al., Citation2000). The increase in respiration rate also occurred in soybean and rice under HNT (Alvarado-Sanabria et al., Citation2017; Djanaguiraman et al., Citation2013; Mohammed & Tarpley, Citation2009). Although the results showed a negative correlation between respiration rate and HNT, its association with crop growth, yield components and physiological response in soybean under HNT has not been fully evidenced.
From an agronomical point of view, the effect of heat stress under extreme HNT was apparent but did not necessarily correspond to the potential change in environmental conditions in this century. It is necessary to organize a study evaluating a moderate increase in NT to estimate the potential impacts of climate change, as well as short-term extreme events, because the results can provide useful information on soybean production in the future. Therefore, this study was conducted to clarify the effect of moderate HNT on soybean yield and physiological function. The relationship between yield and its components and HNT during the reproductive growth stages in soybean was examined, and crop physiological parameters that represent plant response were identified. In this study, soybean growth was treated with increased air temperatures during the night using a temperature gradient chamber (TGC) to mimic field conditions.
Materials and methods
Plant material and growth conditions
Experiments were conducted in a temperature gradient chamber (TGC) from July to October 2017 and July to November 2018, and an experiment was conducted under controlled environment by a natural-light phytotron from September to November 2019 at Kyoto University, Kyoto Japan (lat. 35°03ʹ N). Cultivar Fukuyutaka, a leading commercial cultivar in western Japan classified into maturity group V, was used in both the TGC and phytotron experiments. The TGC, 2.5 m in width and 25 m in length with a mini-field of 1.5 m x 22 m for soil culture, created an almost linear temperature gradient along its longitudinal axis from the ambient temperature to a temperature that was several degrees higher, maintaining the natural diurnal changes in air temperature (Horie et al., Citation1995). The soil in the TGC was sandy loam alluvial soil (fluvic endoaquepts). Seedlings grown on a plastic nursery tray for 6 days were transplanted in four rows at a spacing of 40 × 40 cm in the mini-field. Two TGCs were used as replicates. The mini-field in each TGC was longitudinally divided into three temperature plots. Temperature and relative humidity recorders (RTR-503, T and D corporation) were set at the front, end and middle; therefore, each sampling point could be interpolated. In the phytotron, 64 pots were used for the treatment and control. The soils in both the TGC field and the pots for the phytotron study were fertilized before transplanting with N (3 gm−2), P2O5 (10 gm−2) and K2O (10 gm−2) in the forms of urea, calcium superphosphate, and potassium chloride, respectively. For photosynthesis measurements in the TGC, 64 pots in the same condition as those in the phytotron experiment were grown under ambient conditions and moved at the R1 stage into the TGC (16 pots at the highest-temperature and 16 pots at the lowest-temperature positions in the 2 TGCs). Irrigation and pest control were applied as necessary to optimize growth conditions.
The soybean developmental stage was recorded following Fehr and Caviness (Citation1977). In the TGC experiment, HNT treatment started from R1 and continued until R7. In the treatment period, the temperature gradient was created from 18:00 to 6:00 by delivering warmed air with the heater, which was controlled to keep the air temperature at f4℃ higher than the ambient temperature, with the side windows on both sides closed. In the daytime, the heaters were shut down, and the inside temperature was kept as uniform as possible and close to the ambient temperature by keeping the side windows of the TGC fully open. In the phytotron experiment, two chambers were used as the extremely highNT treatment (extreme HNT) and control. The extreme HNT treatment was set up at approximately 28℃ during the night (18:00–6:00), and the daytime temperature was maintained at 30℃. The control phytotron was kept at 30/22C for the day/night temperatures. The treatment began from R1 and continued until R6.5 stage.
Agronomical traits and yield components
The samples were harvested at R1, R5, 3 weeks after R5 (R5 + 3 w), and at late seed filling at R6.5 in 2017 and at R7 in 2018. In the phytotron plants were harvested at R1, R5 and R6.5 in 2019. The plant organs were separated into leaf, petiole, stem, pod and seed for biomass determination. At the R1, R5 and R5 + 3 w stages (TGC only), 4 plants were collected per plot, 6 plants (TGC) and 8 plants (phytotron) were collected at late seed filling. The Scar number and pod number were counted at last sampling for yield component analysis. All of the plants were separated into their different organs and oven dried at 80℃ for 48 h. Each organ was weighed, and the total aboveground biomass (TDW) was calculated. In addition, the belowground parts were collected only from the TGC from an area of 15 by 15 cm and a soil depth of 20 cm to obtain a rough estimate of the top to root ratio (T/R ratio). The leaf area was measured at the R5 stage by a LI-3000 area meter (LI-COR, USA). At the late seed filling stage (only for TGC, R6.5 in 2017 and R7 in 2018), the yield components, node number, pod number, seed number and harvest index (HI) were determined. The estimated yield at R8 was calculated by multiplying the complete seed number measured at R6.5 in 2017 or R7 in 2018 by the single seed weight measured only for 5 to 10 selected plants at the R8 stage.
Plant material and growth conditions
Leaf photosynthesis
The uppermost fully expanding leaf of the main stem was used to determine the leaf photosynthesis rate (Pn) and calculate fluorescence parameters (Fv/Fm, NPQ) using a photosynthesis measurement system (LI-COR 6800, Lincoln, Nebraska, USA). In the TGC experiment, 16 pots were placed at the end position of the TGC (HNT) and the entrance of the TGC (ambient) for the two TGCs. Photosynthesis traits were measured for four plants randomly chosen at six times between R1 and 60 days after R1. During the photosynthesis measurements, the conditions in the leaf chamber were set at 30℃, 1500 μmol m−2s−1 of photosynthetically active radiation (PAR) and 400/500 ppm (TGC/phytotron) of CO2 supply by the CO2 injection system. Plants were placed in a dark room for more than 8 h to determine the fluorescence parameter (F0). Then, Pn and other parameters were recorded after photosynthesis was induced and reached its maximum value in the TGC experiments.
Maintenance respiration estimation
The night-time maintenance respiration (Rmest.-NT) was based on the definition by McCree (Citation1974). The daily Rm during the night was estimated using an exponential model with the following equation:
where 1/2 is the night-time period in 1 day; W is the absolute biomass; Rm0 is the maintenance coefficient of respiration (mg g−1 d−1) at a reference temperature (T0) of 25℃, which was assumed to be 8 according to Katsura et al. (Citation2009) and Ito (Citation2019); Q10 had a value of 2.0 and is the fractional increase or decrease in respiration rate per 10℃ change in temperature; and T is the average night temperature for a given day (C). The amount of carbohydrates (CH2O) used by night-time respiration was estimated by calculating the daily Rm in each temperature plot and summing the Rm values for the treatment period.
Data analysis
The effect of HNT on various crop variables at the plant and physiological levels was subjected to regression analysis, analysis of variance (ANOVA) and analysis of covariance (ANCOVA). The least significant difference (LSD) among the means was statistically analyzed.
Results
Environment conditions and crop phenology
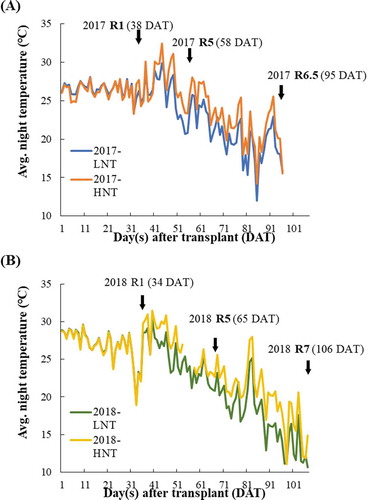
Thermal treatments increased the average NT at the end of the TGC to approximately 2.5℃ higher than that at the entrance of the TGC to form the temperature gradient. However, the temperature during treatment was entirely lower in 2018 than in 2017, and the solar radiation varied between the 2 years. The air temperature gradient was from 21.7℃ to 23.9℃ in 2017 and from 20.3℃ to 22.8℃ in 2018. The daily NT change was shown in . The average NT during R1-R5 in 2017 was near 1℃ higher than in 2018, and around 4℃ higher from 3 weeks after R5 (Suppl. Table 1). The sum of solar radiation during HNT treatment was 869.0 MJ m−2 d−1 in 2017 and 881.8 MJ m−2 d−1 in 2018. The vapor pressure deficit showed no significant difference between HNT and control in both the TGC and phytotron. The crop cycle was divided into three phases: the vegetative stage and reproductive stage, comprising R1-R5, and R5-R7. There was no significant difference in the length of the vegetative phase between the 2 years. Nevertheless, in 2017, soybean plants reached R5 at 23 days after the R1 stage (), while in 2018, they reached R5 late, at 31 days after R1 (), and in 2019, soybeans reached R5 at 20 days after R1 in the phytotron.
Figure 1. Change in air temperature in 2017 (a) and 2018 (b) The orange/yellow line indicates the highest NT compared with blue/green line which represents lowest NT in 2017/2018. The solid arrows indicate the phenological phases from transplanting to last sampling
Symptoms of nematodes (Caenorhabditis elegans) occurred at late seed filling. Although the symptom was not severe, we avoided any possible influence of the damage on the experimental results, especially on biomass production, the last in-season sampling was conducted just before R7 (at R6.5) in 2017. Increased night temperature negligibly shortened the growing cycle in both years, but the difference was not significant.
Yield, biomass and yield components under HNT
In the TGC experiment, yield was affected by HNT treatment differently in 2 years. The yield declined entirely under HNT in 2017 with a linear trend (R2 = 0.56, P = 0.02), with an average 38% lower yield at 23.9℃ NT than at 21.7℃ (ambient) (). In 2018, however, the association between NT and yield was not significant (R2 = 0.10, P = 0.28), although the average at 22.8℃ NT was 7% lower than at 20.3℃ (ambient) (). In the phytotron in 2019, the seed weight at R6.5 stage tended to be lower with extreme HNT of 28℃ than with control NT of 22℃ (P = 0.20) (). The aboveground biomass was also affected by HNT in a similar way as yield; aboveground biomass was reduced by 250 gm−2 in 2017 under moderate HNT compared to that at ambient temperature (), while, in 2018, this result was not found (). The aboveground biomass declined in 209 gm−2 under extreme HNT in the phytotron in 2019 ().
Figure 2. Yield and biomass (TDW) performances as affected by average NT from R1 to R6.5 (2017) or R7 (2018). (a) R8-estimated yield in 2017, (b) R8-estimated yield in 2018, (c) relative yield in 2017 and 2018, (d) TDW in 2017, (e) TDW in 2018 and (f) relative TDW in 2017 and 2018. The relative yield/TDW is calculated with the value at a NT of 22C as standard (100). The estimated yield at R8 was calculated by multiplying the complete seed number measured at R6.5 in 2017 or R7 in 2018 by the single seed weight at R8
Figure 3. TDW and yield performances as affected by control and extreme HNT from R1 to R6.5 in phytotron (2019). Entire bar including white and gray boxes indicates biomass (TDW), the gray box indicates seed dry weight (SW)
The results in TGC from 2 years are combined () in terms of relative value setting the value at 22℃ as standard (100). This procedure was needed, because the time of yield measurement was different between the 2 years and hence the values are different between them due to different durations of growth assessment. When results of 2 years are combined, both the yield and aboveground biomass tended to decline as HNT was higher. Among the yield components, the results showed an increasing tendency in node number in both years (34.1% and 8.8% increase in 2017 and 2018, ), while pod set per scar number was negatively affected by 20.8% loss compared to ambient temperatures in 2017 and no change in 2018 under HNT. The other components were unaffected. The resultant pod/seed number per m2 tended to increase with HNT, but this tendency was offset by the opposite trends in 100-seed weight, with a 4.9% loss only in 2018 (.c)). Hence, the harvest index did not respond to varying NT (), and the decrease in yield by HNT resulted from the change in biomass. The T/R ratio also showed a decreasing tendency in both years ().
Figure 4. Relationship between change in yield components and average NT from R1 to R6.5 (2017) or R7 (2018); node number per total dry weight (a), pod set (Pod number/Scar number) (b 100-seed weight (c), and harvest index (d)
Figure 5. Relationship between the ratio of aboveground biomass per root biomass (T/R ratio) and average NT from R1 to R6.5 (2017) or R7(2018)
Biomass of different plant parts
Variation of TDW in both years was significantly (P < 0.05) associated with the biomass of branch stems but was not with the biomass of main stems (data not shown). The differences relative to the regressed value at optimum NT (22℃) in the main stem and branch DW showed that the branch biomass declined by 9.0% in 2017 and by 0.4% in 2018 per C increased in NT under HNT. However, no significant difference was found in the main stem biomass in both years. These results suggest that branch DW decreased with HNT, but main stem DW did not () which is reflected in the TDW. In the phytotron study, the extreme HNT caused biomass decrease not only in branch but also in main stem. The branch biomass declined by 8.5% and that in main stem by 4.9% per C when NT increased from 22℃ to 28℃ ().
Figure 6. Effect of average NT on dry weight of main stem (a) and branch (b) in TGC (2017 and 2018), in terms of relative value to those at standard NT (22C); (c) indicates main stem(gray box)/branch (white box) TDW performances as affected by control and extreme in phytotron (p < 0.001, 2019)
A multiple regression analysis was performed by assessing the contributions of leaf, petiole, pod, seed and stem to the decrease in branch biomass across the HNT treatment. The results showed that only leaf weight was significantly associated with a decrease in branch biomass (a = 91.7, R2 = 0.69, P < 0.01). Therefore, the change in the total aboveground biomass was explained by the decrease in the branch leaf weight.
The association between main stem and branch leaf area in the 2 years in TGC and at the different NTs during the period from R1 to R5 is shown in . The branch leaf area was associated with NT in a convex curve regression (R2 = 0.340), but there was no particular tendency with NT in the main stem. According to the results, an average NT during R1 to R5 of approximately 26℃ seemed to be optimal for producing a high leaf area index; temperatures lower or higher than 26℃ caused a decrease in LAI. However, extreme HNT also caused a tendency of lower leaf area both in branch and main stem, with low level of significance. In contrast, at 3 weeks after the R5 stage, leaf dry weight in both the branch and main stem showed inconsistent trends with night temperature (R2 = 0.006, 0.124) (). Leaf dry weight was potentially affected by HNT from R1 to R5 when new leaves are produced, though it was not clear after R5. The association between leaf dry weight and LA showed highly related in both sampling period (R2 from 0.72 to 0.99, data not shown).
Figure 7. Main stem and branch leaf area index at R5 stage (a) and leaf dry weight (b) from 2017 and 2018 by increasing NT. The white diamond, black diamond, white square and black square represent branch leaf area in 2017, branch leaf area in 2018, main stem leaf area in 2017 and main stem leaf area in 2018, respectively
Leaf photosynthesis and maintenance respiration
In the TGC experiment, in which HNT was applied during the reproductive stage, the results were somewhat scattered. The Pn was lowered by HNT 30 days after R1 (third measurement) but increased 50 days after R1 (fifth measurement) compared to the Pn at ambient temperatures (). The fluorescence parameters Fv/Fm and NPQ were evaluated, but there was no significant difference between HNT and the control (ambient conditions) in either the phytotron or the TGC studies.
Figure 8. Time series data on leaf photosynthetic rate measured in the TGC study in the reproductive stage at the ambient end (Low night temperature, LNT1, LNT2, white square and diamond) and the HNT end (HNT1, HNT2, black square and diamond) in the 2 TGCs. The black arrow represents the beginning of the HNT treatment
The night-time Rm was estimated by an exponential model with a Q10 value of 2.0. Different contributions were observed between the 2 years. The sum of the estimated Rm during the NT treatment in 2018 was consistently higher than that in 2017 due to the longer growth stages. The average night-time Rm per day was also evaluated, and the result showed a 9.6% increase in Rm per 1℃ increase in NT (). The ratio of Rm consumption per aboveground biomass loss ranged from 5.4% to 61.4% if only positive values were considered. Comparing the difference of the total estimated carbon waste between highest and lowest NT, the results revealed that the loss of carbohydrates was responsible for approximately 33.4% of the biomass reduction caused by increased night temperatures.
Figure 9. Average night-time maintenance respiration consumption per day estimated by an exponential model with Q10 of 2, a fixed maintenance coefficient, and daily biomass in 2017 and 2018 under varied average NT
Discussion
The relative effects of HNT on growth and physiological processes in soybean are still unclear. Therefore, the present study was conducted to evaluate the effect of increased night temperature on the yield and associated traits of soybean. HNT tended to decrease yield (). The yield decline under HNT has been observed in chamber and field-level studies for rice (Alvarado-Sanabria et al., Citation2017; Mohammed & Tarpley, Citation2009, Citation2010; Peng et al., Citation2004; Y. Zhang et al., Citation2013) and in a phytotron study of the combination of high daytime and night temperatures for soybean growth (Gibson & Mullen, Citation1996). In this study, node number, pod set, and 100-seed weight were also affected, but there was no significant change in HI; that is, the yield decrease did not result from a change in any particular yield component but from an overall decline in TDW under HNT. This kind of complementary change in yield components was also observed in a previous soybean study. Gibson and Mullen (Citation1996) found that pod and seed numbers were increased under HNT, though the seed size decreased, and thus the seed yield was not affected. In addition, HNT stimulated flower opening and pod setting on the secondary and tertiary racemes and caused an increase in pod number and seed numbers, but the seed size declined, resulting in unchanged yield and HI (Zheng et al., Citation2002).
The dry weight at late filling stage of branch leaves was more affected by HNT than the dry weight of main stem leaves under moderate and extreme HNT. This result is similar to that observed in quinoa under HNT (Jurka & Calderini, Citation2017). The fact that branch leaf growth was influenced by HNT more easily than main stem leaf growth may be partly because, in our study, HNT treatment was started at approximately R1 and branch development occurs later than main stem development. The accumulation of dry weight during R1 to R5 occurs more in branches than in the main stem; therefore, HNT caused a decline of growth in branches in the early reproductive stage. Branch growth is generally more sensitive to environmental stresses than main stem growth, as has been suggested under drought conditions (Frederick et al., Citation2001). Leaf development and growth affected by HT stress were found in rice (Khalatbari et al., Citation2014) and maize (Cicchino et al., Citation2010). A decreased LAI before R5 may reduce radiation interception with concomitant reductions in biomass accumulation. In this study, a convex curve response to moderate HNT was observed when the 2 years of data were combined for LAI at R5. That is, temperatures higher or lower than the optimum NT at approximately 26℃ may negatively affect LAI development. Another possibility is that the lower LAI under HNT could be explained by a shortened crop cycle duration. Under HT, the development rate was increased and resulted in a decline in biomass and grain yield (Fischer & Maurer, Citation1976). Similar evidence was also found in wheat (García et al., Citation2015). This response is different from that found in the TGC study, which showed no significant difference in phenology between the temperature treatments.
Increased NT caused either negative or positive change in the photosynthetic rate in the TGC study. The average NT in the TGC was dynamic and decreased in the later season, causing a different average NT at each sampling time. At the third and fifth sampling times, the different average NTs resulted in low or higher photosynthetic rates than those of the control (). Hence, over some critical value, the night temperature might affect photosynthetic ability. At the third measurement in the TGC, the HNT was 27.1℃ and 28.6℃ in the HT treatment compared with 24.9℃ and 25.3℃ at the control. In contrast, at the fifth measurement, the average NT decreased by approximately 2℃, and the HNT was 25.7℃ and 26.6℃, which was an optimal level compared with that of the control at 23.0℃ and 23.9℃. At the third measurement, lower Pn was observed when the average NT was higher than approximately 27℃, but the result was opposite (low Pn activity) when the average NT was lower than 24℃. Therefore, the optimum average NT for Pn was between 24℃ and 27℃. In the previous study, photosynthesis under heat stress (day and night) was decreased because of lower associated enzyme activity (Salvucci & Crafts-Brandner, Citation2004; Takeda et al., Citation1995), few electron transporters (Wise et al., Citation2004) and excess excitation energy (Hideg et al., Citation2008). It was observed that the chlorophyll content, Photosystem II quantum efficiency, photosynthetic rate, and yield were decreased under HNT in soybean (Djanaguiraman et al. Citation2011) and cotton (Snider et al., Citation2009). Djanaguiraman et al. (Citation2013) also observed that HNT of 29℃ decreased the photochemical quenching and electron transport rate compared with the optimum NT of 20℃. Similar results were also found in sorghum, in which lower chlorophyll content was due to reactive oxygen species (ROS) stress, which damaged the thylakoid membrane and resulted in lower electron transport efficiency (Prasad & Djanaguiraman, Citation2011). However, the effect of HNT on the photosynthetic rate is still inconsistent among crops; a similar effect was found in winter wheat (Prasad et al., Citation2008) but no influence of HNT on the photosynthetic rate was found in rice (Mohammed & Tarpley, Citation2009). Likewise, in our study, the photosynthetic rate was decreased at a certain sampling time by HNT, but no significant difference was found in NPQ or Fv/Fm between HNT and the control. Describe other associating factor, gs or A/Ci. The lower photosynthetic rate response under HNT might not be the result of ROS stress, or ROS damage may occur in particular genotypes, crops and temperatures under heat stress.
The estimated maintenance respiration was computed with daily biomass by an exponential model with a Q10 value of 2 that gives two times higher respiration when the temperature is raised by 10℃ during the growth period (McCree, Citation1974; Penning de Vries et al., Citation1989; Atkin and Tjoelker, Citation2003). The result showed that estimated respiration was increased not only by higher NT but also by longer growth duration. Mohammed and Tarpley (Citation2009), Zheng et al. (Citation2002), Peraudeau et al. (Citation2015), and Alvarado-Sanabria et al. (Citation2017) observed that night respiration increased under NTs over 27℃. It was also pointed out that HNT affected the maintenance respiration rate and potentially decreased biomass accumulation and crop yield (Hatfield et al., Citation2011; Welch et al., Citation2010). In crop productivity, excess respiration limits carbon availability and increases the consumption of carbohydrates to maintain growth metabolism. A maintenance respiration coefficient (Rm0) of 8 mg g−1 d−1 at 25℃ was employed for calculating Rm, which was derived from a study by Ito (Citation2019) . The assumed value for m0 is different depending on the crop, growth period and genotype. For example, the value of m0 ranged from 10 to 20 mg g−1d−1 or from 10 to 30 mg g−1d−1 in the vegetative organ of rice (Hirai et al., Citation1997; Katsura et al., Citation2007; Penning de Vries & van Laar., Citation1982). Previous studies have also reported that plant nitrogen concentration has a strong effect on m0 and growth conversion efficiency (McCree, Citation1974; Hirai et al., Citation1997). The higher nitrogen content leads to a higher m0 value (Katsura et al., Citation2007). Nevertheless, the nitrogen content decreased by HNT in this study may also cause lower maintenance respiration, but the difference in nitrogen concentration between different NTs was significant but not obvious. Therefore, the nitrogen content was a minor factor affecting the Rm compared with NT and biomass in this estimation.
In TGC study, the decreasing trend in yield and biomass response in 2017 under HNT was not obvious in 2018 (). In view of change of TDW by time (Suppl. ), the TDW and leaf weight difference was increased after R5 in 2017, but not significant in 2018. These results may suggest that the NT treatment in 2018 was entirely lower than that in 2017, ranging from 22.8℃ to 20.3℃ in 2018 as compared to the range from 23.9℃ to 21.7℃ in 2017. Particularly the temperature was lower in late period of treatment (, Sup. 1). The lower solar radiation in 2018 and lower NT may be the main reason to cause the different phenology and responses between 2 years. Hatfield and H. Prueger (Citation2015) observed that increased NT significantly increased the rate of senescence and maturity, which was earlier than that in normal NT by 15 days in maize. This was similar to phytotron study result, but not the case in TGC study, earlier R6 stage was observed in extreme HNT in 2019, but no any significantly different in TGC in both years. This could be a consequence of using a moderate NT treatment as the highest NT in our study was 23.9℃, rather than an extreme treatment (NT = 28℃).
In conclusion, the results suggest that an increase in NT over 20.3℃ imposed during the reproductive stage can lead to a reduction in yield of approximately 4.6% per C in the mimic field condition. Also yield decreased by 5.1% per C under extreme HNT from 22℃ to 28℃. This yield reduction was mainly due to a change in biomass, which was caused mainly by a reduction in branch biomass. Photosynthetic rate analysis suggested that photosynthetic activity potentially declines when the average NT exceeds 27℃. Higher NT leads to an increase in the respiration rate, and its impact on the decline of biomass was estimated to be up to 43 gm−2, accounting for less than 20% of the decline. This study suggested a potential decline in soybean productivity under HNT through some physiological processes, but to fully understand the mechanism, further study remains necessary.
PPS2020_072RP-File013.tif
Download TIFF Image (51.8 KB)PPS2020_072RP-File012.tif
Download TIFF Image (52.2 KB)Acknowledgments
Financial support was provided by Hualien District Agricultural Research and Extension Station COA, Taiwan (R.O.C.). This work was also financially supported by the Ministry of Agriculture, Forestry and Fisheries, Japan through a research project entitled “Development of technologies for mitigation and adaptation to climate change in Agriculture, Forestry and Fisheries.„
Disclosure statement
No potential conflict of interest was reported by the authors.
Supplementary Material
Supplemental data for this article can be accessed here.
References
- Al-Khatib, K., & Paulsen, G. M.. (1984). Mode of high temperature injury to wheat during grain development. Physiologia Plantarum, 61(3), 363–368. https://doi.org/10.1111/j.1399-3054.1984.tb06341.x
- Alvarado-Sanabria, O., Gabriel, G., & Hermann, R. D. (2017). The effects of night-time temperatures on physiological and biochemical traits in rice. Notulae Botanicae Horti Agrobotanici Cluj-Napoca, 45(1), 157. https://doi.org/10.15835/nbha45110627
- Atkin O.K., & Tjoelker M.G. (2003). Thermal acclimation and the dynamic response of plant respiration to temperature. Trends in Plant Science, 8(7), 343–351.
- Bahuguna, R. N., Solis, C. A., Shi, W., & Jagadish, K. S. (2017). Post-flowering night respiration and altered sink activity account for high night temperature-induced grain yield and quality loss in rice (Oryza sativa L.). Physiologia Plantarum, 159(1), 59–73. https://doi.org/10.1111/ppl.12485
- Cheng, W., Sakai, H., Yagi, K., & Hasegawa, T. (2009). Interactions of elevated [CO2 </sub>] and night temperature on rice growth and yield. Agricultural and Forest Meteorology, 149(1), 51–58. https://doi.org/10.1016/j.agrformet.2008.07.006
- Cicchino, M., Rattalino Edreira, J. I., Uribelarrea, M., & Otegui, M. E. (2010). Heat stress in field-grown maize: Response of physiological determinants of grain yield. Crop Science, 50(4), 1438–1448. https://doi.org/10.2135/cropsci2009.10.0574
- Djanaguiraman, M., Prasad, P.V.V., Boyle, D.L. & Schapaugh, W.T. (2011). High temperature stress and soybean leaves: leaf anatomy and photosynthesis. Crop Science, 51(5), 2125–2131. http://doi.org/10.2135/cropsci2010.10.0571
- Djanaguiraman, M., Prasad, P. V. V., & Schapaugh., W. T. (2013). High day- or night-time temperature alters leaf assimilation, reproductive success, and phosphatidic acid of pollen grain in soybean [Glycine max (L.) Merr.]. Crop Science, 53(4), 1594–1604. https://doi.org/10.2135/cropsci2012.07.0441
- Fehr, W. R., & Caviness, C. E. (1977). Stages of soybean Development-Special Report 80, (pp. 1–12). Iowa State University
- Fischer, R. A., & Maurer, R. O. (1976). Crop Temperature Modification and Yield Potential in a Dwarf Spring Wheat 1. Crop Science, 16(6), 855–859. https://doi.org/10.2135/cropsci1976.0011183X001600060031x
- Frederick, J., Camp, C., & Bauer, P. (2001). Drought-stress effects on branch and mainstem seed yield and yield components of determinate soybean. Crop Science, 41(3), 759. https://doi.org/10.2135/cropsci2001.413759x
- García, G. A., Dreccer, M. F., Miralles, D. J., & Serrago, R. A. (2015). High night temperatures during grain number determination reduce wheat and barley grain yield: A field study. Global Change Biology, 21(11), 4153–4164. https://doi.org/10.1111/gcb.13009
- Gibson, L. R., & Mullen, R. E. (1996). Soybean seed composition under high day and night growth temperatures. Journal of the American Oil Chemists’ Society, 73(6), 733–737. https://doi.org/10.1007/BF02517949
- Hatfield, J., & H. Prueger, J. (2015). Temperature extremes: Effect on plant growth and development. Weather and Climate Extremes, 10(PA), 4–10. https://doi.org/10.1016/j.wace.2015.08.001
- Hatfield, J. L., Boote, K. J., Kimball, B. A., Ziska, L. H., zaurralde, I. R. C., Ort, D., Thomson, A. M., & Wolfe., D. W. (2011). Climate impacts on agriculture: Implications for crop production. Agronomy Journal, 103(2), 351–370. https://doi.org/10.2134/agronj2010.0303
- Hideg, E., Péter, B. K., & Ulrich, S. (2008). Imaging of NPQ and ROS formation in tobacco leaves: Heat inactivation of the water–water cycle prevents down-regulation of PSII. Plant Cell Physiology, 49(12), 1879–1886. https://doi.org/10.1093/pcp/pcn170
- Hirai, Y., Ehara, H., & Tsuchiya, M. (1997). Growth respiration in rice organs as affected by nitrogen content. Japanese Journal of Crop Science, 66(4), 640–646. https://doi.org/10.1626/jcs.66.640
- Hoeft, R. G., Nafziger, E. D., Johnson, R. R., & Aldrich, R. (2000). Modern corn and soybean production, (pp. 353). MCSP Publications.
- Hopkins, W. G. (1999). Introduction to plant physiology. (2nd ed., pp. 107). Wiley.
- Horie, T., Nakagawa, H., Nakano, J., Hamotani, K., & Kim, H. Y. (1995). Temperature gradient chambers for research on global environment change. III. A system designed for rice in Kyoto, Jpn. Plant Cell Environment, 18(9), 1064–1069. https://doi.org/10.1111/j.1365-3040.1995.tb00618.x
- IPCC. 2014. Intergovernmental panel on climate change fourth assessment report: Climate change. World Meteorological Org.
- Ito H., (2019). Biomass productivity of high-yielding soybean UA4910 from the aspect of carbon balance in the canopy. MS thesis, Kyoto university.
- Jurka, L., & Calderini, D. (2017). Increased night temperature negatively affects grain yield, biomass and grain number in chilean quinoa. Frontiers in Plant Science, 8, 352. https://doi.org/10.3389/fpls.2017.00352
- Kanno, K., Mae, T., & Makino, A. (2009). High night temperature stimulates photosynthesis, biomass production and growth during the vegetative stage of rice plants. Soil Science and Plant Nutrition, 55(1), 124–131. https://doi.org/10.1111/j.1747-0765.2008.00343.x
- Katsura, K., Maeda, S., Horie, T., & Shiraiwa, T. (2007). Analysis of yield attributes and crop physiological traits of Liangyoupeijiu, a hybrid rice recently bred in China. Field Crops Research, 103(3), 170–177. https://doi.org/10.1016/j.fcr.2007.06.001
- Katsura, K., Maeda, S., Horie, T., & Shiraiwa, T. (2009). Estimation of respiratory parameters for rice based on long-term and intermittent measurement of canopy CO2 exchange rates in the field. Field Crops Research, 111(1–2), 85–91. https://doi.org/10.1016/j.fcr.2008.11.003
- Khalatbari, A., Karbalaei, M., Yusop, M., Chand, O. F., Jaafar, H., Khalatbari, A., Kharidah, S., & Hanafi, M. (2014). Effects of heat stress on growth of rice cultivars. Conference: International agriculture conference. At Pullman, Lakeside, Putrajaya, Malaysia.
- McCree, K. J. (1974). Carbon balance as a function of plant size in sorghum plants. Crop Science, 26(6), 1173–1177. https://doi.org/10.2135/cropsci1983.0011183X002300060034x
- McCree, K. J. (1974). Equations for the rate of dark respiration of white clover and Grain Sorghum, as Functions of dry weight, photosynthetic rate, and temperature 1. Crop Science, 14, 509–514. 4 https://doi.org/10.2135/cropsci1974.0011183X001400040005x
- Mohammed, A. R., & Tarpley, L. (2009). High night-time temperatures affect rice productivity through altered pollen germination and spikelet fertility. Agricultural and Forest Meteorology, 149(6), 999–1008. https://doi.org/10.1016/j.agrformet.2008.12.003
- Mohammed, A. R., & Tarpley, L. (2010). Effects of high night temperature and spikelet position on yield-related parameters of rice (Oryza sativa L.) plants. European Journal of Agronomy, 33(2), 117–123. https://doi.org/10.1016/j.eja.2009.11.006
- Morita, S., Shiratsuchi, H., Takanashi, J., & Fujita, K. (2002). Effect of high temperature on ripening in rice plants: Comparison of the effect of high night temperature and high day temperatures. Japanese Journal of Crop Science, 71(1), 102–109. https://doi.org/10.1626/jcs.71.102
- NOAA. 2018. National oceanic and atmospheric administration global climate report – Annual. Department of Commerce. U.S.A. https://www.ncdc.noaa.gov/sotc/global/201813
- Peng, S., Huang, J., Sheehy, J., Laza, R., Visperas, R., Zhong, X., Centeno, G., Khush, G., & Cassman, K. (2004). Rice yields decline with higher night temperature from global warming. Proceedings of the National Academy of Sciences of USA, 101(27), 9971–9975. https://doi.org/10.1073/pnas.0403720101
- Penning de Vries, F. W. T., Jansen, D. M., Ten Berge, H. F. M., & Bakema., A. (1989). Simulation of ecophysiological processes of growth in several annual crops (Simulation Monographs). Pudoc.
- Penning de Vries, F. W. T., & Van Laar, H. H. (1982). Simulation of plant growth and crop production. Centre for Agricultural Publishing and Documentation, Pudoc.
- Peraudeau, S., Roques, S., Quiñones, C. O., Fabre, D., Rie, J. V., Ouwerkerk, P. B. F., Jagadish, K. S. V., Dingkuhn, M., & Lafarge, T. 2015. Increase in night temperature in rice enhances respiration rate without significant impact on biomass accumulation. Field Crops Research, 171, 67–78. https://doi.org/10.1016/j.fcr.2014.11.004
- Prasad, P. V. V., & Djanaguiraman, M. (2011). High night temperature decreases leaf photosynthesis and pollen function in grain sorghum. Functional Plant Biology, 38(12), 993–1003. https://doi.org/10.1071/FP11035
- Prasad, P. V. V., Pisipati, S. R., Ristic, Z., Bukovnik, U., & Fritz, A. K. (2008). Impact of night-time temperature on physiology and growth of spring wheat. Crop Science, 48(6), 2372–2380. https://doi.org/10.2135/cropsci2007.12.0717
- Saini, H. S., Sedgley, M., & Aspinall, D. (1983). Effect of heat stress during floral development on pollen tube growth and ovary anatomy in wheat (Triticum aestivum L.). Australian Journal of Plant Physiology, 10(2), 137–144. https://doi.org/10.1071/PP9830137
- Salvucci, M. E., & Crafts-Brandner, S. J. (2004). Inhibition of photosynthesis by heat stress: The activation state of Rubisco as a limiting factor in photosynthesis. Physiologia Plantarum, 120(2), 179–186. https://doi.org/10.1111/j.0031-9317.2004.0173.x
- Shiraiwa, T., Makoto, S., Yoshinori, Y., & Takeshi, H. (2006). Nitrogen fixation and seed yield in soybean under moderate high-temperature stress. Plant Production Science, 9(2), 165–167. https://doi.org/10.1626/pps.9.165
- Snider, J. L., Oosterhuis, D. M., Skulman, B. W., & Kawakami, E. M. (2009). Heat stress-induced limitations to reproductive success in Gossypium hirsutum. Physiologia Plantarum, 137(2), 125–138. https://doi.org/10.1111/j.1399-3054.2009.01266.x
- Takeda, T., Yokota, A., & Shigeoka, S. (1995). Resistance of photosynthesis to hydrogen peroxide in algae. Plant Cell Physiology, 36(6), 1089–1095. https://doi.org/10.1093/oxfordjournals.pcp.a078852
- Turnbull, M. H., Murthy, R., & Griffin, K. L. (2002). The relative impacts of daytime and night-time warming on photosynthetic capacity in Populus deltoids. Plant Cell Environment, 25(12), 1729–1737. https://doi.org/10.1046/j.1365-3040.2002.00947.x
- Uchikawa, O., Fukushima, Y., & Matsue, Y. (2003). Statistical analysis of soybean yield and meteorological conditions in the northern Kyushu. Japanese Journal of Crop Science, 72(2), 203–209. https://doi.org/10.1626/jcs.72.203
- Welch, J. R., Vincent, J. R., Auffhammer, M., Moya, P. F., Dobermann, A., & Dawe, D. (2010). Rice yields in tropical/subtropical Asia exhibit large but opposing sensitivities to minimum and maximum temperatures. Proceedings of the National Academy of Sciences of USA, 107(33), 14562–14567. https://doi.org/10.1073/pnas.1001222107
- Wise, R. R., Olson, A. J., Schrader, S. M., & Sharkey, T. D. (2004). Electron transport is the functional limitation of photosynthesis in field-grown Pima cotton plants at high temperature. Plant Cell Environment, 27(6), 717–724. https://doi.org/10.1111/j.1365-3040.2004.01171.x
- Yin, Y., Li, S., Liao, W., Lu, Q., Wen, X., & Lu, C. (2010). Photosystem II photochemistry, photoinhibition, and the xanthophyll cycle in heat-stressed rice leaves. Journal of Plant Physiology, 167(12), 959–966. https://doi.org/10.1016/j.jplph.2009.12.021
- You, C., Chen, L., He, H., Wu, L., Wang, S., Ding, Y., & Ma, C. (2017). iTRAQ-based proteome profile analysis of superior and inferior spikelets at early grain filling stage in japonica rice. BMC Plant Biology, 17(1), 100. https://doi.org/10.1186/s12870-017-1050-2
- Zhang, Y., Tang, Q., Peng, S., Zou, Y., Chen, S., Shi, W., Qin, J., & Laza, M. R. C. (2013). Effects of high night temperature on yield and agronomic traits of irrigated rice under field chamber system condition. Australian Journal of Crop Science. 7(1), 7–13. http://www.cropj.com/zhang_7_13_2013_7_13.pdf
- Zheng, S. H., Nakamoto, H., Yoshikawa, K., Furuya, T., & Fukuyama, M. (2002). Influence of high night temperature on flowering and pod setting in soybean. Plant Production Science, 5(3), 215–218. https://doi.org/10.1626/pps.5.215