 ?Mathematical formulae have been encoded as MathML and are displayed in this HTML version using MathJax in order to improve their display. Uncheck the box to turn MathJax off. This feature requires Javascript. Click on a formula to zoom.
ABSTRACT
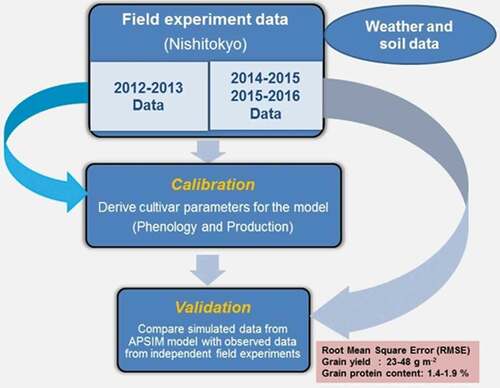
The self-sufficiency ratio and national average yield of wheat are low in Japan. Reducing the yield gap and receiving the government subsidy for grain quality are vital strategies for profitability. Elucidating optimum nitrogen application scheme is awaited to attain both higher yield and appropriate grain protein content (GPC) for wheat cultivation in Japan. Such decision support can be realized by integrating field experimental knowledge to crop growth models, although they have scarcely been utilized for wheat production in Japan. Therefore, the purposes of this study were to apply a widely used crop growth model (APSIM) to wheat growth on an Andosol in the Kanto region in Japan by calibration and validation. Selected model parameters of APSIM-wheat for phenology, leaf growth, and grain formation were readjusted based on the phenology and growth data of soft and hard wheat cultivars. Then the model was validated by using similar variables obtained in an independent experiment. For the simulation of the optimum sowing for winter wheat in the Kanto area (November), the root mean square error for grain yield was 23 and 48 g m−2 for Ayahikari and Yumeshiho varieties, respectively, and that for GPC was 1.9 and 1.4%. Thus, the overall model performance was acceptable for optimum sowing. However, grain yield and dry matter production were significantly overestimated when the data of late sowing groups were included. Therefore, further model improvement was suggested to add an algorithm to reduce the number of emerged plants under cold temperature in late sowing conditions.
Graphical abstract
Introduction
Understanding the complicated interactions between crop, soil and climate is vital to make decisions on agronomic practices including nitrogen fertilizer management towards achieving higher yield and appropriate grain protein concentration for wheat in Japan. Although Japan is endowed with favourable wheat-growing conditions with sufficient annual precipitation (840–2800 mm), the national average yield (4.1 t ha−1) is lower than that in other major wheat-producing countries in Europe, such as France, Germany, and the United Kingdom (7.4, 8.6, and 8.6 t ha−1, respectively). Thus, the self-sufficiency ratio of wheat in Japan is only 13.3% (Food and Agriculture Organization of the United Nations, Citation2014), although wheat is the second most important cereal in Japan following rice. In the last decade, the per capita consumption of wheat increased by 4.1% while that of rice decreased by 11% (USDA Foreign Agricultural Service, Citation2017).
To increase the self-sufficiency of wheat in Japan, the Japanese government offers a subsidy for wheat production in the form of a ‘quality bonus’ based on its grain-quality indices. Wheat varieties in Japan are classified into two groups – hard wheat (used for bread) and soft wheat (used for Japanese noodle), depending on the grain quality (mainly protein content) (Nakano et al., Citation2008). The required grain protein content (GPC) for hard and soft wheat are 11.5–14% and 9.7–11.3%, respectively (Ministry of Agriculture, Forestry and Fisheries, Japan, MAFF, Citation2014). Wheat producers in Japan can obtain the highest quality bonus when GPC falls into these ranges. In other countries such as the United States also, the premium price for wheat is determined based on GPC (Olmos et al., Citation2003).
It has been widely reported that wheat GPC is influenced by the climate, cultivar, the rate and timing of nitrogen (N) application, seeding density, soil fertility, and their interactions (Garrido-Lestache et al., Citation2004; Gauer et al., Citation1992; López-Bellido et al., Citation2005; Nakano & Morita, Citation2009; Nakano et al., Citation2008; Rao et al., Citation1993; Sato et al., Citation1992). In addition, a negative genetic correlation between grain yield and GPC has been reported (Asseng & Milroy, Citation2006; Fowler, Citation2003; Kibite & Evans, Citation1984; Loffer et al., Citation1985; Selles & Zentner, Citation2001; Triboi et al., Citation2006; Triboi & Triboi-Blondel, Citation2002), which makes it challenging to increase yield while maintaining GPC within the target range (Triboi et al., Citation2006).
Recent researches have indicated that GPC can be controlled by N application at the flowering stage, while N application at the stem-elongation stage affects the grain yield (Bly & Woodard, Citation2003; Fischer et al., Citation1993; Knowles et al., Citation1994; Nakano & Morita, Citation2009; Peltonen, Citation1993; Rawluk et al., Citation2000; Rutkowska, Citation2009; Shimazaki & Watanabe, Citation2010; Stark & Tindall, Citation1992; Takayama et al., Citation2006; Woolfolk et al., Citation2002; M. Yoshida et al., Citation2008; Zebarth & Sheard, Citation1992). However, the effectiveness of split N application at flowering for improving GPC depends on the soil type, and therefore, the control of GPC solely by split N application is difficult (Karathanasis et al., Citation1980; Nakatsuji, Citation2003; Sato et al., Citation1992; De Silva et al., Citation2018).
Volcanic ash soils, among the major soil types in Japan (Nanzyo, Citation2002; Shoji & Takahashi, Citation2002), are important soils for wheat production in Japan. The upland fields in the Kanto area, the third-largest wheat-growing area in Japan, are largely covered by volcanic ash soils. The native nitrogen-supplying capacity in volcanic ash soils is higher than that in other soils, and is further enhanced by the application of N fertilizers that stimulates mineralization of the native soil nitrogen (Eneji et al., Citation2002).
From these reasons, a comprehensive decision support system for nitrogen management is awaited. Developing such a decision support system is difficult with the knowledge from the field experiments alone due to the site- and season-specificity of the results of field experiments (Ellen & Spiertz, Citation1980; Spiertz & Ellen, Citation1978; Spiertz & Van de Haar, Citation1978).
Therefore, the use of crop growth models is a promising alternative. Previous reports also emphasized the use of crop growth models to optimise management practices under variable environments (Asseng et al., Citation1998, Citation2000). But to draw recommendations based on a crop model, the model should be properly adjusted and evaluated for the local varieties and environmental conditions.
APSIM (the Agricultural Production Systems Simulator) is one of such crop growth models successfully utilised to simulate wheat growth (e.g. Asseng et al., Citation2000; Gaydon et al., Citation2011; Mohanty et al., Citation2012; Wang et al., Citation2013; Zhang et al., Citation2012). However, the use of crop growth models for decision support in wheat production in Japan is scarce and the APSIM model has not been used so far in Japan for such researches. Therefore, the purpose of this study is to adjust the model parameters for local varieties and conditions (calibration) and to evaluate the simulation results by comparing them with the data from the field (validation) for the APSIM model for the growth of hard and soft varieties of wheat in Kanto region in Japan to prepare the model to be used for decision support for increasing wheat productivity through optimum N managements.
Materials and methods
APSIM Model
APSIM (Agricultural Production Systems sIMulator) is one of the comprehensive cropping system models enabling to simulate systems that cover a range of plant, animal, soil, climate and management (Keating et al., Citation2003). In APSIM, various modules can be connected/detached flexibly to attain certain purposes of the simulation. For this research version 7.5 was used, mainly with the modules such as ‘Plant’, ‘SoilWat2’ and ‘SoilN’. ‘SoilWat2’ calculates the content and availability of water at different soil layers taking the various processes such as precipitation, runoff, evaporation, percolation, etc. into account based on the physical characteristics of the soil. ‘SoilN’ works with three carbon compartments of the soil (fresh organic matter, biomass carbon and humus carbon), and calculate N flows among these pools based on the C/N ratio of each pool. Then the balance and availability of N of each layer are determined on daily basis. It also counts other N process such as mineralization/immobilization, denitrification, leaching loss, too. Generic ‘Plant’ module, used for wheat growth for this research, simulates leaf area growth, and then calculates daily biomass production driven by solar radiation. Then the distribution of carbohydrate to plant organs including grain is calculated based on the predetermined specific genotypic parameters to determine the yield. At the same time, the ‘Plant’ module simulates the lengths of different growth stages and determines the phenology based on the set of parameters for the target cultivar.
In APSIM, water availability in the soil layers, actual water absorption by plant, and water potential affect leaf growth and photosynthesis. And in a similar way, N stress is applied to biomass accumulation, leaf appearance and expansion, and grain filling in the current version of the model. N stress on grain filling in turn affects the biomass demand of grain (carbon ‘sink’ strength) and the N demand of grain.
Field experiment data used for model calibration (parameterisation) and validation
All field experiments were conducted at the Institute for Sustainable Agro-Ecosystem Services (ISAS) (35º44ʹN, 139º32ʹE) of the University of Tokyo at Nishitokyo City in Tokyo. It is located in Kanto plain where the volcanic ash soil is classified as Typic Melanudands by USDA soil taxonomy, or Andosols by FAO soil classification dominates in upland fields.
A summary of the experimental data used for this study is listed in . The published data for season 2012–2013 (De Silva et al., Citation2018) were used for calibration (we used Nov 8 sowing group data as the baseline for the calibration process), and unpublished authors’ own data for 2014–2015 and 2015–2016 were used for validation. The dates for emergence, 50% flowering and physiological maturity were recorded by field observation. Dry weight and grain yield were obtained after drying the plant sample at 80°C for 72 h. Leaf area index (LAI) was measured at flowering by leaf area meter (Li-Cor LI-3100 C, Lincoln, USA). GPC was analysed by measuring nitrogen (N) content by dry combustion method (FlashEA 1112NCS, Thermo Fisher Scientific, MA, US) and multiplying it by a factor of 5.7.
Table 1. Summary of the field experiments used in the model calibration and validation
Model calibration
Daily weather data (maximum and minimum temperatures, solar radiation, and precipitation) were obtained from a weather station at the experimental location. The soil parameters such as bulk density; volumetric water content at saturated water content, drained upper limit, and lower limit; soil organic carbon content and soil pH were obtained from De Silva et al. (Citation2018). NO3− and NH4+ concentrations at the start of the experiment for 0–10, 10–40, 40–70 cm were measured in October 2014 (). The data for the additional two layers (70–100, 100–130 cm) were set by referring to the data of other similar soils in the APSIM standard soil data set. The initial proportions of soil carbon pools ‘Fbiom’ (soil microbial biomass fraction) and ‘Finert’ (organic carbon fraction which does not decompose) were set by comparing the simulated and observed dry matter at flowering in zero nitrogen treatment (Gaydon et al., Citation2012). No surface residue was assumed as it was the soil conditions at the sowing. Initial soil water content was set arbitrarily to 70% of the available water content (between LL and DUL) filled from the top. Sensitivity analyses confirmed that this value, together with other soil data of additional soil layers, did not affect the simulation results significantly. The same soil data set was used for both calibration and validation.
Table 2. Soil nitrogen, pH and organic carbon content (OC) at the time of sowing and Fbiom and Finert obtained after the adjustment of the plant production in zero nitrogen treatment (for 0–10 and 10–40 and 40–70 soil layers)
Sowing density, sowing depth and row spacing were set to 300 plants m−2, 25 mm and 190 mm, respectively based on the field experiment (2012–2013) for calibration. For the validation, separate APSIM simulations were run with settings of each year’s sowing and nitrogen management conditions.
For the cultivar parameters (genotypic coefficients), the phenological parameters (for dates of flowering and physiological maturity) were calibrated first, and then the growth parameters (for aboveground dry matter, LAI, etc.) were, calibrated in sequence as below. Calibration was conducted with the trial and error method by matching the simulated and observed variables (Wang et al., Citation2013) which is usually employed for APSIM that does not have a specific program for calibration.
Phenological parameters
First, the ‘photoperiod sensitivity’ (photop_sens) and ‘vernalisation sensitivity’ (vern_sens) were adjusted to minimize the difference between observed and simulated flowering dates. Wang et al. (Citation2013) also started deriving cultivar parameters with photop_sens and vern_sens. Before deriving these parameters the ‘time lag before linear coleoptile growth starts’ (shoot_lag units) was modified by the observed emergence date.
Secondly, ‘thermal time from emergence to end of juvenile stage’ (tt_end_of_juvenile) and ‘thermal time requirement from the beginning of grain filling to maturity’ (tt_start_grain_fill) were adjusted to match the simulated dates of flowering and maturity with the observed ones.
Plant growth parameters
‘Maximum specific leaf area’ (y_sla_max) was adjusted to improve the LAI simulation, and ‘maximum grain size’ (max_grain_size) and ‘grain growth rate during grain filling’ (potential_grain_filling_rate) were adjusted to match the simulated grain yield to the observed one. And because ‘grains per gram stem’ (grains_per_gram_stem) is the parameter that can be directly estimated using field experimental data, the only available measured data in 2014–2015 were used with the assumption that it does not change from year to year.
Model validation
For the validation, separate APSIM simulations were run for each year’s sowing and nitrogen management conditions using the calibrated model. Observed and simulated variables were compared graphically. Further, model performance was evaluated with statistical indices widely used: root mean square error (RMSE), relative root mean square error (RRMSE), slope (m) of a best-fit regression line forced through the origin, and modelling efficiency (ME) (EquationEquation 1(1)
(1) ) (Asseng et al., Citation1998, Citation2000; Chen et al., Citation2010; Gaydon et al., Citation2011; Mohanty et al., Citation2012; Wang et al., Citation2013; Wu et al., Citation2013; Zhang et al., Citation2012).
Model accuracy was evaluated as very good if RRMSE <10%, good if 10% < RRMSE < 20%, fair if 20% < RRMSE < 30% and poor if RRMSE > 30% (Jamieson et al., Citation1991; Magaia et al., Citation2017).
The slope of the best-fitted regression line forced through the origin (m) expresses the possible over- or under-estimation. The modelling efficiency (ME) compares the deviations between predicted and observed values to the variance of the observed values. ME = 1 denotes a perfect match of the predicted and observed values and ME = 0 indicates that the model predictions are merely as accurate as of the means of the observed data. ME less than zero (- ∞ < ME < 0) occurs when the observed mean is a better predictor than the model. ME values between 0 and 1 are generally regarded as acceptable levels. Model performance can be evaluated as satisfactory if ME > 0.5, good if ME > 0.65 and, very good if ME > 0.75 (Chen et al., Citation2010).
Model performance was tested across all sowing dates for phenology. Grain yield, GPC, dry matter production and LAI were tested for two datasets separately: one for optimum sowing conditions only, and one for all sowing groups including early and late sowing conditions.
Results
Model calibration
The results of the calibration for both phenological and plant growth parameters are listed in .
Table 3. Phenological parameter values obtained for both cultivars
Table 4. Adjusted parameter values for each cultivar to attain better simulation results for LAI, dry matter production and grain yield
After the calibration, simulated dry matter at flowering, that at maturity, grain yield, LAI and GPC were comparable to the observed values and were in the range of 787.1–1046, 778.9–1201, 324.2–608.6, 2.1–3.3 and 10–15.8 for Yumeshiho and 765–973, 764–1191, 318.8–636.3, 1.8–2.8, 10.5–15.3 for Ayahikari respectively. (Supplementary ).
Model validation
Validation for phenology
Model-predicted number of days to flowering and maturity fitted well to those of the observed ones across early, standard and late sowing conditions (). RMSE of two cultivars ranged from 1.5 to 4.9 days for flowering and from 0.7 to 6.5 days for maturity (). RMSE was consistently higher in 2015–2016 than in 2014–2015 for both cultivars. RRMSE was lower than 10% for both the days to flowering and maturity, and ME was close to one, confirming the good model performance ().
Table 5. Indices of model performance for plant phenology across all sowing date groups
Figure 1. Simulated and observed number of days from sowing to flowering (a, c) and to maturity (b, d) in 2014–2015 and 2015–2016 for Yumeshiho (a, b) and Ayahikari (c, d). Each data point represents different sowing group. The continuous line is 1:1 line
Validation results for grain yield, GPC, dry matter production and LAI
The observed grain yield varied between 87 and 468 g m−2 for Ayahikari and, between 99 and 517 g m−2 for Yumeshiho due to the different range of N supply (from 0 to 160 kg N ha−1) ( a, f). APSIM model simulated the grain yield satisfactorily with an agreement between observed and simulated values for both cultivars for optimum sowing. However, when the validation was conducted across all sowing groups including late sowings, model performances were reduced. Most of the late sowing data points were significantly above the 1:1 line indicating that the model overestimated the yield in late sowing conditions. RMSE values for grain yield simulation were 121.5 g m−2 for Ayahikari and 113.1 g m−2 for Yumeshiho ().
Table 6. Summary of APSIM validation for Kanto area in Japan for growth parameters. (With the data from all sowing groups)
Figure 2. Simulated and observed grain yield, GPC, dry matter production at flowering and maturity, and LAI for Ayahikari (a,b,c,d,e) and Yumeshiho (f,g,h, i,j) in 2014–2015, and 2015–2016 for all sowing groups. The continuous line is 1:1. Different type of symbols represent different sowing groups (♦14-Nov (optimum), ∎28 Nov, ◊10-Dec, □24-Dec in 2014; and ▴23-Oct, •13-Nov (optimum), ∆4-Dec, ∘22-Dec in 2015)
The observed GPC varied between 10.1 and 16.8% for Ayahikari and, between 11.0 and 17.9% for Yumeshiho. Model could simulate relatively well the variation of observed GPC in response to the wider range applied N for both cultivars ( b, g). However, as shown in the model tends to slightly underestimate GPC for Yumeshiho particularly for the late sowing group. The RMSE of GPC was 1.9% in Ayahikari and 2.5% in Yumeshiho (). The RRMSE was 14.6% and 17.4% in Ayahikari and Yumeshiho, respectively.
As shown in (c, h, d, i), dry matter production at maturity (except for some data points) relatively fitted closer one to one line with optimum sowing data but the model overestimated when the data of late sowing groups were included. On the other hand, the predicted dry matter at flowering was largely overestimated irrespective of the sowing groups.
When only optimum sowing data were used, there was a good fitness between simulated and observed LAI at flowering ( e, j). However, when late sowing data were also included in the validation, model performances were reduced. RMSE of LAI at flowering was 0.6 for Ayahikari and 0.9 for Yumeshiho ().
Thus, the results showed that the model performance generally decreased when the data of late sowing conditions were included. The goodness of fitness reduced and RMSE increased for almost all of the growth parameters concerned ( and ). In general, the simulation results overestimated the total dry matter at flowering/maturity and yield, for both varieties, while underestimated GPC mainly in Yumeshiho.
Model performances for estimating soil nitrate concentration
The model could capture the observed soil nitrate dynamics at the topsoil layer in both years of validation (). The observed range of soil NO3 was 3.9–40.3 g kg−1. Model error was 2.18 g kg−1 (RMSE) and 0.94 for ME ().
Figure 3. Simulated and observed soil NO3− at 0–30 cm soil depth during 2014–2015 and 2015–2016 cropping seasons. The measurement was taken from zero N plots (a), and N applied plots (160 kg N ha−1 per season; 120 kg N ha−1 at sowing and 40 kg N ha−1 at stem elongation stage) (b). Arrows denote date of split N application at stem elongation stage
Discussion
Model calibration
The optimum sowing time for winter wheat in the Kanto area in Japan is regarded to be November. Results of the 2012–13 field experiment used for the calibration also showed that November 8 sowing produced the highest yields, i.e. Ayahikari and Yumeshiho achieved 606 g m−2 and 619 g m−2, respectively at the highest nitrogen application rate (150 kg N ha−1) (De Silva et al., Citation2018). Thus, we used Nov 8 sowing group data as the baseline for the calibration process.
Of the phenology parameters, the obtained vernalization sensitivity (= 2) indicates low vernalization requirement, implying that these cultivars are rather a spring type. H. Yoshida et al. (Citation2001) and Kiribuchi-Otobe et al. (Citation2009) also indicated that Yumeshiho and Ayahikari are spring varieties with a low degree of winter habit although they are usually used as winter wheat in the region. After setting phenology parameters, overall simulation capability of the model for phenology was improved across early, mid and late sowing groups of both cultivars (Supplementary ).
After the phenology calibration, calibration for the growth-related parameters was conducted. Asseng et al. (Citation1998), (Citation2000)) also focused on the similar parameters to our study. Detailed sensitivity analysis conducted by Zhao et al. (Citation2014) also suggests that the parameters we used for the calibration are the appropriate parameters due to the following two reasons. Firstly, they highlighted that the yield predictions are most sensitive to the cultivar parameters that determine the yield component (grains_per_gram_stem, max_grain_size, and potential_grain_filling_rate) and the phenology parameters that determine the length of the reproductive stages (e.g. tt_start_grain_fill). Secondly, they showed that all ten cultivar parameters they used affect biomass, but amongst them the vern_sens and the length of the reproductive stages are the most influential.
With this calibration, model predictions for the standard sowing time (Nov-8) were significantly improved (Supplementary ). However, with the calibrated data set APSIM model overestimated the grain yield, dry matter production and LAI for late sowing conditions (Dec 19) (data not shown). We observed that the number of the remaining plants during the winter season was notably lower in the late sowing treatment than in the optimum-timing sowing treatment. However, in the APSIM wheat model no algorithm accounts for the reduction of plant number caused by the low temperature. Zhang et al. (Citation2012) reported that when using APSIM, the errors of phenology and yield simulations increase with the delay in sowing date.
In the original APSIM soil database, Japanese soil parameters are not included. Fbiom and Finert in APSIM soil parameters were adjusted (Probert et al., Citation1998) to make sure that calibrated model is capable enough to capture the indigenous N supply capacity of volcanic ash soils. Gaydon et al. (Citation2012) followed a similar method when calibrating Fbiom and Finert using the results of field soil data analysis. Calibrated Fbiom was 0.01 for the surface soils of this experiment (). The available Fbiom data in the literature are 0.02–0.04 in the non-volcanic ash soils in APSIM original soil database, but slightly lower in volcanic ash soils (0.015–0.02) (Delve & Probert, Citation2005; Delve et al., Citation2009) and thus closer to the present value. Finert of the surface soil layer in the present research (0.5) falls into the range of most of the non-volcanic ash soils (0.4–0.5) but slightly lower than the published value for the volcanic ash soils (0.7–0.8). Anyway, the largest difference in soil parameters between volcanic and non-volcanic ash soils in terms of N supply capacity was not found in Fbiom or Finert but in organic carbon content. The measured organic carbon content of the surface soil in the present research was 6.3%, and it is known that the organic C content is higher in volcanic ash soils due to the stabilization of humus by complexation with active Al (Nanzyo, Citation2002). Therefore, the higher N supply capacity of volcanic ash soils should be ascribed to its high organic carbon content, rather than the proportion of the Fbiom and Finert pools.
Model validation
Model validation was found to be acceptable for predicting phenology under early, optimum and late sowing conditions. However, the model validation for grain yield, GPC, dry matter production and LAI was acceptable only when it was limited to the optimum sowing conditions, and model fitness was reduced when the data set of the late sowing group were included (). As the model predictions under late sowing were overestimated, further model improvement is needed to addresses the plant number reduction caused by poor emergence under late sowing conditions as there is no algorithm in the APSIM model to reduce the plant number when the emergence was delayed due to late sowing.
Model evaluation indices under optimum sowing conditions confirmed the robustness of the model in estimating the grain yield with relatively high accuracy (). RMSE was 23 g m−2 and 48.2 g m−2, RRMSE was 7.2 and 15.7, and ME was 0.97 and 0.88, for Ayahikari and Yumeshiho, respectively. Other reports such as Asseng et al. (Citation1998), (Citation2000), Chen et al. (Citation2010), and Gaydon et al. (Citation2011), who conducted successful validation of APSM under standard sowing conditions in various countries, also reported RMSE values from 40 to 83 g m−2 for grain yield. Gaydon et al. (Citation2011) and Zhang et al. (Citation2012) reported RRMSE values from 13 to 16.5.
Table 7. Summary of APSIM validation for Kanto area in Japan for growth parameters. (With the data from optimum/standard sowing)
When validation was conducted for optimum sowing dataset, ME values showed that the fitness of dry matter production at maturity was very good (0.89 and 0.76 for Ayahikari and Yumeshiho, respectively) but that for dry matter production at flowering was merely acceptable (0.33 for Ayahikari) or not acceptable (−0.2 for Yumeshiho). Dry matter production at flowering for Yumeshiho showed a tendency of significant overestimation (m = 1.2) ( h, ). RMSE of the total dry matter at maturity was 77.9 to 116.9 g m−2 for Ayahikari and Yumeshiho, respectively, and that for LAI was 0.5 for both varieties (). Asseng et al. (Citation1998) and (Citation2000)) reported RMSE of 80 and 120 g m−2 for dry matter production at maturity and 0.6 and 1.2 for LAI respectively. Chen et al. (Citation2010) also reported similar RMSE of 140 g m−2 and 1.6 for dry matter production at maturity and LAI at flowering, respectively. RRMSE of the total dry matter at maturity was 13.8 and 20.8 for Ayahikari and Yumeshiho, respectively. Gaydon et al. (Citation2011) reported an RRMSE of 10.8.
RMSE of GPC was 1.9% and 1.4% for Ayahikari and Yumeshiho, respectively for optimum sowing groups (). For Asseng et al. (Citation1998) and (Citation2000)) reported RMSE of 1.6% and 3.2%. After introducing a new grain protein routine (Asseng et al., Citation2002), the RMSE of GPC reduced to 1.5–2% for temperate maritime and Mediterranean regions. This proved that the GPC validation of optimum-season sowing of our study was in a similar range as the other reports. A few percentages of RMSE of GPC are, however, crucial as the criteria for the quality bonus, and therefore the higher accuracy is needed. In APSIM GPC is determined by the balance of inflows of carbon and nitrogen to the grains. Therefore, the more precise calibration on the duration of grain filling may improve the preciseness of GPC prediction.
APSIM model could capture the soil nitrate dynamics in the topsoil layer (0–30 cm) (), with higher model efficiency (ME 0.96) for a wide range of observed values. The actual change in soil nitrate in response to fertilizer application was also reflected in the model simulation. AS APSIM model could simulate the grain yield and GPC very close to that of observed values under zero N conditions, which suggests that the model reliably accounted for the indigenous N supply of volcanic ash soils.
Conclusions
The results of this study indicated that the APSIM model could be utilized for simulation studies related to phenology, grain yield and GPC of soft wheat (Ayahikari) and hard wheat (Yumeshiho) cultivars grown in volcanic ash soils, sown at optimum season, in the Kanto area in Japan
Although prediction of phenology can be applicable for optimum and late sowing conditions, further improvements are necessary for the prediction of yield, GPC and dry matter production under late sowing conditions.
PPS2020_054RP-File013.xlsx
Download MS Excel (14.9 KB)Acknowledgements
We gratefully acknowledge the technical advice provided by Prof. Mariko Norisada, Laboratory of Tree Environmental Physiology, Asian Natural Environmental Science Center, The University of Tokyo, and the technical assistance provided for field experiments by the staff of the Institute for Sustainable Agro-ecosystem Services of the University of Tokyo.
Disclosure statement
No potential conflict of interest was reported by the authors.
Supplemental material
Supplemental data for this article can be accessed here.
Additional information
Funding
Related Research Data
References
- Asseng, S., Bar-Tal, A., Bowden, J. W., Keating, B. A., Van Herwaarden, A., Palta, J. A., Probert, M. E., & Probert, M. E. (2002). Simulation of grain protein content with APSIM-Nwheat. European Journal of Agronomy, 16(1), 25–42. https://doi.org/10.1016/S1161-0301(01)00116-2
- Asseng, S., Keating, B. A., Fillery, I. R. P., Gregory, P. J., Bowden, J. W., Turner, N. C., Palta, J. A., & Abrecht, D. G. (1998). Performance of the APSIM-wheat model in Western Australia. Field Crops Research, 57(2), 163–179. https://doi.org/10.1016/S0378-4290(97)00117-2
- Asseng, S., & Milroy, S. P. (2006). Simulation of environmental and genetic effects on grain protein concentration in wheat. European Journal of Agronomy, 25(2), 119–128. https://doi.org/10.1016/j.eja.2006.04.005
- Asseng, S., Van Keulen, H., & Stol, W. (2000). Performance and application of the APSIM wheat model in the Netherlands. European Journal of Agronomy, 12(1), 37–54. https://doi.org/10.1016/S1161-0301(99)00044-1
- Balwinder-Singh, Gaydon, D. S., Humphreys, E., & Eberbach, P. L. (2011). The effects of mulch and irrigation management on wheat in Punjab, India—Evaluation of the APSIM model. Field Crops Research, 124(1), 1–13. https://doi.org/10.1016/j.fcr.2011.04.016
- Bly, A. G., & Woodard, H. J. (2003). Foliar nitrogen application timing influence on grain yield and protein concentration of hard red winter and spring wheat. Agronomy Journal, 95(2), 335–338. https://doi.org/10.2134/agronj2003.3350
- Chen, C., Wang, E., & Yu, Q. (2010). Modeling wheat and maize productivity as affected by climate variation and irrigation supply in North China Plain. Agronomy Journal, 102(3), 1037–1049. https://doi.org/10.2134/agronj2009.0505
- Christopher, R., & Fujibayashi, K. (2017). GAIN report number: JA7027, USDA Foreign Agricultural Service. https://gain.fas.usda.gov/Recent%20GAIN%20Publications/Grain%20and%20Feed%20Annual_Tokyo_Japan_3-17-2017.pdf
- De Silva, S. H. N. P., Takahashi, T., & Okada, K. (2018). Controlling yield and grain protein content of Wheat in Japan through pre-anthesis nitrogen application to maximize producers’ profit. Japan Agricultural Research Quarterly: JARQ, 52(3), 205–217. https://doi.org/10.6090/jarq.52.205
- Delve, R. J., & Probert, M. E. (2005). Modelling P dynamics and crop response in contrasting soils of the tropics. African Crop Science Conference Proceedings, 7, 1058–1065.
- Delve, R. J., Probert, M. E., Cobo, J. G., Ricaurt, J., Rivera, M., Barrios, E., & Rao, I. M. (2009). Simulating phosphorus responses in annual crops using APSIM: Model evaluation on contrasting soils types. Nutrient Cycling in Agroecosystems, 84(3), 293–306. https://doi.org/10.1007/s10705-008-9243-6
- Ellen, J., & Spiertz, J. H. J. (1980). Effects of rate and timing of nitrogen dressings on grain yield formation of winter wheat (T. aestivum L.). Fertilizer Research, 1(3), 177–190. https://doi.org/10.1007/BF01053130
- Eneji, A. E., Honna, T., Yamamoto, S., Saito, T., & Masuda, T. (2002). Nitrogen transformation in four Japanese soils following manure+ urea amendment. Communications in Soil Science and Plant Analysis, 33(1–2), 53–66. https://doi.org/10.1081/CSS-120002377
- Fischer, R. A., Howe, G. N., & Ibrahim, Z. (1993). Irrigated spring wheat and timing and amount of nitrogen fertilizer. I. Grain yield and protein content. Field Crops Research, 33(1–2), 37–56. https://doi.org/10.1016/0378-4290(93)90093-3
- Food and Agriculture Organization of the United Nations. (2014). FAOSTAT database. http://faostat3.fao.org/faostat-gateway/go/to/download/Q/QC/E (wheat production)
- Fowler, D. B. (2003). Crop nitrogen demand and grain protein concentration of spring and winter wheat. Agronomy Journal, 95(2), 260–265. https://doi.org/10.2134/agronj2003.2600
- Garrido-Lestache, E., López-Bellido, R. J., & López-Bellido, L. (2004). Effect of N rate, timing and splitting and N type on bread-making quality in hard red spring wheat under rainfed mediterranean conditions. Field Crops Research, 85(2–3), 213–236. https://doi.org/10.1016/S0378-4290(03)00167-9
- Gauer, L. E., Grant, C. A., Gehl, D. T., & Bailey, L. D. (1992). Effects of nitrogen fertilization on grain protein content, nitrogen uptake, and nitrogen use efficiency of six spring wheat (Triticam aestivum L.) cultivars, in relation to estimated moisture supply. Canadian Journal of Plant Science, 72(1), 235–241. https://doi.org/10.4141/cjps92-026
- Gaydon, D. S., Probert, M. E., Buresh, R. J., Meinke, H., Suriadi, A., Dobermann, A., & Timsina, J. (2012). Rice in cropping systems-modelling transitions between flooded and non-flooded soil environments. European Journal of Agronomy, 39, 9–24. https://doi.org/10.1016/j.eja.2012.01.003
- Jamieson, P. D., Porter, J. R., & Wilson, D. R. (1991). A test of the computer simulation model ARCWHEAT1 on wheat crops grown in New Zealand. Field Crops Research, 27(4), 337–350. https://doi.org/10.1016/0378-4290(91)90040-3
- Karathanasis, A. D., Johnson, V. A., Peterson, G. A., Sander, D. H., & Olson, R. A. (1980). Relation of soil properties and other environmental factors to grain yield and quality of winter wheat grown at international sites. Agronomy Journal, 72(2), 329–336. https://doi.org/10.2134/agronj1980.00021962007200020019x
- Keating, B. A., Carberry, P. S., Hammer, G. L., Probert, M. E., Robertson, M. J., Holzworth, D., McLean, G., Hargreaves, J. N. G., Meinke, H., Hochman, Z., McLean, G., Verburg, K., Snow, V., Dimes, J. P., Silburn, M., Wang, E., Brown, S., Bristow, K. L., Asseng, S., Chapman, S., & Smith, C. J. (2003). An overview of APSIM, a model designed for farming systems simulation. European Journal of Agronomy, 18(3–4), 267–288. https://doi.org/10.1016/S1161-0301(02)00108-9
- Kibite, S., & Evans, L. E. (1984). Causes of negative correlations between grain yield and grain protein concentration in common wheat. Euphytica, 33(3), 801–810. https://doi.org/10.1007/BF00021906
- Kiribuchi-Otobe, C., Seki, M., Matsunaka, H., Yoshioka, T., Fujita, M., Yanagisawa, T., & Yoshida, H. (2009). Breeding “Yumeshiho”, a new bread wheat cultivar. Bulletin of the National Institute of Crop Science, 10, 75–88. https://agriknowledge.affrc.go.jp/RN/2010772288.pdf
- Knowles, T. C., Hipp, B. W., Graff, P. S., & Marshall, D. S. (1994). Timing and rate of topdress nitrogen for rainfed winter wheat. Journal of Production Agriculture, 7(2), 216–220. https://doi.org/10.2134/jpa1994.0216
- Loffer, C. M., Rauch, T. L., & Busch, R. H. (1985). Grain and plant protein relationships in hard red spring wheat. Crop Science, 25(3), 521–524. https://doi.org/10.2135/cropsci1985.0011183X002500030021x
- López-Bellido, L., López-Bellido, R. J., & Redondo, R. (2005). Nitrogen efficiency in wheat under rainfed mediterranean conditions as affected by split nitrogen application. Field Crops Research, 94(1), 86–97. https://doi.org/10.1016/j.fcr.2004.11.004
- Magaia, E., Famba, S., Wesström, I., Brito, R., & Joel, A. (2017). Modelling maize yield response to plant density and water and nitrogen supply in a semi-arid region. Field Crops Research, 205, 170–181. https://doi.org/10.1016/j.fcr.2016.12.025
- Ministry of Agriculture, Forestry and Fisheries, Japan, MAFF (2014). “Outline of the program for stabilization of management income” circular notice by the vice president of MAFF, ordered on 1 april 2011, revised on 1 april 2014. http://www.maff.go.jp/j/kobetu_ninaite/keiei/pdf/26_youkou.pdf (in Japanese)
- Mohanty, M., Probert, M. E., Reddy, K. S., Dalal, R. C., Mishra, A. K., Subba Rao, A., & Menzies, N. W. (2012). Simulating soybean–wheat cropping system: APSIM model parameterization and validation. Agriculture, Ecosystems & Environment, 152, 68–78. https://doi.org/10.1016/j.agee.2012.02.013
- Nakano, H., & Morita, S. (2009). Effects of seeding rate and nitrogen application rate on grain yield and protein content of the bread wheat cultivar ‘Minaminokaori’ in southwestern Japan. Plant Production Science, 12(1), 109–115. https://doi.org/10.1626/pps.12.109
- Nakano, H., Morita, S., & Kusuda, O. (2008). Effect of nitrogen application rate and timing on grain yield and protein content of the bread wheat cultivar ‘Minaminokaori’ in southwestern Japan. Plant Production Science, 11(1), 151–157. https://doi.org/10.1626/pps.11.151
- Nakatsuji, T. (2003). Difference between soils of effect of increasing wheat grain protein content by nitrogen fertilizer application at heading date. Agriculture and Horticulture, 78(7)( (in Japanese).), 751–755.
- Nanzyo, M. (2002). Unique properties of volcanic ash soils. Global Environmental Research- English Edition, 6(2), 99–112. http://www.airies.or.jp/journal_06-2eng.html
- Olmos, S., Distelfeld, A., Chicaiza, O., Schlatter, A. R., Fahima, T., Echenique, V., & Dubcovsky, J. (2003). Precise mapping of a locus affecting grain protein content in durum wheat. Theoretical and Applied Genetics, 107(7), 1243–1251. https://doi.org/10.1007/s00122-003-1377-y
- Peltonen, J. (1993). Grain yield of high-and low-protein wheat cultivars as influenced by timing of nitrogen application during generative development. Field Crops Research, 33(4), 385–397. https://doi.org/10.1016/0378-4290(93)90160-O
- Probert, M. E., Dimes, J. P., Keating, B. A., Dalal, R. C., & Strong, W. M. (1998). APSIM’s water and nitrogen modules and simulation of the dynamics of water and nitrogen in fallow systems. Agricultural Systems, 56(1), 1–28. https://doi.org/10.1016/S0308-521X(97)00028-0
- Rao, A. C. S., Smith, J. L., Jandhyala, V. K., Papendick, R. I., & Parr, J. F. (1993). Cultivar and climatic effects on the protein content of soft white winter wheat. Agronomy Journal, 85(5), 1023–1028. https://doi.org/10.2134/agronj1993.00021962008500050013x
- Rawluk, C. D. L., Racz, G. J., & Grant, C. A. (2000). Uptake of foliar or soil application of 15N-labelled urea solution at anthesis and its effect on wheat grain yield and protein. Canadian Journal of Plant Science, 80(2), 331–334. https://doi.org/10.4141/P99-098
- Rutkowska, A. (2009). 15Nitrogen study on accumulation and allocation of nitrogen applied at anthesis on top of early nitrogen applications in winter wheat. Journal of Plant Nutrition, 32(8), 1306–1320. https://doi.org/10.1080/01904160903006010
- Sato, A., Oyanagi, A., Suenaga, K., Watanabe, O., Kawaguchi, K., & Eguchi, H. Effects of nitrogen or phosphoric-acid application on the wheat noodle quality in different soil type. (1992). Japanese Journal of Crop Science, 61(4), 616–622. (In Japanese with English abstract). https://doi.org/10.1626/jcs.61.616
- Selles, F., & Zentner, R. P. (2001). Grain protein as a post-harvest index of N sufficiency for hard red spring wheat in the semiarid prairies. Canadian Journal of Plant Science, 81(4), 631–636. https://doi.org/10.4141/P00-101
- Shimazaki, Y., & Watanabe, Y. Grain protein concentration of wheat (T. aestivum L.)-Can cultivation techniques control the grain protein concentration of wheat? (2010). Japanese Journal of Crop Science, 79(4), 407–413. (In Japanese with English abstract). https://doi.org/10.1626/jcs.79.407
- Shoji, S., & Takahashi, T. (2002). Environmental and agricultural significance of volcanic ash soils. Global Enviornmental Research- English Edition, 6(2), 113–135. http://www.airies.or.jp/journal_06-2eng.html
- Spiertz, J. H. J., & Ellen, J. (1978). Effects of nitrogen on crop development and grain growth of winter wheat in relation to assimilation and utilization of assimilates and nutrients. Netherlands Journal of Agricultural Science, 26(2), 210–231. https://doi.org/10.18174/njas.v26i2.17100
- Spiertz, J. H. J., & Van de Haar, H. (1978). Differences in grain growth, crop photosynthesis and distribution of assimilates between a semi-dwarf and a standard cultivar of winter wheat. Netherlands Journal of Agricultural Science, 26(3), 233–249. https://doi.org/10.18174/njas.v26i3.17085
- Stark, J. C., & Tindall, T. A. (1992). Timing split applications of nitrogen for irrigated hard red spring wheat. Journal of Production Agriculture, 5(2), 221. https://doi.org/10.2134/jpa1992.0221
- Takayama, T., Ishikawa, N., & Taya, S. (2006). The effect to the protein concentration and flour quality of nitrogen fertilization at 10 days after heading in wheat. Japan Agricultural Research Quarterly: JARQ, 40(4), 291–297. https://doi.org/10.6090/jarq.40.291
- Triboi, E., Martre, P., Girousse, C., Ravel, C., & Triboi-Blondel, A. M. (2006). Unravelling environmental and genetic relationships between grain yield and nitrogen concentration for wheat. European Journal of Agronomy, 25(2), 108–118. https://doi.org/10.1016/j.eja.2006.04.004
- Triboi, E., & Triboi-Blondel, A. M. (2002). Productivity and grain or seed composition: A new approach to an old problem—invited paper. European Journal of Agronomy, 16(3), 163–186. https://doi.org/10.1016/S1161-0301(01)00146-0
- Wang, J., Wang, E., Feng, L., Yin, H., & Yu, W. (2013). Phenological trends of winter wheat in response to varietal and temperature changes in the North China Plain. Field Crops Research, 144, 135–144. https://doi.org/10.1016/j.fcr.2012.12.020
- Woolfolk, C. W., Raun, W. R., Johnson, G. V., Thomason, W. E., Mullen, R. W., Wynn, K. J., & Freeman, K. W. (2002). Influence of late-season foliar nitrogen applications on yield and grain nitrogen in winter wheat. Agronomy Journal, 94(3), 429–434. https://doi.org/10.2134/agronj2002.4290
- Wu, C., Anlauf, R., & Ma, Y. (2013). Application of the DSSAT model to simulate wheat growth in Eastern China. Journal of Agricultural Science, 5(5), 198. https://doi.org/10.5539/jas.v5n5p198
- Yoshida, H., Otobe Kiribuchi, C., Yanagisawa, T., Yamaguchi, I., Seko, H., Ushiyama, T., & Kuroda, A. (2001). Breeding of a new wheat [Triticum aestivum] cultivar” Ayahikari” with good noodle-making quality. Bulletin of the National Agriculture Research Center (Japan), 34( (in Japanese).), 17–35.
- Yoshida, M., Nakajima, T., & Tonooka, T. (2008). Effect of nitrogen application at anthesis on fusarium head blight and mycotoxin accumulation in breadmaking wheat in the western part of Japan. Journal of General Plant Pathology, 74(5), 355–363. https://doi.org/10.1007/s10327-008-0109-1
- Zebarth, B. J., & Sheard, R. W. (1992). Influence of rate and timing of nitrogen fertilization on yield and quality of hard red winter wheat in Ontario. Canadian Journal of Plant Science, 72(1), 13–19. https://doi.org/10.4141/cjps92-002
- Zhang, Y., Feng, L., Wang, E., Wang, J., & Li, B. (2012). Evaluation of the APSIM-Wheat model in terms of different cultivars, management regimes and environmental conditions. Canadian Journal of Plant Science, 92(5), 937–949. https://doi.org/10.4141/cjps2011-266
- Zhao, G., Bryan, B. A., & Song, X. (2014). Sensitivity and uncertainty analysis of the APSIM-wheat model: Interactions between cultivar, environmental, and management parameters. Ecological Modelling, 279, 1–11. https://doi.org/10.1016/j.ecolmodel.2014.02.003