ABSTRACT
Ipomoea trifida, the closest relative of sweetpotato, does not generally form storage roots, but some lines develop thick roots similar to the storage roots of the sweetpotato. Revealing the molecular mechanism of thick root development in I. trifida would help us understand the evolution of storage roots in the sweetpotato. In this study, we conducted a mapping method for quantitative trait loci (QTLs) known as QTL-seq, which is a kind of next-generation sequencing-based bulk segregant analysis. We performed QTL-seq using a backcross population (BC1F1) derived from two I. trifida lines: Mx23Hm, which does not show root-thickening; and 0431-1, which produces thick roots. The aim was to identify the QTL region involved in thick root development. As a result, a major QTL for root thickness (qRT1) was detected in the 2.94–8.71 Mb region of chr06 of Itr_r2.2, in both pot and field experiments. Six DNA markers were designed for qRT1 using InDels on chr06. Genotyping each BC1F1 individual based on these DNA markers agreed well with the SNP-Index of QTL-seq. Moreover, most individuals with 0431-1-type alleles of qRT1 developed thicker roots than individuals without 0431-1-type alleles of qRT1 in the BC2F2 population. The results of this study implied that qRT1 was an important QTL for regulating root thickness in I. trifida.
GRAPHICAL ABSTRACT
Introduction
Sweetpotato (Ipomoea batatas) is the world’s third most important root and tuber crops and mainly cultivated in Asia and Africa areas (FAO, Citation2019). Sweetpotato have high productivity of dry matter per unit area, and its storage root includes the much nutrition like carbohydrates, vitamin, and fiber (Woolfe, Citation1992). Therefore, improving yield of sweetpotato contribute to the food security in Asia and Africa areas including developing countries. By the grafting experiments between sweetpotato and a wild relative of sweetpotato (Ipomoea trifida), Hozyo (Citation1977) revealed that the productivity of sweetpotato depends on sink potential of storage roots. Thus, revealing the mechanism of storage root formation is essential to achieve yield increase in sweetpotato.
I. trifida is considered to be the closest ancestor of the cultivated sweetpotato (Nishiyama, Citation1971; Nishiyama et al., Citation1975). I. trifida forms a polyploidy complex with a range from diploid (2 n = 2x = 30) to hexaploid (2 n = 6x = 90). I. trifida has cross compatibility with the sweetpotato and is hypothesized to share the same chromosome set based on genetic and genomic studies (Feng et al., Citation2018; Roullier et al., Citation2013; Shiotani & Kawase, Citation1989; Srisuwan et al., Citation2006). However, I. trifida does not have the ability to develop large storage roots like sweetpotatoes in general (Eserman et al., Citation2018). This indicates that sweetpotatoes have obtained genes necessary for root thickening through its domestication from I. trifida. Some lines of diploid I. trifida have been reported to form thick roots like storage roots (Kobayashi, Citation1984; Komaki. & Katayama, Citation1999; M. Li et al., Citation2019). These I. trifida lines seem to be close to the primitive form of the sweetpotato that evolved from I. trifida to I. batatas. Therefore, such lines of I. trifida would be useful for understanding how the sweetpotato obtained the mechanism of storage root formation.
Genetic improvement of the root-thickening ability is one of the most important subjects in the breeding program of sweetpotatoes, and several physiological and genetic factors that thicken the roots were revealed in previous studies. For example, it was suggested that cytokinin plays an essential role in the initial stage of storage root formation (Nakatani & Komeichi, Citation1991; Nakatani et al., Citation2002). Additionally, a lot of genes involved in storage root formation were identified using transcriptomics technologies (Dong et al., Citation2019; Eserman et al., Citation2018; Firon et al., Citation2013; Tanaka et al., Citation2005; Wang et al., Citation2015; Zhang et al., Citation2017), and the functions of some genes, especially SRF1 (Tanaka et al., Citation2009), IbEXP1 (Noh et al., Citation2013), and SRD1 (Noh et al., Citation2010), were analyzed using transgenic techniques. However, the key regulatory genes for the root-thickening ability in sweetpotatoes have not been identified (Tanaka, Citation2016).
The forward genetics approach is an effective method of identifying unknown genes related to phenotypes. However, it is difficult to apply this approach to the sweetpotato because of its complex genome with hexaploidy (2 n = 6x = 90) and high heterozygosity. On the other hand, diploid I. trifida (2 n = 2x = 30) is genetically simple and thus easier to use for genetic analysis compared to the sweetpotato. Additionally, a high-quality draft-genome sequence of several diploid I. trifida was released recently (Hirakawa et al., Citation2015; Wu et al., Citation2018). Mx23Hm is an inbred line whose genome sequence is available, and 0431-1 is a self-incompatible line which has root-thickening ability, and its genome sequence is also available. These two lines of diploid I. trifida would enable rapid and high-resolution mapping of quantitative trait loci (QTLs) for root thickness in I. trifida.
Bulk segregant analysis (BSA) is a QTL mapping method for rapidly identifying the genomic region related to a trait of interest (Michelmore et al., Citation1991). Takagi et al. (Citation2013) developed a BSA method, named ‘QTL-seq,’ based on the whole genome re-sequencing of two bulks of progeny with an extreme trait value. QTL-seq does not require the genotyping of individual progenies like conventional QTL analysis and genome-wide association studies, and this method improves the resolution of QTLs compared to traditional BSA based on RAPD or RFLP markers. Therefore, QTL-seq has contributed to the rapid detection of QTLs in various crops such as rice (Takagi et al., Citation2013), soybeans (Ogiso-Tanaka et al., Citation2017), and barley (Hisano et al., Citation2017). BSA can be used for various populations like F2, recombinant inbred lines (RILs), and back-crossed lines because the linkage map construction is not needed. In particular, Itoh et al. (Citation2019) proposed the advantages of using a BC1F1 population for QTL-seq. However, only a few studies applied QTL-seq for BC1F1 population of out-crossing crops because most of the pipelines for QTL-seq were developed for F2 and RILs population (Mansfeld & Grumet, Citation2018; Takagi et al., Citation2013; Wu et al., Citation2019).
In most previous studies, the thickness of adventitious roots in field condition has been used as the indicator of the root-thickening ability of I. trifida. However, Komaki (Citation2001) suggested that thickness of the tap root is suitable as the indicator to measure the potential of root-thickening ability in I. trifida, because the thickness of adventitious roots is greatly affected by the number of roots and the speed of their elongation. Thus, in this study, we evaluated the thickness of tap root in a BC1F1 population derived from two I. trifida lines, 0431-1 and Mx23Hm and performed QTL-seq to rapidly identify QTLs involved in root-thickening ability. We first performed the pot experiment and then confirm the consistency of the identified QTLs by performing the field experiment. As a result, a major QTL for root thickness (qRT1) was successfully detected on chr06 of Itr_r2.2 in both growth conditions. The results of this study showed the applicability of QTL-seq for BC1F1 populations and can help reveal the mechanism of storage root formation in the sweetpotato.
Materials and methods
Plant materials
An F1 population was produced by crossing two accessions of I. trifida, Mx23Hm and 0431-1 (Supplementary Figure S1). Mx23Hm is a single descendant selfed line and does not develop thick roots (Hirakawa et al., Citation2015), while 0431-1 is a self-incompatible experimental line that develops thick roots (Nakayama et al., Citation2010). An individual which developed thick roots (F1#60) was selected from the 108 F1 individuals (Supplementary Figure S2). Subsequently, a BC1F1 population was produced by crossing F1#60 with Mx23Hm. The seeds of the BC1F1 population and Mx23Hm were used for the evaluation of root-thickening ability under pot and field conditions. Moreover, a BC2F2 population was produced from individuals of the BC1F1 and BC2F1 populations to verify the effect of QTL detected in the BC1F1 population (Supplementary Figure S1).
Phenotyping in pot experiment
The pot experiment was conducted in a glasshouse at Kyushu Okinawa Agricultural Research Center, NARO, Miyakonojo, Japan from 24 May to 26 August 2019. A total of 230 seeds of the BC1F1 population and 10 seeds of Mx23Hm were sown in 2 L pots (100 mm in bottom diameter; 145 mm in top diameter; 170 mm in height) (two seeds in each pot) filled with vermiculite. The 15 pots were then put in eight trays (L 911 mm × W 602 mm × H 207 mm) in water maintained at a 2–3 cm depth. After the germination, the seedlings were thinned out to one seedling per pot, and a total of 115 individuals of the BC1F1 population and 10 individuals of Mx23Hm were kept. Nutrition was supplied from the bottoms of the pots using 1000-fold diluted Hyponex medium (NPK = 6.5-6-19; Hyponex Japan Co., Ltd, Osaka, Japan) once a week. The plants were harvested at 94 days after sowing, and the max root diameter (MRD) (i.e. the major axis of the thickest part of the tap root) of each sample was measured using a Vernier scale.
Phenotyping in field experiment
The field experiment was conducted at the experimental field (31°45′ N, 131°00′ E) at Kyushu Okinawa Agricultural Research Center, NARO, Miyakonojo, Japan from 1 May 2019 to 2 September 2019. First, seeds of the BC1F1 population and Mx23Hm were sown in Jiffy pots filled with vermiculate in a glasshouse on 1 May 2019. At 19 days after sowing, 190 and 10 seedlings of the BC1F1 population and Mx23Hm, respectively, were transplanted into the experimental field as follows. We created two ridges in the field and covered the ridges with black mulch film. We transplanted 100 seedlings into each ridge (200 seedlings in total). The distance between ridges was 75 cm, and the distance between seedlings was 35 cm. A basal dressing (3.6 g N m−2, 5.4 g P2O5 m−2, and 9.0 g K2O m−2) had been previously applied to the experimental field. At 105 days after transplanting, 111 individuals of the BC1F1 population and 9 individuals of Mx23Hm were sampled. The rest of the plants were excluded because they did not survive or showed only poor growth under field conditions. The major axis and minor axis of the thickest part of the tap root of each sample were measured using a Vernier scale. Because some samples in the field experiment showed flatly thickened tap roots, the average root diameter (ARD) was calculated with the following formula: (major axis + minor axis) / 2.
DNA extraction and whole genome resequencing
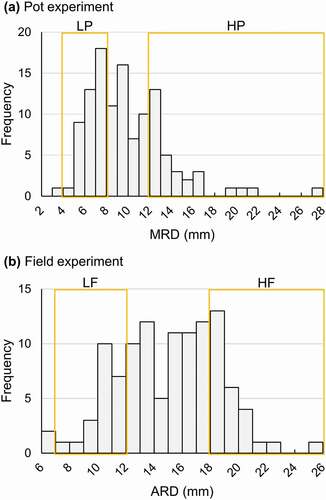
Folded leaves of 20 samples with 5.5 mm < MRD < 7.5 mm (LP: individuals with Low root-thickening ability in the Pot experiment) and 20 samples with MRD > 12.5 mm (HP: individuals with High root-thickening ability in the Pot experiment) in the pot experiment ()) and folded leaves of 20 samples with 7.0 mm < ARD < 12.0 mm (LF: individuals with Low root-thickening ability in the Field experiment) and 20 samples with ARD > 18.0 mm (HF: individuals with High root-thickening ability in the Field experiment) in the field experiment ()) were sampled. Additionally, folded leaves of Mx23Hm, F1#60, and 0431-1 were also sampled. DNA of each sample was extracted from the folded leaves according to the method described by Tanaka et al. (Citation2019). After the concentration of each extracted DNA was measured using a Qubit fluorometer (Thermo Fisher Scientific, MA, USA), LP-bulk, HP-bulk, LF-bulk, and HF-bulk were constructed by mixing equivalent amounts of the DNA of 20 samples in LP, HP, LF, and HF, respectively.
Figure 1. Frequency distributions of (a) max root diameter (MRD) in the pot experiment and (b) average root diameter (ARD) in the field experiment in the BC1F1 population. (a) The DNA of 20 individuals with low MRD (5.5 mm < MRD < 7.5 mm, LP) and the DNA of 20 individuals with high MRD (MRD > 12.5 mm, HP) were bulked as LP-bulk and HP-bulk in the pot experiment, respectively. (b) The DNA of 20 individuals with low ARD (7.0 mm < ARD < 12.0 mm, LF) and the DNA of 20 individuals with high ARD (ARD > 18.0 mm, HF) were bulked as LF-bulk and HF-bulk in the field experiment, respectively.
DNA samples of LP-bulk, HP-bulk, LF-bulk, HF-bulk, Mx23Hm, and F1#60 were subjected to whole genome resequencing. Library construction and sequencing were performed at Macrogen Japan Corp. (Kyoto, Japan). The DNA-seq library was constructed using a TruSeq DNA PCR Free (350) Kit (Illumina, Inc., CA, USA) and sequenced using Illumina NovaSeq 6000 (Illumina, Inc., CA, USA). Sequence data are deposited in the Sequence Read Archive (DRA) of the DNA Data Bank of Japan under the accession number DRA011223.
Variant calling
Raw sequence data were trimmed using Trimmomatic 0.36 (parameters: ILLUMINACLIP:TruSeq3-PE.fa:2:30:10, TRAILING:20, LEADING:20, SILDINGWINDOW:4:15 and MINLEN:100) (Bolger et al., Citation2014). The trimmed reads were mapped to the reference genome sequence of Mx23Hm (Itr_r2.2, Isobe, Citation2019) using BWA 0.7.8 (Li & Durbin, Citation2010). The mapped reads were filtered using SAMtools 1.8.4 (parameters: view -q 30 -F 256 -f 3) (H. Li et al., Citation2009), and then SNPs and InDels were detected by GATK 4.1.2.0 (McKenna et al., Citation2010). These SNP and InDel data sets were used for the following analysis.
QTL-seq
Firstly, heterozygous SNP sites (i.e. alternate allele frequency > 0.1) in Mx23Hm and homozygous SNP sites (i.e. minor allele frequency < 0.1) in F1#60 were excluded from the SNP data sets of the four bulks because all of the SNP sites detected among the BC1F1 population were homozygous in Mx23Hm and heterozygous in F1#60 in theory. Secondly, SNPs with 16 ≤ read depth ≤ 300 in each bulk were kept in SNP data sets. Finally, SNPs with an SNP-index < 0.15 in both pairs of bulks (i.e. HP-bulk and LP-bulk/HF-bulk and LF-bulk) were filtered out from the SNP data sets of each bulk set. In other words, only SNPs with an SNP-index ≥ 0.15 in either or both HP-bulk and LP-bulk/HF-bulk and LF-bulk were used for QTL-seq.
QTL-seq was performed using QTLseqr 0.7.5.2 (Mansfeld & Grumet, Citation2018). The SNP-index of each SNP site was calculated from the ratio of the alternate allele depth to the total read depth in each bulk, and then Δ(SNP-index) was calculated from the difference in SNP-index between HP-bulk and LP-bulk and the difference between HF-bulk and LF-bulk. Tricube-smoothed Δ(SNP-index) was calculated using a 1 Mb sliding window. We calculated statistical confidence intervals for each Δ(SNP-index) under the null hypothesis (no QTL) with 10,000 bootstrapped replications using the script of the simulateAlleleFreq() function in takagi_sim.R modified to be applicable to the confidence interval simulation of the BC1F1 population (Supplementary Figure S3).
Validation of a candidate QTL
Six InDels around the QTL detected by QTL-seq were found in the InDel data sets of LP-bulk and HP-bulk, and we designed six sets of primers (InDel_3.54, InDel_4.95, InDel_5.73, InDel_6.86, InDel_8.14, and InDel_9.72) corresponding to the InDels using Primer3 (). Genotypes of each 20 individuals of HP, LP, HF and FL were confirmed using these primers by Polymerase chain reaction (PCR). PCR amplification was performed in 10 µL reaction mixture containing 5 µL GoTaq Green Master Mix (Promega, WI, USA), 0.4 µM forward primer, 0.4 µM reverse primer, and 10 ng of each DNA sample in HP, LP, HF, LF, Mx23Hm, F1#60, and 0431-1, and under the following conditions: 94°C for 2 min, followed by 35 cycles of amplification (94°C for 30 s, 58°C for 30 s, and 72°C for 60 s) and a final extension at 72°C for 5 min. The PCR product size was confirmed by electrophoresis using MultiNA (Shimadzu, Kyoto, Japan) and a DNA‐500 kit (Shimadzu, Kyoto, Japan) according to the manufacturer’s protocol.
Table 1. Sequences of primers in DNA markers designed for qRT1.
Phenotyping and genotyping of BC2F2 population
The BC2F2 population was cultivated in a plastic greenhouse at Kyushu Okinawa Agricultural Research Center, NARO, Miyakonojo, Japan from 12 June to 3 September 2020. Totals of 84 and 6 seeds of the BC2F2 population and Mx23Hm were sown in 2 L pots (100 mm in bottom diameter; 145 mm in top diameter; 170 mm in height) filled with vermiculite, respectively. After germination, the pots of a total of 42 BC2F2 individuals and 3 Mx23Hm individuals were maintained and cultivated as described in the ‘Phenotyping in pot experiment’ section above. At 83 days after sowing, all plants were sampled and MRD was measured using a Vernier scale. DNA of each BC2F2 individual was extracted following the above method. Genotypes of each individual in qRT1 were determined by three InDel markers: InDel_4.95, InDel_5.73, and InDel_6.86 ().
Results
Phenotyping of BC1F1 population and plant selection for bulk sample
Most of the F1 plants obtained by the cross between 0431-1 (female) and Mx23Hm (male) developed roots thicker than Mx23Hm (Supplementary Figure S2), suggesting that the gene responsible for root thickness is dominant. We selected an F1 individual, F1#60, which developed well-thickened roots and produced a BC1F1 population by crossing F1#60 (female) and Mx23Hm (male).
The variation in the root thickness in the BC1F1 population was evaluated in both the pot and field experiments (). In the pot experiment, the maximum and minimum MRDs in BC1F1 individuals were 27.3 mm and 3.5 mm, respectively ()), whereas the MRD of Mx23Hm was 7.7 ± 2.3 (mean ± SD) mm. Twenty BC1F1 plants with MRDs of 5.5 mm to 7.5 mm (LP) were selected to construct a DNA bulk for low root-thickening ability (LP-bulk), while 20 BC1F1 plants with MRDs over 12.5 mm (HP) were selected to construct a DNA bulk for high root-thickening ability (HP-bulk). In the field experiment, the max ARD was 25.5 mm and the minimum ARD was 6.7 mm in BC1F1 individuals ()). The ARD of Mx23Hm was 10.2 ± 2.8 (mean ± SD) mm. We selected 20 BC1F1 plants, the ARDs of which ranged from 7.0 mm to 12.0 mm (LF), to construct a DNA bulk sample for low root-thickening ability (LF-bulk). Also, we selected 20 BC1F1 plants, the ARDs of which were over 18.0 mm (HF), to construct a DNA bulk for high root-thickening ability (HF-bulk). The plants with MRDs under 5.5 mm and the plants with ARDs under 7.0 were not selected for LP-bulk and LF-bulk, respectively, in order to exclude the plants with remarkably retarded growth.
The histograms of MRD and ARD were similar to a bimodal distribution (). The peaks in the frequency of MRD in the pot experiment were observed at 7–8 mm and 12–13 mm. The peaks in the frequency of ARD in the field experiment were observed at 13–14 mm and 18–19 mm. These findings implied that root thickness is regulated by a relatively small number of genes.
Whole-genome resequencing
Totals of 107, 109, 127, 138, 113, and 91 million reads were obtained for samples of LP-bulk, HP-bulk, LF-bulk, HF-bulk, Mx23Hm, and F1#60, respectively. On average, 99.3% of the trimmed reads were mapped to the reference genome. After the filtering described in the Materials and Methods section, 3,458,408 and 3,560,049 SNP sites were used for QTL-seq in the pot and field experiments, respectively. The peaks of the reference allele frequency in LP-bulk and HP-bulk and in LF-bulk and HF-bulk were between 70–80% and near the theoretical value of the reference allele frequency in the BC1F1 population, 75% (Supplementary Figure S4). This suggested that crossing of parents and sequencing were successfully conducted.
Candidate QTL for root thickness
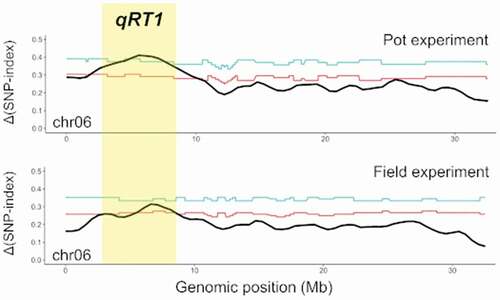
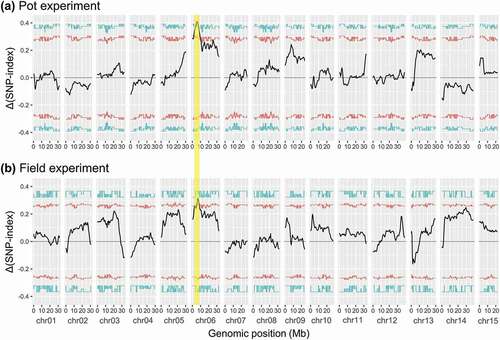
A QTL related to root thickness was detected only on chr06 in both the pot and field experiments (). In the pot experiment, the peaks of tricube-smoothed Δ(SNP-index) surpassed the 95% confidence interval in the regions of 1.59–1.65 Mb, 1.85–10.17 Mb, and 10.50–10.58 Mb, and surpassed the 99% confidence interval in the regions of 4.21–4.50 Mb and 4,89–7.60 Mb on chr06 ()). The max tricube-smoothed Δ(SNP-index) was 0.411 at the SNP of the 5,595,986th base on chr06. In the field experiment, the peaks of tricube-smoothed Δ(SNP-index) surpassed the 95% confidence interval in the regions of 2.94–3.50 Mb, 5.50–8.57 Mb, and 8.57–8.71 Mb on chr06 ()). Although the max tricube-smoothed Δ(SNP-index) was 0.315 of the SNP of the 6,611,648th base on chr06, it did not surpass the 99% confidence interval (0.333). Based on these results of QTL-seq, the region with common peaks of tricube-smoothed Δ(SNP-index) in the pot and field experiments (2.94–8.71 Mb) was considered to be a major QTL for root thickness (qRT1).
Figure 2. Tricube-smoothed Δ(SNP-index) with statistical confidence intervals (light blue, 99%; red, 95%) (a) between LP-bulk and HP-bulk in the pot experiment and (b) between LF-bulk and HF-bulk in the field experiment. The major QTL (qRT1) identified on chr06 of Itr_r2.2 in both the pot and field experiments by QTL-seq is highlighted in yellow.
Validation of qRT1 on chr06
To validate the results of QTL-seq, six InDels showing different allele frequencies (0% and 40–60%) between LP-bulk and HP-bulk in qRT1 were subjected to genotyping by PCR. Primer sets corresponding to these InDels were designed (; InDel_3.54, InDel_4.95, InDel_5.73, InDel_6.86, InDel_8.14, and InDel_9.72) to amplify fragments with different sizes for Mx23Hm and 0431-1. In all primer sets, both Mx23Hm-type and 0431-1-type fragments were detected in F1#60, indicating that the primer sets could be used to identify the Mx23Hm-type allele and the 0431-1-type allele.
Genotypes of each individual in LP, HP, LF, and HF were determined using these DNA markers (Supplementary Figures S5 and S6). The ratio of individuals having heterozygous genotype (H) in LP was lowest in InDel_6.86 and InDel_8.14 (15%) among the six InDels tested. The ratio of individuals having heterozygous genotype (H) in LF was also lowest in InDel_6.86 (20%). On the other hand, the ratio of individuals having heterozygous genotype (H) in HP was highest in InDel_5.73 (100%). The ratio of individuals having Mx23Hm-type heterozygous genotype (H) in HF was highest in InDel_6.86 (84%). These results well coincide with tricube-smoothed Δ(SNP-index) of QTL-seq.
Effect of qRT1 on root thickness in BC2F2 population
The genotypes of 42 individuals of the BC2F2 population were determined using three DNA markers (InDel_4.95, InDel_5.73, and InDel_6.86). As a result, 12, 5, and 15 individuals showed Mx23Hm-type homozygous genotype (A), 0431-1-type homozygous genotype (B), and heterozygous genotype (H), respectively, for all three markers tested (Supplementary Table. S1). In the other 10 individuals, recombinations (R) were observed among the three DNA markers.
The MRDs of individuals with Mx23Hm-type homozygous genotype (A) were not significantly different from that of Mx23Hm (). The MRD of individuals with heterozygous alleles (H) was significantly larger than those of Mx23Hm and BC2F2 individuals with Mx23Hm-type homozygous genotype (A). However, the MRDs of individuals with 0431-1-type homozygous alleles (B) were not significantly different from that of Mx23Hm. This was likely because the sample size was too small (n = 5) to detect statistical significance.
Figure 3. Max root diameter (MRD) in BC2F2 population and Mx23Hm. A, H, and B indicate BC2F2 individuals with Mx23Hm-type homozygous alleles, heterozygous alleles, and 0431-1-type homozygous alleles in the three markers (InDel_4.95, InDel_5.73, and InDel_6.86), respectively. R indicates BC2F2 individuals with recombinant alleles among the three markers. Values followed by the same letter are not significantly different according to Tukey’s honestly significant difference (HSD) test (P < 0.05).
Discussion
In this study, the BC1F1 population was produced using a self-compatible pure line of I. trifida, Mx23Hm, as a recurrent parent, and QTL-seq was conducted for this BC1F1 population. As a result, qRT1 was successfully detected on chr06 of Itr_r2.2 in both the pot and field experiments (). This suggests that QTL-seq is applicable to QTL mapping in the BC1F1 population. Highly homozygous lines for genetic study or breeding have been developed in various outcrossing crops, e.g. buck wheat (Yasui et al., Citation2016), radish (Shirasawa et al., Citation2011), and diploid potato (Phumichai et al., Citation2005). Our study suggested that QTL-seq using the BC1F1 population produced using such a highly homozygous line would enable rapid QTL mapping even in self-incompatible crops.
In our study, the genotypes of InDel markers supported the results of QTL-seq. These InDel markers designed for qRT1 revealed that most individuals of HP and HF have heterozygous genotype (H) and most individuals of LP and LF have Mx23Hm-type homozygous genotype (A) (Supplementary Figure S5, Supplementary Figure S6). In particular, all individuals of HP have heterozygous allele (H) in the marker InDel_5.73. This indicates that the responsible gene for root thickness is located near 5.7 Mb in chr06 of Itr_r2.2. However, some individuals in the LP, LF, and BC2F2 populations, which have 0431-1-type qRT1 (H or B), formed thinner roots than Mx23Hm (, Supplementary Figures S5 and S6). This would imply the existence of minor QTLs complementary to qRT1. It is also possible that root development was inhibited by environmental factors. The number of individuals showing inconsistency between their qRT1 genotype and MRD value was larger in the field experiment in which the plants were exposed to various environmental stresses. Additionally, the MRD in the BC2F2 population was obviously smaller than that in the BC1F1 population (). This may be due to the fact that the BC2F2 population was cultivated in a different year from the BC1F1 population. To further study the root-thickening-related gene(s) located in the qRT1 region, experiments under highly controlled environments would be necessary.
M. Li et al. (Citation2019) conducted QTL analysis for starch content using F1 population produced by crossing two diploid I. trifida lines, Y22 and Y25, and the QTL was detected on chromosome 3 of their reference genome of Y22 (ASM470698v1). Moreover, based on gene expression profiling in the QTL, they suggested that BMY11 (Itr.Sc0000035.86) was the most promising candidate gene for storage root swelling in diploid I. trifida. In the reference genome of Mx23Hm (Itr_r2.2) used in this study, TR.Itr_psc001.6.1CG08180.1, a gene highly homologous to BMY11 (Itr.Sc0000035.86), is on the qRT1 region (5.5 Mb in chr06) (Supplementary Figure S7). Comparison of the genome sequences by murasaki 1.68.6 (Popendorf et al., Citation2010) indicated the chr06 of Itr_r2.2 and the chromosome 3 of ASM470698v1 had many common sequences and were considered to be identical chromosomes. Thus, the same genomic region has been detected as the QTL in two different studies. The accumulation of starch and storage root swelling is closely related to the root-thickening ability. This suggests that the region including qRT1 is involved in root thickening in both the materials in this study (0431-1) and M. Li et al. (Citation2019) (Y22). However, it is unclear whether 0431-1 and Y22 share the same genetic mechanism of root thickness because 0431-1 does not develop distinct storage root like Y22.
As described by Togari (Citation1950), the sweetpotato forms two types of thickened roots, storage roots and pencil roots. Storage roots are formed by cell division in the primary cambium followed by active division and expansions of parenchyma cells in the xylem and differentiation of the secondary cambium (Kokubu, Citation1973; Tanaka, Citation2016). The development of pencil roots is also caused by cell division in the primary cambium, but it is not accompanied by differentiation of the xylem parenchyma (Kokubu, Citation1973; Togari, Citation1950). Most of the thickened roots found in the BC1F1 population used in this study were more similar to pencil roots than storage roots in the sweetpotato. This implies that qRT1 is related to cell division in the primary cambium, which is an important process both in storage root and pencil root formation.
The acquisition of 0431-1-type qRT1 may be the first stage of the evolution to the sweetpotato (I. batatas) from I. trifida. The common ancestor of I. trifida and the sweetpotato would have obtained various genes related to the differentiation of the xylem parenchyma and secondary cambium besides qRT1 and would have come to develop storage roots like the sweetpotato. Dong et al. (Citation2019) reported that storage root formation is regulated by the network of genes involved in various physiological processes. Identification of the responsible gene in qRT1 and clarification of its physiological function would be a gateway to understanding the comprehensive mechanism of storage root formation in the sweetpotato.
Various genes related to agronomic traits have been isolated by the positional cloning technique using DNA markers in various crops (Salvi & Tuberosa, Citation2005). Although I. trifida is the important model species of the sweetpotato, such a forward genetics approach has not been applied to I. trifida because of its self-incompatibility and heterozygosity. Mx23Hm, a recurrent parent in this study, has self-compatibility, and we can conduct a further backcross with Mx23Hm. Also, there are many InDels which can be used to identify the 0431-1 genotype in the qRT1 region besides the six InDels used in this study. Thus, further genetic studies using backcrosses and genotyping with InDel markers would enable fine mapping and identification of the responsible gene in the qRT1 region in the future.
Availability of data
DNA-seq data are deposited in the Sequence Read Archive (DRA) of the DNA Data Bank of Japan under the accession number DRA011223.
Disclosure of potential conflicts of interest
No potential conflict of interest was reported by the author(s).
PPS2021_016RP-File005.pdf
Download PDF (2.6 MB)Acknowledgments
The reference genome sequences of Ipomoea trifida (Itr_r2.2) were provided by Dr. Ung-Han Yoon and the TRAS genome sequencing consortium. Computations were partially performed on the NIG supercomputer at ROIS National Institute of Genetics. We thank S. Tanikado, N. Tokuchi, S. Maeda, M. Kamimura, Y. Nagayama, R. Gonbori and A. Tsuneyoshi (KARC/NARO) for their technical assistance.
Supplementary material
Supplemental data for this article can be accessed here.
Additional information
Funding
References
- Bolger, A. M., Lohse, M., & Usadel, B. (2014). Trimmomatic: A flexible trimmer for Illumina sequence data. Bioinformatics, 30(15), 2114–2120. https://doi.org/https://doi.org/10.1093/bioinformatics/btu170
- Dong, T., Zhu, M., Yu, J., Han, R., Tang, C., Xu, T., Liu, J., & Li, Z. (2019). RNA-Seq and iTRAQ reveal multiple pathways involved in storage root formation and development in sweet potato (Ipomoea batatas L.). BMC Plant Biology, 19(1), 136. https://doi.org/https://doi.org/10.1186/s12870-019-1731-0
- Eserman, L. A., Jarret, R. L., & Leebens-Mack, J. H. (2018). Parallel evolution of storage roots in morning glories (Convolvulaceae). BMC Plant Biology, 18(1), 95. https://doi.org/https://doi.org/10.1186/s12870-018-1307-4
- FAO. (2019). FAOSTAT: Crops. Food and Agriculture Organization of the United Nations, Retrieved 10 March, 2021, from. http://www.fao.org/faostat/en/#data/QC
- Feng, J. Y., Li, M., Zhao, S., Zhang, C., Yang, S. T., Qiao, S., Tan, W. F., Qu, H. J., Wang, D. Y., & Pu, Z. G. (2018). Analysis of evolution and genetic diversity of sweetpotato and its related different polyploidy wild species I. trifida using RAD-seq. BMC Plant Biology, 18(1), 181. https://doi.org/https://doi.org/10.1186/s12870-018-1399-x
- Firon, N., LaBonte, D., Villordon, A., Kfir, Y., Solis, J., Lapis, E., … Nadir, L. A. (2013). Transcriptional profiling of sweetpotato (Ipomoea batatas) roots indicates down-regulation of lignin biosynthesis and up-regulation of starch biosynthesis at an early stage of storage root formation. BMC Genomics, 14(1), 460. https://doi.org/https://doi.org/10.1186/1471-2164-14-460
- Hirakawa, H., Okada, Y., Tabuchi, H., Shirasawa, K., Watanabe, A., Tsuruoka, H., … Isobe, N. S. (2015). Survey of genome sequences in a wild sweet potato, Ipomoea trifida (H. B. K.) G. Don. DNA Research, 22(2), 171–179. https://doi.org/https://doi.org/10.1093/dnares/dsv002
- Hisano, H., Sakamoto, K., Takagi, H., Terauchi, R., & Sato, K. (2017). Exome QTL-seq maps monogenic locus and QTLs in barley. BMC Genomics, 18(1), 125. https://doi.org/https://doi.org/10.1186/s12864-017-3511-2
- Hozyo, Y. (1977). The influences of source and sink on plant production of Ipomoea grafts. Japan Agricultural Research Quarterly, 11(2), 77–83. https://www.jircas.go.jp/sites/default/files/publication/jarq/11-2-077-083_0.pdf
- Isobe, S. (2019). Sweetpotato genome sequencing efforts by the TRAS community. In Proceeding of Plant Animal Genome XXVII (pp. W1034). https://pag.confex.com/pag/xxvii/meetingapp.cgi/Paper/34043
- Itoh, N., Segawa, T., Tamiru, M., Abe, A., Sakamoto, S., Uemura, A., … Takagi, H. (2019). Next-generation sequencing-based bulked segregant analysis for QTL mapping in the heterozygous species. Brassica Rapa. Theoretical and Applied Genetics, 132, 2913–2925. https://doi.org/https://doi.org/10.1007/s00122-019-03396-z
- Kobayashi, M. (1984). The Ipomoea trifida complex closely related to sweet potato. In S. F. Shideler & H. Rincon (Eds.), Proceedings of the 6th symposium of the international society of tropical root Crop (pp. 561–568).
- Kokubu, T. (1973). Thremmatological studies on the relationship between the structure of tuberous root and its starch accumulating function in sweet potato varieties. Bulletin of the Faculty of Agriculture, Kagoshima University, 23, 1–126. http://hdl.handle.net/10232/2330
- Komaki, K. (2001). Phylogeny of Ipomoea species closely related to sweetpotato and their breeding use. Bulletin of the National Institute of Crop Science, 1, 1–56. https://www.naro.go.jp/publicity_report/publication/archive/files/1-1.pdf
- Komaki., K., & Katayama, K. (1999). Root thickness of diploid Ipomoea trifida (H. B. K.) G. Don and performance of progeny derived from the cross with sweetpotato. Breed Science, 49(2), 123–129. https://doi.org/https://doi.org/10.1270/jsbbs.49.123
- Li, H., & Durbin, R. (2010). Fast and accurate long-read alignment with Burrows-Wheeler transform. Bioinformatics, 26(5), 589–595. https://doi.org/https://doi.org/10.1093/bioinformatics/btp698
- Li, H., Handsaker, B., Wysoker, A., Fennell, T., Ruan, J., Homer, N., Marth, G., Abecasis, G., & Durbin, R. (2009). The sequence alignment/map format and SAMtools. Bioinformatics, 25(16), 2078–2079. https://doi.org/https://doi.org/10.1093/bioinformatics/btp352
- Li, M., Yang, S., Xu, W., Pu, Z., Feng, J., Wang, Z., … Tan, W. (2019). The wild sweetpotato (Ipomoea trifida) genome provides insights into storage root development. BMC Plant Biology, 19, 119. https://doi.org/https://doi.org/10.1186/s12870-019-1708-z
- Mansfeld, B. N., & Grumet, R. (2018). QTLseqr: An R package for bulk segregant analysis with next-generation sequencing. The Plant Genome, 11(2), 180006. https://doi.org/https://doi.org/10.3835/plantgenome2018.01.0006
- McKenna, A., Hanna, M., Banks, E., Sivachenko, A., Cibulskis, K., Kernytsky, A., Garimella, K., Altshuler, D., Gabriel, S., & Daly, M. (2010). The genome analysis toolkit: A mapreduce framework for analyzing next-generation DNA sequencing data. Genome Research, 20(9), 1297–1303. https://doi.org/https://doi.org/10.1101/gr.107524.110
- Michelmore, R. W., Paran, I., & Kesseli, R. V. (1991). Identification of markers linked to disease-resistance genes by bulked segregant analysis: A rapid method to detect markers in specific genomic regions by using segregating populations. Proceedings of the National Academy of Sciences of the United States of America, 88(21), 9828–9832. https://doi.org/https://doi.org/10.1073/pnas.88.21.9828
- Nakatani, M., & Komeichi, M. (1991). Changes in the endogenous level of zeatin riboside, abscisic acid and indole acetic acid during formation and thickening of tuberous roots in sweet potato. Japanese Journal of Crop Science, 60(1), 91–100. https://doi.org/https://doi.org/10.1626/jcs.60.91
- Nakatani, M., Tanaka, M., & Yoshinaga, M. (2002). Physiological and anatomical characterization of a late-storage root-forming mutant of sweetpotato. Journal of the American Society for Horticultural Science, 127(2), 178–183. https://doi.org/https://doi.org/10.21273/JASHS.127.2.178
- Nakayama, H., Tanaka, M., & Takahata, Y. (2010). An AFLP-based genetic linkage map of Ipomoea trifida (H.B.K.) G. Don., a diploid relative of sweetpotato, I. batatas (L.) Lam. Tropical Agriculture and Development, 54(1), 9–16. https://doi.org/https://doi.org/10.11248/jsta.54.9
- Nishiyama, I. (1971). Evolution and domestication of the sweet potato. The Botanical Magazine, Tokyo, 84(996), 377–387. https://doi.org/https://doi.org/10.15281/jplantres1887.84.377
- Nishiyama, I., Miyazaki, T., & Sakamoto, S. (1975). Evolutionary autoploidy in the sweet potato (Ipomoea batatas (L.) Lam.) and its progenitors. Euphytica, 24(1), 197–208. https://doi.org/https://doi.org/10.1007/BF00147186
- Noh, S. A., Lee, H. S., Huh, E. J., Huh, G. H., Paek, K. H., Shin, J. S., & Bae, J. M. (2010). SRD1 is involved in the auxin-mediated initial thickening growth of storage root by enhancing proliferation of metaxylem and cambium cells in sweetpotato (Ipomoea batatas). Journal of Experimental Botany, 61(5), 1337–1349. https://doi.org/https://doi.org/10.1093/jxb/erp399
- Noh, S. A., Lee, H. S., Kim, Y. S., Paek, K. H., Shin, J. S., & Bae, J. M. (2013). Down-regulation of the IbEXP1 gene enhanced storage root development in sweetpotato. Journal of Experimental Botany, 64(1), 129–142. https://doi.org/https://doi.org/10.1093/jxb/ers236
- Ogiso-Tanaka, E., Tanaka, T., Tanaka, K., Nonoue, Y., Sasaki, T., Fushimi, E., Koide, Y., Okumoto, Y., Yano, M., & Saito, H. (2017). Detection of novel QTLs qDTH4.5 and qDTH6.3, which confer late heading under short-day conditions, by SSR marker-based and QTL seq analysis. Breed Science, 67(2), 101–109. https://doi.org/https://doi.org/10.1270/jsbbs.16096
- Phumichai, C., Mori, M., Kobayashi, A., Kamijima, O., & Hosaka, K. (2005). Toward the development of highly homozygous diploid potato lines using the self-compatibility controlling Sligene. Genome, 48(6), 977–984. https://doi.org/https://doi.org/10.1139/g05-066
- Popendorf, K., Tsuyoshi, H., Osana, Y., & Sakakibara, Y. (2010). Murasaki: A fast, parallelizable algorithm to find anchors from multiple genomes. PLoS ONE, 5(9), e12651. https://doi.org/https://doi.org/10.1371/journal.pone.0012651
- Roullier, C., Duputié, A., Wennekes, P., Benoit, L., Bringas, F. V. M., Rossel, G., Tay, D., McKey, D., & Lebot, V. (2013). Disentangling theorigins of cultivated sweet potato (Ipomoea batatas (L.) Lam.). PLoS ONE, 8(10), e62707. https://doi.org/https://doi.org/10.1371/journal.pone.0062707
- Salvi, S., & Tuberosa, R. (2005). To clone or not to clone plant QTLs: Present and future challenges. TRENDS in Plant Science, 10(6), 297–304. https://doi.org/https://doi.org/10.1016/j.tplants.2005.04.008
- Shiotani, I., & Kawase, T. (1989). Genomic structure of the sweet potato and hexaploids in. Ipomoea Trifida. Japanese Journal of Breeding, 39(1), 57–66. https://doi.org/https://doi.org/10.1270/jsbbs1951.39.57
- Shirasawa, K., Oyama, M., Hirakawa, H., Sato, S., Tabata, S., Fujioka, T., … Sachiko, I. (2011). An EST–SSR linkage map of Raphanus sativus and comparative genomics of the Brassicaceae. DNA Research, 18(4), 221–232. https://doi.org/https://doi.org/10.1093/dnares/dsr013
- Srisuwan, S., Sihachakra, D., & Siljak-Yakovleva, S. (2006). The origin and evolution of sweet potato (Ipomoea batatas Lam.) and its wild relatives through the cytogenetic approaches. Plant Science, 171(3), 424–433. https://doi.org/https://doi.org/10.1016/j.plantsci.2006.05.007
- Takagi, H., Abe, A., Yoshida, K., Kosugi, S., Natsume, S., Mitsuoka, C., … Takuno, S. (2013). QTL-seq: Rapid mapping of quantitative trait loci in rice by whole genome resequencing of DNA from two bulked populations. The Plant Journal, 74(1), 174–183. https://doi.org/https://doi.org/10.1111/tpj.12105
- Tanaka, M. (2016). Recent progress in molecular studies on storage root formation in Sweetpotato (Ipomoea batatas). Japan Agricultural Research Quarterly, 50(4), 293–299. https://doi.org/https://doi.org/10.6090/jarq.50.293
- Tanaka, M., Sakai, T., & Takahata, Y. (2019). Allele dosage–dependent selection of recessive F3ʹH allele homozygote altered anthocyanin composition in sweetpotato. Molecular Breeding, 39(11), 152. https://doi.org/https://doi.org/10.1007/s11032-019-1062-8
- Tanaka, M., Takahata, Y., & Nakatani, M. (2005). Analysis of genes developmentally regulated during storage root formation of sweet potato. Journal of Plant Physiology, 162(1), 91–102. https://doi.org/https://doi.org/10.1016/j.jplph.2004.06.003
- Tanaka, M., Takahata, Y., Nakayama, H., Nakatani, M., & Tahara, M. (2009). Altered carbohydrate metabolism in the storage roots of sweet potato plants overexpressing the SRF1 gene, which encodes a Dof zinc finger transcription factor. Planta, 230(4), 737–746. https://doi.org/https://doi.org/10.1007/s00425-009-0979-2
- Togari, Y. (1950). A study of tuberous root formation in sweet potato. Bulletin of the National Agricultural Experiment Station (Tokyo), 68, 1–96.
- Wang, Z., Fang, B., Chen, X., Liao, M., Chen, J., Zhang, X., Huang, L., Luo, Z., Yao, Z., & Li, Y. (2015). Temporal patterns of gene expression associated with tuberous root formation and development in sweetpotato (Ipomoea batatas). BMC Plant Biology, 15(1), 180. https://doi.org/https://doi.org/10.1186/s12870-015-0567-5
- Woolfe, J. A. (1992). Sweet potato: An untapped food resource. Cambridge University Press.
- Wu, S., Lau, K. H., Cao, Q., Hamilton, J. P., Sun, H., Zhou, C., … Fei, Z. (2018). Genome sequences of two diploid wild relatives of cultivated sweetpotato reveal targets for genetic improvement. Nature Communications, 9, 4580. https://doi.org/https://doi.org/10.1038/s41467-018-06983-8
- Wu, S., Qiu, J., & Gao, Q. (2019). QTL-BSA: A Bulked Segregant Analysis and Visualization Pipeline for QTL-seq. Interdisciplinary Sciences, Computational Life Sciences, 11, 730–737. https://doi.org/https://doi.org/10.1007/s12539-019-00344-9
- Yasui, Y., Hirakawa, H., Ueno, M., Matsui, K., Katsube-Tanaka, T., Yang, S. J., & Mori, M. (2016). Assembly of the draft genome of buckwheat and its applications in identifying agronomically useful genes. DNA Research, 23(3), 215–224. https://doi.org/https://doi.org/10.1093/dnares/dsw012
- Zhang, K., Wu, Z., Tang, D., Luo, K., Lu, H., Liu, Y., … Wang, J. (2017). Comparative transcriptome analysis reveals critical function of sucrose metabolism related-enzymes in starch accumulation in the storage root of sweet potato. Frontiers in Plant Science, 8, 914. https://doi.org/https://doi.org/10.3389/fpls.2017.00914