 ?Mathematical formulae have been encoded as MathML and are displayed in this HTML version using MathJax in order to improve their display. Uncheck the box to turn MathJax off. This feature requires Javascript. Click on a formula to zoom.
ABSTRACT
A field experiment was conducted in 2018–2020 to investigate the effect of two nitrogen application rates (N0 = 0 kg ha−1(control), N90 = 90 kg ha−1, and N180 = 180 kg ha−1) on morphological and physiological behaviours of two new rapeseed varieties; V1 = JYJS01 (semi-dwarf variety) and V2 = CY36 (tall variety). Our results indicated that N application enhanced the plant growth and seed protein content in comparison to control. Contrastingly, compared with control, sugar contents, i.e. sucrose and reducing sugars, decreased significantly in response to an increase in N. Seed oil content also decreased by 8.5% and 5.5%, 6.7% and 3.9% against N180 in V1 and V2 during 2019 and 2020, respectively. Furthermore, higher nitrogen application rates decreased seed fatty acid proportions by decreasing the sugar availability for fatty acid biosynthesis. Our results demonstrated the highest seed yield (9.4 g plant−1 in 2018/19 and 9.5 g plant−1 in 2019/20) in V2 against N180, and the lowest seed yield (3.2 g plant−1 in 2018/19 and 3.4 g plant−1 in 2019/20) in V1 at control. These findings imply that a high nitrogen application rate had increased the yield. At the same time, the carbohydrates translocation from stems to seed for fatty acid biosynthesis decreased, which played their significant role in seed physiology for fatty acid metabolisms, ultimately affected the seed quality. However, there is still a dire need to evaluate how nitrogen application affect the carbohydrate availability for fatty acid metabolism in the seed of new winter rapeseed varieties.
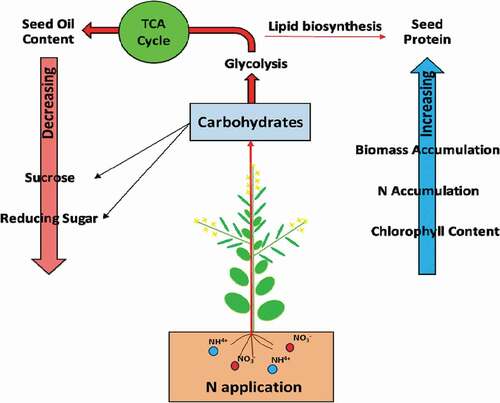
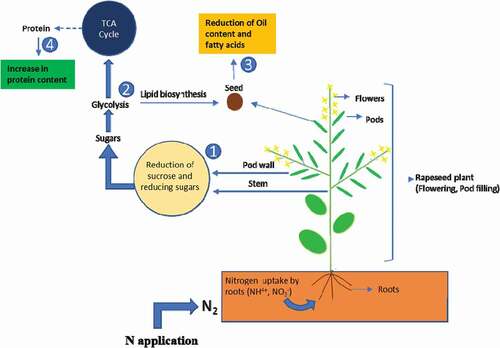
Graphical abstract
1. Introduction
The current human population is 7.5 billion, which is expected to rise by 9 billion by 2050, which will cause a significant threat to global food security (Mahajan & Tuteja, Citation2005). Therefore, high-yielding cereals and oilseed crops are s a significant challenge for the farming community to meet the increasing global food demand. Rapeseed (Brassica napus L) is one of the major oilseed crops consumed widely globally as its oil production per hectare is double compared to soybean (Shahidi, Citation1990). China is the second-largest producer of rapeseed after Canada (Bonjean et al., Citation2016). Rapeseed is the fourth largest cultivated crop in China after rice, maize and wheat, with ‘The Yangtze River Basin’ being the largest rapeseed producing belt where farmers use an intensive crop production system to obtain higher yields (X. Li et al., Citation2018). The annual rape output accounts for more than 80% of the total national output. Its oil serves as a vital source of edible oil in the human diet. Moreover, rapeseed oil demand has also increased as a renewable energy source in recent years (A. Ahmad et al., Citation2011).
Fertilizers are commonly used to boost crop production. Depending on the soil fertility and the type of crop, fertilizers are mainly used to provide the necessary amount of plant macronutrients, namely nitrogen, phosphorus, and potassium (Queirós et al., Citation2015). However, its efficiency depends upon the rate and timings of fertilizer application and the cultivar under consideration. Nitrogen (N) is one of the essential macronutrients as it plays a vital role in crop growth and development and yield production (Bouchet, Stahl et al., Citation2016b; Leghari et al., Citation2016). It is an essential structural component of chlorophyll and is involved in various physiological processes (Bouchet et al., Citation2016b). N is a highly demanding nutrient for rapeseed growth and development as its production is highly affected by available nitrogen (Öztürk, Citation2010). Also, in comparison to cereals, it has a higher critical N demand; therefore, applying the correct rate of N fertilizer at the appropriate time is an essential aspect of successful rapeseed production.
Seed oil content, protein and fatty acids in rapeseed are considered essential indexes of the seed quality. Earlier research has demonstrated that carbohydrates in sugars play a crucial role in rapeseed oil quality (Ni et al., Citation2019). The sugars (sucrose and reducing sugars) can be translocated from stem to seed, where they are the chief source of carbon (sucrose) for fatty acid metabolisms as they are converted into fatty acid during lipid biosynthesis in oilseed, thus affecting the seed quality of rapeseed ultimately (Khan et al., Citation2018a). Higher rates of N application are known to result in decreased translocation of carbohydrates from stems to seeds, which reduces the carbon source for fatty acid metabolism in seeds and change the fatty acid composition, i.e., enhanced palmitic and stearic acid content and decrease linoleic and linolenic acid content (Khan et al., Citation2018a). However, how varying rates of N application affect the carbohydrate availability for fatty acid metabolism in winter rapeseed varieties (both tall and semi-dwarf) still needs further investigation.
The N has been documented as an essential nutrient for obtaining the maximum potential of rapeseed yield (Tian et al., Citation2021). Although yield responses of rapeseed to increasing doses of N fertilizer vary with various environmental variables such as weather, soil type, residual fertility (especially nitrate), soil water content, as well as the cultivar; however, many studies have reported enhanced growth and yield of rapeseed in response to high doses of applied N (G. Ahmad et al., Citation2007; Hocking et al., Citation1997; Khan et al., Citation2018b; Rathke et al., Citation2005). It has been reported that N enhances the rapeseed yield by influencing several growth parameters, i.e. number of branches and pods per plant, seeds per pod and thousand seed weight (Öztürk, Citation2010). When applied in excess, N results in considerably reduced seed yield (Khan et al., Citation2018b). It is known that an optimum dose of N nutrient increases the protein content, but when applied in excess, it enhances N content in the seed and also decreases the oil content and thus the commercial value of rapeseed (G. Ahmad et al., Citation2007). Furthermore, excessive amounts of N application are also heavy on farmer’s pockets and pollute the environment. Since there are only a few detailed studies on the carbohydrates metabolism, oil quality and yield of rapeseed varieties in response to different N application levels; therefore, we have researched intending to assess the changes in carbohydrates accumulation, oil quality and yield of two newly introduced winter rapeseed varieties JYJS01 (semi-dwarf variety) and CY36 (tall variety) in response to different N application levels, i.e. N0 = 0 kg N ha−1(control), N90 = 90 kg N ha−1and N180 = 180 kg N ha−1.
2. Material and methods
2.1. Plant materials
The two important varieties, semi-dwarf; JYJS01 (V1) and tall; CY36 (V2) are selected because of their higher seed yield in China’s Sichuan Province. The variety JYJS01 (V1) was supplied by the Kele rapeseed research and extension limited company of Sichuan Province, and the variety CY36 (V2) was supplied by the crop research institute of Sichuan Academy of Agricultural Sciences, China.
2.2. Experimental site and design
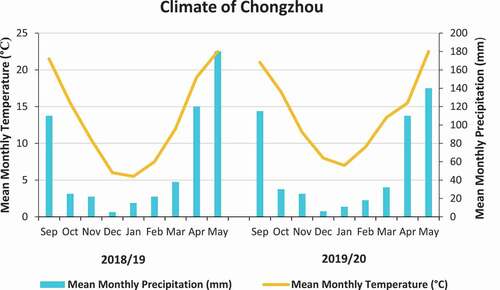
The two-year field experiment was conducted at the site of Chengdu Plain of the upper reaches of Yangtze River Basin in Sichuan province of China (102°54 E, 104°53 E, 30°05 N, 31°26 N). It is a subtropical region with an annual total rainfall of 1775 mm, an average temperature of 16.2°C and an annual total sunshine duration of 1050 h. During the winter season, the day-to-day average rainfall is generally less than 150 mm, and the temperature is above 0°C from December to February. The growing season climate, including the monthly precipitation and mean temperature, is illustrated (). The experimental site soil with clay loam texture 54% sand, 28% silt and 17% clay (hydrometer method), with total nitrogen 0.9 g kg−1 by Kjeldahl acid digestion method (Keeney, Citation1982; Sparks et al., Citation2020), total phosphorous 0.6 g kg−1 (Sparks et al., Citation2020), total potassium 6.3 g kg−1 (Huoyan et al., Citation2016), and available nitrogen 63.5 mg kg−1 automatic discontinuous analyzer (Clever chem200, Germany), available phosphorous 40.6 mg kg−1, accessible potassium 96.4 mg kg−1 (Jackson, Citation2005), and organic matter 30.3 g kg−1 in the top 0–25 cm soil layer and pH 6.6 (Pietsch & Mabit, Citation2012).
Figure 1. Monthly rainfall and the mean temperature during the growing seasons 2018–2020 from September- May.
The experiment was carried out in two successive years, 2018–2020. The field experiment was designed as a split-plot with two N application rates as the main plots with three replications and two cultivars as the subplots with three replications. The area of the subplot was measured as 9 × 2 m. The total area of plots was fertilized with 90 kg P2O5 ha−1, and the source of P2O5 is CaH6O9P2 and 90 kg K2O ha−1and, the source of K2O, is K2SO4 before sowing. Seeds were sown to the sub-plot with the density of 3 kg seeds ha−1. The R × R (row to row) distance was 30 cm, hill spacing was 20 cm, and two plants were reserved in each hole. The sowing was done on 29 September 2018. The plant’s initial flowering stage and ending flowering stage was on March 1 and March 31, 2019, respectively, and harvested on April 30 of 2019. The sowing date in 2019 was on October 11 and, the plant initial flowering stage and ending flowering stage were on February 24 and March 24, 2020, respectively, and were harvested on April 24 of 2020. The three Urea fertilizer treatments were given as N0 = 0 kg N ha−1(control); N90 = 90 kg N ha−1; N180 = 180 kg N ha−1. The total amount of fertilizer was split into two stages, one was applied as basal fertilization before sowing, and the other was top-dressed in late November at the 6-leaf stage.
2.3. Sampling and measurements
2.3.1. Data collections
The plants were harvested in four separate sets at vegetative (January 4th), flowering (March 1st), pod filling (March 31st) and maturity stages (April 30). The plant height was determined (at three phenological stages vegetative, flowering and pod filling) by measuring the distance from cotyledon nodes to the top of the plant. Harvesting of the plants was carried out when two-thirds of the seeds were brown. Six plant samples were randomly selected from each plot and steadily rooted to examine the morpho-physiological components for further experiments. Afterwards, the yield components of these selected plants were measured at maturity, including the seed number per pod, pod number per plant, and the seed yield per plant. Primary branch height was examined (at maturity) by measuring the distance from cotyledon nodes up to the first branch, and the main inflorescence length was determined (at maturity) by measuring the distance from the uppermost branches up to the top of the plant.
2.3.2. Pod area
The pod area of rapeseed plants of 20 plants in each plot was determined at the pod filling stage by following the previously published study (Zhou & Xi, Citation1993).
The formula for measuring the pod area was:
(Where h1 = 0.8 H, h2 = 0.2 H, H is pod length and d is pod width).
2.3.3. Seed quality and oil contents
The seed quality was evaluated at S30 (30 days of post-flowering). Near-infrared reflectance spectroscopy (NIRS; Foss NIR Systems Inc., U.S.A.) was used to evaluate the seed quality by following the standard procedure (Mika et al., Citation2014).
2.3.4. Total chlorophyll contents of leaves and pod wall
Total leaf and pod wall chlorophyll contents were extracted by grinding samples in 10 mL of 80% acetone and centrifuged at 1000 rpm for 3 min at 4°C. Then, these samples were placed in 10 mL of 80% aqueous acetone solution in the darkness for 24 h at room temperature. The supernatant was then separated and analyzed with a spectrophotometer (SpectraMax i3x from Austria) at wavelengths of 470, 645, and 663 nm.
The formula for measuring the total leaf and pod wall chlorophyll contents was:
Chlorophyll a (mg/g) = 12.7 (D 663) −2.69 (D 645) V/ (1000 × W)
Chlorophyll b (mg/g) = 22.9 (D 645) −4.68 (D 663) V/ (1000 × W
Total chlorophyll content = (mg/g) D652 × V/ (34.5 × W)/Chla + Chlb
Where the D, W, and, V represent the absorbance value, fresh weight of sample and volume of acetone respectively. The total chlorophyll contents were determined at vegetative, flowering and pod filling stage from all experimental plots in each replication.
2.3.5. Total nitrogen
The fresh samples were oven-dried at 105°C to stop the enzymatic activities for one hour, and then it was kept at 80°C to obtain the constant dry weight. Afterwards, the samples were ground, and the Kjeldahl method was used to determine the nitrogen content of the plant (Keeney, Citation1982; Sparks et al., Citation2020).
2.3.6. Extraction for sugars determination
The fresh stems and pod wall samples were taken and oven-dried at 105°C for 30 minutes and kept overnight at 80°C until a constant weight was gained to determine the sugar contents. Then, 0.1 g of ground powder of the dried sample was added in 6 mL of 80% ethanol. After that, the samples were boiled in the water bath at 80°C for 40 min and centrifuged at 5000 rpm for 5 min. Then the supernatant was poured into 50 mL tubes of the main solution. This method was repeated twice. After that, 80% ethanol was added into the main solution tube to the volume up to 50 mL. Later on, 0.1 g activated carbon (charcoal) was added to each 50 mL test tubes and kept overnight until the green color disappeared. This solution was filtered and used for the following experiments (Asghar et al., Citation2020).
2.3.6.1. Sucrose determination
For sucrose content measurements, a 0.9 mL extracted sample was added to the test tube and then added 0.1 mL of 2 M NaOH and heated for about 10 min in the water bath. After heating, samples were kept at room temperature for 15 minutes to cool down. Then, 1 mL of 0.1% resorcinol and 3 mL of 10 M HCL were added to the solution, and the samples were heated at 80°C for 10 min. In the end, the supernatant was taken to read the absorbance at 480 nm by using a spectrophotometer (SpectraMax i3x from Austria).
2.3.6.2. Reducing sugars
Reducing sugars were evaluated by mixing 1.5 mL of the extracted solution, 0.5 mL dd H2O and 1.5 mL DNS solution in 10 mL test tubes. These tubes were then kept in the water bath at 80°C for 10 min. Later on, the supernatant was taken to read the absorbance at 520 nm using a spectrophotometer (SpectraMax i3x from Austria).
2.4. Statistical analyses
All data were collected and analyzed by the analysis of variance (ANOVA) in conjunction with Duncan’s multiple range test to identify significant differences between treatment levels and combinations of treatments at p < 0.05. Analyses were carried out using the IBM SPSS Statistics 21.0 and Microsoft Excel 2016, and Origin 8.5 were used for graphical presentation.
3. Results
3.1. Morphological and agronomic parameters
In the current findings, the effect of different nitrogen application rates on the morphological and agronomic parameters of two rapeseed cultivars was evaluated. As depicted in , both cultivars’ average primary branch height was enhanced by 51.3% in 2018/19 and 59.7% in 2019/20 at N180 compared to N0. Furthermore, the main inflorescence length of both cultivars was increased by 28.1% and 31.4% at N180 over N0 in 2018/19 and 2019/2020, respectively. Moreover, the number of pods and seed yield was enhanced with the increasing nitrogen rate. The maximum number of pods (237.3 and 240.9) was noted in V2 at N180 compared to N0 in 2018/19 and 2019/20, respectively. Similarly, the seed yield was also recorded maximum (9.4 g Plant−1 and 9.5 g Plant−1) in V2 at N180 compared with N0 in 2018/19 and 2019/20, respectively. The mean stem diameter was also increased by 32.4% and 25.2% at N180 compared to N0 in 2018/19 and 2019/20, respectively. The branch number and seed number per pod were amplified significantly with the increasing nitrogen rate in both years (2018–2020). It was also observed that the V1 gained more pod surface area, i.e., 704 mm2 in 2018/19 and 769.3 mm2 in 2019/20 at N90, as compared to N0. Our results revealed that at N180, the V2 had obtained a higher number of seeds per pod than V1.
Table 1. Effect of different nitrogen rates (N0=0kg N ha−1; N90=90kg N ha−1; N180=180kg N ha−1) on morphological parameters of two varieties (V1=JYJS01 (semi-dwarf), and V2=CY36 (tall height) of rapeseed during the growing periods of 2018/19 and 2019/20
3.2. Plant height and biomass accumulation
Different nitrogen treatments (N0, N90, and N180) significantly affected (P < 0.05) the plant height and biomass accumulation at different growth stages (). The plant height at the pod filling stage was measured in both varieties. The plant height of three replication of both varieties at N180 was 180.5 cm and 179.5 cm in 2018/19 − 2019/20, respectively. At N180, biomass accumulation of both varieties was observed at the maturity stage, and these were 6699.8 kg ha−1 and 6850.0 kg ha−1 in 2018/19 − 2019/20, respectively. At the maturity stage, the biomass accumulation was higher at N180 than N0.
Figure 2. Effect of different nitrogen application rates, N0 = 0 kg N ha−1(control); N90 = 90 kg N ha−1; N180 = 180 kg N ha−1 at vegetative, flowering, and pod filling stage on plant height of two varieties, (a) V1 = JYJS01 (semi-dwarf), and (b) V2 = CY36 (tall height) in the years of 2018/19 and 2019/20. The ns, *, ** and *** represent the non-significant, significant at P < 0.05, 0.01, 0.001, respectively. Values on the bars followed by the same letter are not significantly different at P < 0.05 as determined by the LSD test; n = 3.
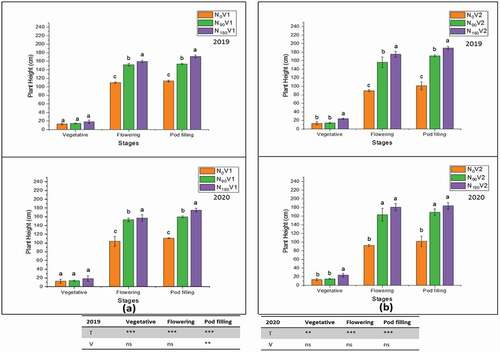
Figure 3. Effect of different nitrogen application rates, N0 = 0 kg N ha−1(control); N90 = 90 kg N ha−1; N180 = 180 kg N ha−1 on the biomass accumulation of two varieties, (a) V1 = JYJS01 (semi-dwarf), and (b) V2 = CY36 (tall height) at vegetative, flowering, pod filling stage and maturity stage The ns, *, ** and *** represent the non-significant, significant at P < 0.05, 0.01, 0.001, respectively. Values on the bars followed by the same letter are not significantly different at P < 0.05 as determined by the LSD test; n = 3.
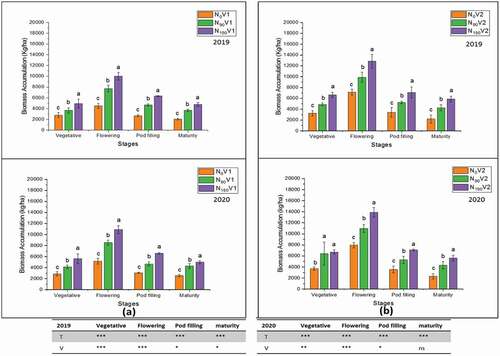
Among N0, N90 and N180, the highest plant height and biomass accumulation were observed at N180 in both years. The rapeseed plant exhibited the plant height and biomass accumulation trend as N180 > N90 > N0 (). In this study, no significant difference was found between the two varieties for plant height but only at the pod filling stage in 2018/19, while the significant varietal difference for biomass accumulation was observed between the two varieties except at the maturity stage in 2019/20 (). In the treatment N180, the plant height (171.3 cm and 175.1 cm) and biomass accumulation (6321.1 kg ha−1 and 6589.0 kg ha−1) were obtained relative to N0 in V1 at the pod filling stage in 2018/19 and 2019/20, respectively (). Similarly, plant height (189.7 cm and 184.0 cm) and biomass accumulation (7078.5 kg ha−1 and 7111.0 kg ha−1) were obtained at N180 compared to N0 in V2 at the pod filling stage in 2018/19 and 2019/20, respectively ().
3.3. Leaf and pod wall chlorophyll contents
The leaf and pod wall chlorophyll content of N0, N90 and N180 is shown in . At all sampling stages (vegetative, flowering and pod filling), the results for leaf and pod wall chlorophyll content revealed that different nitrogen treatments had significant (P < 0.05) effect on leaf and pod wall chlorophyll content of rapeseed plants during both years of experiments (). The maximum chlorophyll content was always noted in N180. Moreover, as depicted in , the leaf chlorophyll content was increased with an increase in nitrogen rate except at the vegetative stage in V2, while the pod wall chlorophyll content enhanced at both stages (flowering and pod filling).
Figure 4. Effect of different nitrogen treatments, N0 = 0 kg N ha−1(control); N90 = 90 kg N ha−1; N180 = 180 kg N ha−1 at vegetative, flowering and pod filling stage on leaf chlorophyll content of two varieties, (a) V1 = JYJS01 (semi-dwarf), and (b) V2 = CY36 (tall height) during the years of 2018/19 and 2019/20. The ns, *, ** and *** represent the non-significant, significant at P < 0.05, 0.01, 0.001, respectively. Values on the bars followed by the same letter are not significantly different at P < 0.05 as determined by the LSD test; n = 3.
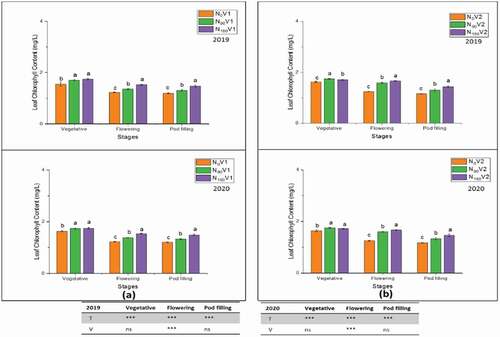
Figure 5. Effect of different nitrogen treatments, N0 = 0 kg N ha−1(control); N90 = 90 kg N ha−1; N180 = 180 kg N ha−1 at flowering and pod filling stage on pod wall chlorophyll content of two varieties, (a) V1 = JYJS01 (semi-dwarf), and (b) V2 = CY36 (tall height) during the years of 2018/19 and 2019/20. The ns, *, ** and *** represent the non-significant, significant at P < 0.05, 0.01, 0.001, respectively. Values on the bars followed by the same letter are not significantly different at P < 0.05 as determined by the LSD test; n = 3.
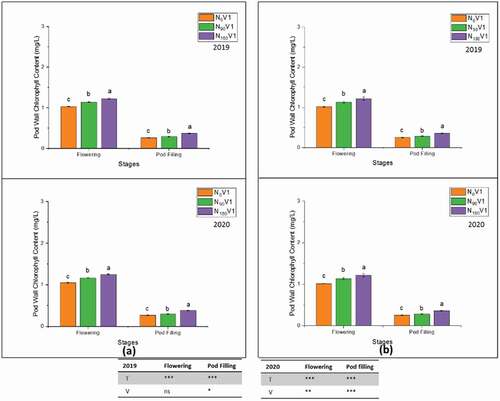
At all growth stages, the leaf chlorophyll content was maximum at the vegetative stage as compared to other stages. The leaf chlorophyll content was significantly decreased from vegetative to pod filling stage. The same trend was observed in pod wall chlorophyll contents, which was maximum at the flowering stage then declined at the pod filling stage. The maximum average leaf chlorophyll content of both varieties was recorded in treatment N180 (1.7 mg/L and 1.7 mg/L at vegetative growth stage), whereas the minimum leaf chlorophyll content was measured (1.2 mg/L and 1.2 mg/L at pod filling stage) in N0 in 2018/19 and 2019/20, respectively. Overall, the highest pod wall chlorophyll content value of both varieties was 1.2 mg/L and 1.2 mg/L in N180 at the flowering stage, while the lowest value of both varieties was 0.3 mg/L and 0.3 mg/L in N0 at the pod filling stage in 2018/19 and 2019/20, respectively. The varietal difference in leaf chlorophyll content was only significant at the flowering stage. In contrast, the varietal difference in pod wall chlorophyll content was significant in both years except at the flowering stage in 2018/19.
3.4. Total nitrogen percentages in leaves, stem, pod wall, and seed
In the current study, the total nitrogen percentages in leaves, stem, pod wall and seed were measured and the application of different treatments, N0, N90 and N180, significantly (P < 0.05) affected leaves, stem, pod wall, and seed total nitrogen percentages ()., The application of high nitrogen treatment at all tested plant parts increased the total nitrogen percentages. In both varieties at treatment N180, the maximum total nitrogen percentage was 2.2% and 2.8% in leaves at the flowering stage, whereas it was 1.6% and 1.7% in the stem at the vegetative stage as compared to N0, in 2018/19 and 2019/20, respectively ().
Figure 6. Effect of different nitrogen application rates, N0 = 0 kg N ha−1(control); N90 = 90 kg N ha−1; N180 = 180 kg N ha−1 at vegetative, flowering and pod filling stage on leaves nitrogen percentage of two varieties, (a) V1 = JYJS01 (semi-dwarf), and (b) V2 = CY36 (tall height) during the years of 2018/19 and 2019/20. The ns, *, ** and *** represent the non-significant, significant at P < 0.05, 0.01, 0.001, respectively. Values on the bars followed by the same letter are not significantly different at P < 0.05 as determined by the LSD test; n = 3.
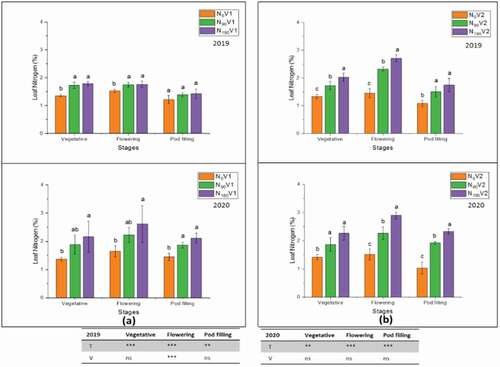
Figure 7. Stem nitrogen percentage at different nitrogen treatments, N0 = 0 kg N ha−1(control); N90 = 90 kg N ha−1; N180 = 180 kg N ha−1 at vegetative, flowering, pod filling and maturity stage and on varieties, (a) V1 = JYJS01 (semi-dwarf), and (b) V2 = CY36 (tall height) in the years of 2018/19 and 2019/20. The ns, *, ** and *** represent the non-significant, significant at P < 0.05, 0.01, 0.001, respectively. Values on the bars followed by the same letter are not significantly different at P < 0.05 as determined by the LSD test; n = 3.
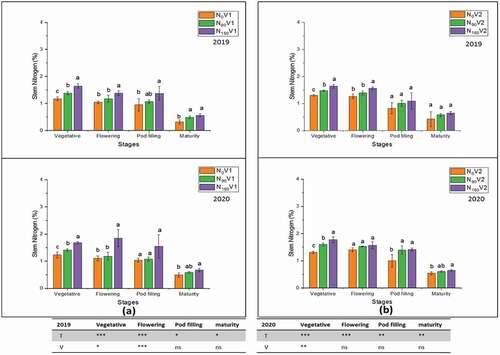
Figure 8. Effect of different nitrogen application rates, N0 = 0 kg N ha−1(control); N90 = 90 kg N ha−1; N180 = 180 kg N ha−1 on pod wall and seed nitrogen percentage of two varieties, (a) V1 = JYJS01 (semi-dwarf), and (b) V2 = CY36 (tall height) at maturity stage in the years of 2018/19 and 2019/20. The ns, *, ** and *** represent the non-significant, significant at P < 0.05, 0.01, 0.001, respectively. Values on the bars followed by the same letter are not significantly different at P < 0.05 as determined by the LSD test; n = 3.
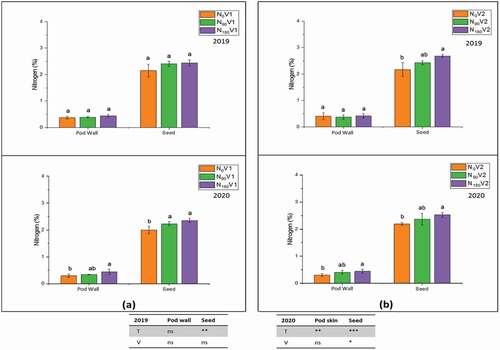
On the other hand, in both varieties, total pod wall nitrogen percentage showed different behaviour. The varietal difference of pod wall nitrogen percentage was not significantly increased in 2018/19 compared to 2019/20. In contrast, it was augmented significantly at N180 relative to treatment N0 (). The total seed nitrogen percentage of both varieties was 2.6% and 2.4% at N180 during 2018/19 () and 2019/20 () when compared with N0, respectively. The varietal difference was highly significant at the flowering stage as compared to other plant developmental stages.
3.5. Seed composition
The differential nitrogen treatments had significantly altered the seed composition in the two tested cultivars (). According to the findings of this study, the seeds protein was enhanced significantly with the increasing nitrogen application rate. The total seed protein of both varieties increased by 19.2% and 24.3% at N180 in 2018/19 and 2019/20 compared to N0 treatment, respectively. The V2 obtained the highest and the lowest protein content at N180 and V1 at N0, respectively, in both years. The highest oil content was obtained by V2 at N0, and V1 obtained at N180 in both years. An inverse relation was found between the seed protein and oil content. The mean oil content declined significantly by 7.0% and 5.4% at N180 compared to N0 in 2018/19 and 2019/20, respectively.
Table 2. The consequence of different nitrogen treatments, N0=0kg N ha−1; N90=90kg N ha−1; N180=180kg N ha−1) and varieties, V1 = JYJS01 (semi-dwarf) and V2 = CY36 (tall height) in rapeseed on oil content, protein, glucosinolate, erucic acid and fatty acid composition during the growing seasons of 2018/19 and 2019/20
In addition to seed protein and oil content, our experiment also focused on glucosinolate, erucic acid, oleic acid, palmitic acid, stearic acid, linoleic acid, linolenic acid, and arachidionic acids (). The content of glucosinolate, erucic acid, oleic acid, palmitic acid, stearic acid, and arachidionic acids was not changed significantly with the different nitrogen treatments (). The opposite trend was observed between fatty acids (linoleic and linolenic) as the linoleic acid of both varieties declined by 15.8 and 17.1% in 2018/19 and 2019/20 at N180 compared to N0, respectively. In contrast, the linolenic acid of both varieties was improved by 9.3% and 10.7% in 2018/19 and 2019/20 at N180 compared to N0 treatment, respectively. Overall, the V2 performed better than V1 via the production of high oil and protein contents under various nitrogen levels.
3.6. Stem Sucrose and Reducing Sugar
Different nitrogen treatments affected the sucrose and reducing sugars (). The stem and pod wall sucrose and reducing sugars contents were reduced significantly (P < 0.05) under different nitrogen treatments in both varieties. At the flowering stage, the highest average contents of both varieties observed for sucrose and reducing sugars were 17.7 mg/g and 0.6 mg/g, respectively, under treatment N0, whereas the lowest contents (0.7 mg/g and 0.2 mg/g) were observed at pod filling stage under treatment N180 during 2018/19. Moreover, during 2019/20, the maximum contents found for sucrose and reducing sugars were 4.4 mg/g and 0.6 mg/g in N0 at the flowering stage, respectively. Nonetheless, the minimum contents (2.0 mg/g and 0.5 mg/g) of sucrose and reducing sugars were obtained at the pod filling stage under treatment N180, respectively). In the current study, the overall varietal difference was not significant (P > 0.05.) for sucrose and reducing sugars in both years (2018/19 and 2019/20) except for sucrose at pod filling stage in 2019/20. Moreover, at the pod filling stage, the reducing sugar showed a non-significant difference ().
Table 3. Effect of different nitrogen rates (N0=0kg N ha−1; N90=90kg N ha−1; N180=180kg N ha−1) on stem sugars (Sucrose and reducing sugar contents) of two varieties (V1=JYJS01 (semi-dwarf), and V2=CY36 (tall height) of rapeseed during the flowering and pod filling periods of 2018/19 and 2019/20
3.7. Pod wall sucrose and reducing sugar
The different nitrogen treatments (N0, N90, and N180) significantly affected (P < 0.05) the pod wall sucrose and reducing sugar content at flowering and pod filling stages (). High nitrogen treatment decreased the pod sucrose and reducing sugar contents as compared to control. In treatment N180, the lowest sucrose and reducing sugar contents were 12.8 mg/g and 0.4 mg/g at pod filling and 1.2 mg/g and 1.0 mg/g at maturity stage in 2018/19 and 2019/20, respectively. Moreover, at N180, the lowest sucrose and reducing sugar contents were 0.4 mg/g and 0.3 mg/g at the pod filling stage and 0.2 mg/g and 0.2 mg/g at the maturity stage in 2018/19 and 2019/20, respectively. The lowest sucrose and reducing contents were observed at N0 in both years. The varietal difference was not significant in 2018/19, while it was significant for sucrose and reducing sugar at pod filling and maturity stages in 2019/20, respectively.
Table 4. Effect of different nitrogen rates (N0=0kg N ha−1; N90=90kg N ha−1; N180=180kg N ha−1) on pod wall sugars (Sucrose and reducing sugar contents) of two varieties (V1=JYJS01 (semi-dwarf), and V2=CY36 (tall height) of rapeseed during the flowering and pod filling periods of 2018/19 and 2019/20
4. Discussion
4.1. Morphological and agronomic parameters
In this study, the maximum number of branches and pods was obtained at a high nitrogen rate (N180). According to Tuncturk and Çiftçi (Citation2007), the number of branches has proliferated by increasing the nitrogen rate. Our results had indicated that the yield components were increased with increasing the nitrogen rate. It was also investigated by Inamullah et al. (Citation2013), that a high nitrogen application rate enhanced vegetative growth vigorously. The continuous relationship among plant growth, seed yield and nitrogen application rate could be ascribed to higher primary branch height, main inflorescence length, pod number per plant (Baghdadi et al., Citation2014; Inamullah et al., Citation2013), stem diameter, branch number per plant (N. Khan et al., Citation2002), seed number per pod (El-Nakhlawy, Citation2009), pod surface area (CitationEl Kholy et al.,) and seed yield gram per plant (Cheema et al., Citation2001; Ghanbari-Malidarreh, Citation2010; Hao et al., Citation2004; Imran et al., Citation2014; Tian et al., Citation2021). (). According to Ahmadi and Bahrani (Islam et al., Citation2018), the highest rapeseed yield was attained at 225 Kg ha−1 of nitrogen. However, the best nitrogen rate for optimum rapeseed yield differs between 180–240 kg ha−1, depending on the experiment site, environment and former crop establishment (Leghari et al., Citation2016). Following this study, in the present experiment, the maximum seed yield was obtained at N180 ().
4.2. Plant height and biomass accumulation
The effect of nitrogen fertilization was observed in plant height and biomass accumulation throughout the experiment. Increasing nitrogen application resulted in higher height and biomass accumulation values with a significant difference between the nitrogen treatments. Nitrogen is the essential nutrient for the growth and development of plants, enhancing plant height by its stimulative effect on cell divisions and cell enlargement (Leghari et al., Citation2016; Tiwari et al., Citation2002). It was studied by Yin et al. (Citation2011), that corn yield was increased significantly as the plant height increased and also demonstrated by Katsvairo et al. (Citation2003), that plant yield is increased with increment in plant height. Many studies on plant height and biomass accumulation revealed that plant height is positively correlated with biomass accumulation (Amanullah et al., Citation2008; Greef et al., Citation1999; Hamid & Nasab, Citation2001). Similarly, in this experiment, an increase in nitrogen rate had significantly increased the plant height () (Ahmadi, Citation2010; Islam et al., Citation2018); thus, it had increased the biomass accumulation () (Mahipat & Mukesh, Citation2014).
4.3. Chlorophyll content
Chlorophyll pigments are crucial for plant photosynthesis and play an essential role in multiple plant physiological functions (Guo et al., Citation2009). Nitrogen is an essential constituent of chloroplast, and any change in nitrogen treatment can directly affect the chloroplast and photosynthesis (Fang et al., Citation2018). In our experiment, the total chlorophyll contents were enhanced as the amount of nitrogen fertilization was proliferated (). Hence, the total nitrogen levels in the plant tissues were enhanced; ultimately, more photoassimilates were available towards the reproductive parts (pods). Our results are in agreement with the previously published studies (Bell et al., Citation2004; Dordas & Sioulas, Citation2008; Hokmalipour & Darbandi, Citation2011; Men et al., Citation2020). It was depicted that the high rate of nitrogen application had increased the leaf and pod wall chlorophyll content (Men et al., Citation2020; Ni et al., Citation2019; Singh et al., Citation2017). During the flowering period, high chlorophyll content improved the photosynthetic efficiency of plants (Liu et al., Citation2017), which increased the number of pods with more seed weight (Khan, Zhou et al., Citation2018b).
4.4. Total nitrogen percentages in leaves, stem, pod wall and seed
A high nitrogen application rate enhanced nitrogen availability for plants under suitable growing conditions (Hocking et al., Citation1997; Kjellstrom, Citation1997; Merrien et al., Citation1988). It was reported by Hocking and Stapper (Citation2001) that the accumulation of N in rapeseed shoots was higher between the rosette and flowering stages, thus, contributing to the more available nitrogen absorption during the flowering stage. Similarly, the maximum nitrogen accumulation in leaves and stems was observed in the current experiment at the flowering stage (). The concentration of nitrogen accumulation in plant parts increased from vegetative to flowering then decreased towards maturity (Chamorro et al., Citation2002; Hocking et al., Citation1997; Schjoerring et al., Citation1995) shown in . The accumulation of nitrogen in all organs (stem and leaves) was declined except seeds. Thus, it approved the dilution effect, which states that a higher rate of biomass accumulation decreased the rate of N accumulation (Hocking et al., Citation1997; Kjellstrom, Citation1997; Merrien et al., Citation1988).
4.5. Seed composition
Numerous research on the influence of nitrogen application on the seed protein and oil content have been reported (Aminpanah, Citation2013; Asare & Scarisbrick, Citation1995; Sawan et al., Citation2001). It was examined that the protein concentration was increased while the oil concentration was decreased by nitrogen application (Colnenne et al., Citation2002; Merrien & Blanchet, Citation1984; Mokhtassi-Bidgoli et al., Citation2013). The former studies had confirmed the inverse correlation between oil and protein contents in sunflower under high nitrogen application (Andrianasolo et al., Citation2016). Similarly, in our findings, the protein content increased, and the oil content decreased under the high nitrogen application rate . Ni et al. (Citation2019), stated that nitrogen inhibited sugar production and led to the diluting effect on the oil concentration. With the collapse of the photosynthetic organ, nitrogen was translocated from the photosynthetic organ to seed (Bennett et al., Citation2011); therefore, seed protein accumulation continued after seed oil accumulation was finished. As a result, seed oil percentage decreased, and protein percentage increased. Sugars are very vital carbohydrates, and they can be translocated from stem and pod walls to seed and cause their significant role in seed physiology (Bellaloui et al., Citation2020; Hill et al., Citation2003; Morley-Smith et al., Citation2008). Sugars are the chief and essential source of carbon for fatty acid metabolisms and ultimately affect the seed quality parameter of winter rapeseed (Bellaloui et al., Citation2020; Cai et al., Citation2020; Huppe & Turpin, Citation1994; N.A. Khan et al., Citation2008; Noctor & Foyer, Citation2000). According to Zhang and Flottmann, the photoassimilates, i.e. sucrose, played an essential function in fatty acid formation as it converted into fatty acid during lipid biosynthesis (Zhang et al., Citation2018), as is shown in .
Figure 9. This figure shows that the high nitrogen application rate had caused a reduction of stem and pod wall sugars: sucrose and reducing sugars (1), which had caused their reducibility for glycolysis (2). This reduction is responsible for the happenings of two significant events. The first one is the decreased production of oil contents (3) and fatty acids and the second event is the enhancement in the protein contents (4). The TCA represents the Tricarboxylic acid cycle.
In this experiment, fatty acids contents such as glucosinolate, oil, linoleic and linolenic acid contents declined, while the stearic acid and protein contents enhanced under the high nitrogen rate. Our findings are in line with the results of Khan et al. (Khan et al., Citation2018a), which revealed that the linoleic and linolenic acid contents were decreased by 3.96 and 2.41%, respectively, by increasing the nitrogen application. Meanwhile, the oleic acid was enhanced, which is also supported by another study (Ahmed, Citation2019). It was also concluded by Li et al. (Citation2017) that an increased in nitrogen application rate increased the palmitic and oleic acid while decreased the linoleic, linolenic and erucic acid contents in rapeseed seeds. The possible reason for the decrease in seed oil content at a high nitrogen rate (N180) might be due to a reduction in stem and pod wall sucrose and reducing sugar content at flowering and pod filling stages.
4.6. Sucrose and Reducing Sugar
Nitrogen plays a crucial role in rapeseed sugars (sucrose and reducing sugars) accumulation (Bellaloui et al., Citation2020; Khan et al., Citation2018a). It is reported that a higher nitrogen rate had decreased the carbohydrates availability in rapeseed pod wall (Ni et al., Citation2019). The previous study reported that N application increased the total nitrogen content but decreased the sugar content in the pod wall (Cui et al., Citation2016). Similarly, our experiment exhibited that a high nitrogen application rate declined the stem and pod wall sucrose and reducing sugar content of rapeseed plants at the flowering stage and pod filling stages, . According to Ni et al. (Citation2019), the application of nitrogen decreased the carbohydrates in the Brassica napus L. pod wall. Sugars are the chief and important source of carbon for fatty acid metabolisms. According to Zhang and Flottmann (Citation2018), the photoassimilates, i.e. sucrose, played a vital function in fatty acid formation as it is converted into fatty acid during lipid biosynthesis. It was reported that C:N ratio in the pod wall was higher when no N was applied, and oil concentration was also higher (Ni et al., Citation2019). As it is shown in due to the low availability of sucrose, the conversion of carbohydrates into fatty acids was decreased, which ultimately decreased the seed oil content (Khan, et al. Citation2018a) (). A similar reduction in carbohydrates was observed Mokhtassi-Bidgoli et al. (Citation2013), and Pavithra et al. (Citation2014), in which increment in nitrogen application rate had significantly reduced the sugar deposition.
5. Conclusion
Our results have demonstrated that a higher nitrogen application rate of 180 kg/ ha resulted in increased yield compared to control. Higher nitrogen application rates amplified the chlorophyll content in leaves and pod walls at flowering and pod filling stages which enhanced the photo-assimilates availability for reproductive parts of the plants and ultimately increased the pod number and seed weight. Fatty acid and carbohydrate proportions were reduced by increasing nitrogen rates. Decreased translocation of sugars from stems and pod walls to seed (for fatty acid biosynthesis) at flowering and pod filling stages had declined the oil, linoleic, linolenic, erucic and palmitic acid contents, whereas increment in protein content was observed. The key findings of the present study provide us with deeper insights for understandings the effects of nitrogen applications on the seed quality, carbohydrates availability for fatty acid metabolism and ultimately, the yield of rapeseed. However, further detailed research is needed to examine how varying nitrogen application rates affect the carbohydrate availability for fatty acid metabolism in the seed of new winter rapeseed varieties at molecular and genetic levels.
Author Contributions
Conceptualization, Y.W., A.G.; Methodology, Y.W., A.R., H.K., A.G.; Formal Analysis, A.R., H.K., A.G.; Investigation, Y.W.; Data Curation, Y.W., H.K., A.G.; Original Draft Preparation, Y.W., A.R., H.K., A.G.; Writing–Review & Editing, Y.W., A.R., H.K., A.G., M. A.A., B. A., H.H.J, H.Y, I.S., M.I.H. All authors have read and agreed to the submit the manuscript.
Disclosure Statement
No potential conflict of interest was reported by the author(s).
Additional information
Funding
References
- Ahmad, A., Yasin, N. M., Derek, C., & Lim, J. (2011). Microalgae as a sustainable energy source for biodiesel production: A review. Renewable and Sustainable Energy Reviews, 15(1), 584–593. https://doi.org/https://doi.org/10.1016/j.rser.2010.09.018
- Ahmad, G., Jan, A., Arif, M., Jan, M., & Khattak, R. (2007). Influence of nitrogen and sulfur fertilization on quality of canola (Brassica napus L.) under rainfed conditions. Journal of Zhejiang University SCIENCE B, 8(10), 731–737. https://doi.org/https://doi.org/10.1631/jzus.2007.B0731
- Ahmadi, M. (2010). Effect of zinc and nitrogen fertilizer rates on yield and yield components of oilseed rape (Brassica napus L.). World Applied Sciences Journal, 10(3), 298–303. http://www.idosi.org/.../8.pdf
- Ahmed, R. M. (2019). Oil percent and unsaturated fatty acid response of rapeseed cultivars to nitrogen and phosphorus fertilizers in two different sowing date. Tikrit Journal for Agricultural Sciences Magalla? Tikrit Li-l-’ulum Al-zira’at, 18(4), 29–38. http://tujas.tu.edu.iq/index.php/ph/article/view/95
- Amanullah, H. R., Shah, Z., Shah, P., & Shah, Z. (2008). Effects of plant density and N on growth dynamics, light interception and yield of maize. Archives of Agronomy and Soil Science, 54(4), 401–411. https://doi.org/https://doi.org/10.1080/03650340801998623
- Aminpanah, H. (2013). Effect of nitrogen rate on seed yield, protein and oil content of two canola (Brassica napus L.) cultivars. Acta Agriculturae Slovenica, 101(2), 183–190. https://doi.org/https://doi.org/10.2478/acas-2013-0014
- Andrianasolo, F. N., Champolivier, L., Debaeke, P., & Maury, P. (2016). Source and sink indicators for determining nitrogen, plant density and genotype effects on oil and protein contents in sunflower achenes. Field Crops Research, 192, 33–41. https://doi.org/https://doi.org/10.1016/j.fcr.2016.04.010
- Asare, E., & Scarisbrick, D. (1995). Rate of nitrogen and sulphur fertilizers on yield, yield components and seed quality of oilseed rape (Brassica napus L.). Field Crops Research, 44(1), 41–46. https://doi.org/https://doi.org/10.1016/0378-4290(95)00051-7
- Asghar, M. A., Du, J., Jiang, H., Li, Y., Sun, X., Shang, J., Liu, J., Liu, W., Imran, S., Iqbal, N., Ahmad, B., Hussain, S., Yu, L., Liu, C., & Yang, W. (2020). Shade pretreatment enhanced drought resistance of soybean. Environmental and Experimental Botany, 177, 171. https://doi.org/https://doi.org/10.1016/j.envexpbot.2020.104122
- Baghdadi, A., Halim, R. A., & Shahriari, A. (2014). Canola production under nitrogen fertilizer at different stages of plant growth in a crop rotation system. Journal of Food, Agriculture & Environment, 12(2), 292–295. http://world-food.net/.../a3.pdf
- Bell, G., Howell, B., Johnson, G., Raun, W., Solie, J., & Stone, M. (2004). Optical sensing of turfgrass chlorophyll content and tissue nitrogen. HortScience, 39(5), 1130–1132. https://doi.org/https://doi.org/10.21273/HORTSCI.39.5.1130
- Bellaloui, N., McClure, A. M., Mengistu, A., & Abbas, H. K. (2020). The influence of agricultural practices, the environment, and cultivar differences on soybean seed protein, oil, sugars, and amino acids. Plants, 9(3), 378. https://doi.org/https://doi.org/10.3390/plants9030378
- Bennett, E. J., Roberts, J. A., & Wagstaff, C. (2011). The role of the pod in seed development: Strategies for manipulating yield. New Phytologist, 190(4), 838–853. https://doi.org/https://doi.org/10.1111/j.1469-8137.2011.03714.x
- Bonjean, A. P., Dequidt, C., & Sang, T. (2016). Rapeseed in China. Ocl, 23(6), D605. https://doi.org/https://doi.org/10.1051/ocl/2016045
- Bouchet, A.-S., Laperche, A., Bissuel-Belaygue, C., Snowdon, R., Nesi, N., & Stahl, A. (2016b). Nitrogen use efficiency in rapeseed. A review. Agronomy for Sustainable Development, 36(2), 38. https://doi.org/https://doi.org/10.1007/s13593-016-0371-0
- Bouchet, A.-S., Laperche, A., Bissuel-Belaygue, C., Snowdon, R., Nesi, N., & Stahl, A. (2016b). Nitrogen use efficiency in rapeseed. A review. Agronomy for Sustainable Development, 36(2), 1–20. https://doi.org/https://doi.org/10.1007/s13593-016-0371-0
- Cai, Z., Xie, T., & Xu, J. 2020. Source–sink manipulations differentially affected carbon and nitrogen dynamics, fruit metabolites and yield of sacha inchi plants.
- Chamorro, A. M., Tamagno, L. N., Bezus, R., & Sarandón, S. J. (2002). Nitrogen accumulation, partition, and nitrogen-use efficiency in canola under different nitrogen availabilities. Communications in Soil Science and Plant Analysis, 33(3–4), 493–504. https://doi.org/https://doi.org/10.1081/CSS-120002759
- Cheema, M., Malik, M., Hussain, A., Shah, S., & Basra, S. (2001). Effects of time and rate of nitrogen and phosphorus application on the growth and the seed and oil yields of canola (Brassica napus L.). Journal of Agronomy and Crop Science, 186(2), 103–110. https://doi.org/https://doi.org/10.1046/j.1439-037X.2001.00463.x
- Colnenne, C., Meynard, J. M., Roche, R., & Reau, R. (2002). Effects of nitrogen deficiencies on autumnal growth of oilseed rape. European Journal of Agronomy, 17(1), 11–28. https://doi.org/https://doi.org/10.1016/S1161-0301(01)00140-X
- Cui, S., Zhang, S., Ge, S., Xiong, L., & Sun, Q. (2016). Green preparation and characterization of size-controlled nanocrystalline cellulose via ultrasonic-assisted enzymatic hydrolysis. Industrial Crops and Products, 83, 346–352. https://doi.org/https://doi.org/10.1016/j.indcrop.2016.01.019
- Dordas, C. A., & Sioulas, C. (2008). Safflower yield, chlorophyll content, photosynthesis, and water use efficiency response to nitrogen fertilization under rainfed conditions. Industrial Crops and Products, 27(1), 75–85. https://doi.org/https://doi.org/10.1016/j.indcrop.2007.07.020
- El Kholy, M., El-Zeky, M., Saleh, S. Z., & Metwaly, S. Y. Physical and chemical studies on some rapeseed varieties under different levels of nitrogen fertilization. Proc. Proceedings of the 12th International Rapeseed Congress (2007). 26–30.
- El-Nakhlawy, F. S. (2009). Performance of canola (Brassica napas L.) seed yield, yield components and seed quality under the effects of four genotypes and nitrogen fertilizer rates. Meteorology, Environment and Arid Land Agriculture Sciences, 20(2) 33-47. https://www.kau.edu.sa/Show_Res.aspx?Site_ID=155&LNG=EN&RN=62851.
- Fang, X., Li, Y., Nie, J., Wang, C., Huang, K., Zhang, Y., Zhang, Y., She, H., Liu, X., Ruan, R., Yuan, X., & Yi, Z. (2018). Effects of nitrogen fertilizer and planting density on the leaf photosynthetic characteristics, agronomic traits and grain yield in common buckwheat (Fagopyrum esculentum M.). Field Crops Research, 219, 160–168. https://doi.org/https://doi.org/10.1016/j.fcr.2018.02.001
- Ghanbari-Malidarreh, A. (2010). Effects of nitrogen rates and splitting on oil content and seed yield of canola (Brassica napus L.). American-Eurasian Journal of Agricultural and Environmental Science, 8(2), 161–166. http://www.idosi.org/aejaes/jaes8(2)/7.pdf
- Greef, J., Ott, H., Wulfes, R., & Taube, F. (1999). Growth analysis of dry matter accumulation and N uptake of forage maize cultivars affected by N supply. JAS, 132(1), 31–43. https://doi.org/https://doi.org/10.1017/S0021859698006145
- Guo, W., Zhao, X., Chen, B., Liu, R., & Zhou, Z. (2009). Effects of nitrogen on cotton (Gossypium hirsutum L.) root growth under short-term waterlogging during flowering and boll-forming stage. Acta Agronomica Sinica, 35(6), 1078–1085. https://doi.org/https://doi.org/10.3724/SP.J.1006.2009.01078
- Hamid, A., & Nasab, A. (2001). The effect of various plant densities and N levels on phenology of two medium maturity corn hybrids. Iranian Journal of Agricultural Science, 32(4), 857–874.
- Hao, X., Chang, C., & Travis, G. J. (2004). Effect of long-term cattle manure application on relations between nitrogen and oil content in canola seed. Journal of Plant Nutrition and Soil Science (1999), 167(2), 214–215. https://doi.org/https://doi.org/10.1002/jpln.200320355
- Hill, L. M., Morley-Smith, E. R., & Rawsthorne, S. (2003). Metabolism of sugars in the endosperm of developing seeds of oilseed rape. Plant Physiology, 131(1), 228–236. https://doi.org/https://doi.org/10.1104/pp.010868
- Hocking, P., Randall, P., & DeMarco, D. (1997). The response of dryland canola to nitrogen fertilizer: Partitioning and mobilization of dry matter and nitrogen, and nitrogen effects on yield components. Field Crops Research, 54(2–3), 201–220. https://doi.org/https://doi.org/10.1016/S0378-4290(97)00049-X
- Hocking, P., & Stapper, M. (2001). Effects of sowing time and nitrogen fertiliser on canola and wheat, and nitrogen fertiliser on Indian mustard. II. Nitrogen concentrations, N accumulation, and N fertiliser use efficiency. Australian Journal of Agricultural Research, 52(6), 635–644. https://doi.org/https://doi.org/10.1071/AR00114
- Hokmalipour, S., & Darbandi, M. H. (2011). Effects of nitrogen fertilizer on chlorophyll content and other leaf indicate in three cultivars of maize (Zea mays L.). World Applied Science Journal, 15(12), 1780–1785. https://www.idosi.org/wasj/wasj15(12)11/19.pdf
- Huoyan, W., CHENG, W., Ting, L., Jianmin, Z., & Xiaoqin, C. (2016). Can nonexchangeable potassium be differentiated from structural potassium in soils? Pedosphere, 26(2), 206–215. https://doi.org/https://doi.org/10.1016/S1002-0160(15)60035-2
- Huppe, H., & Turpin, D. (1994). Integration of carbon and nitrogen metabolism in plant and algal cells. Annual Review of Plant Physiology and Plant Molecular Biology, 45(1), 577–607. https://doi.org/https://doi.org/10.1146/annurev.pp.45.060194.003045
- Imran, K., . A. A., . I., Ahmad, F., . I., & Ahmad, F. (2014). Production potential of rapeseed (Brassica napus L.) as influenced by different nitrogen levels and decapitation stress under the rainfed agro-climatic condition of Swat-Pakistan. . Journal of Global Innovations in Agricultural and Social Sciences, 2(3), 112–115. https://doi.org/https://doi.org/10.17957/JGIASS/2.3.573
- Inamullah, K. B., Din, M., Siddiq, M., Khan, A., Munir, A., Azeem, K., & Haq, G. (2013). Effect of various seed rates and nitrogen levels on the productivity of late sown brassica. Sarhad Journal of Agricultural, 29(4), 503–509. https://www.aup.edu.pk/sj_pdf/3%20304-2013%20EFFECT%20OF%20VARIOUS%20SEED%20RATES%20AND%20NITROGEN%20LEVELS%20ON%20THE%20PRODUCTIVITY%20OF%20LATE%20SOWN%20BRASSICA.pdf
- Islam, R., Karim, H. T. H. M. F., & Haque, M. N. (2018). Yield and yield components of rapeseed as influenced by nitrogen and sulphur fertilization. Journal of Oilseed Brassica, 9(2), 84–95. http://www.srmr.org.in/ojs/index.php/job/article/viewFile/303/195
- Jackson, M. L. (2005). Soil chemical analysis: Advanced course. UW-Madison Libraries Parallel Press.
- Katsvairo, T. W., Cox, W. J., & Van Es, H. M. (2003). Spatial growth and nitrogen uptake variability of corn at two nitrogen levels. Agronomy Journal, 95(4), 1000–1011. https://doi.org/https://doi.org/10.2134/agronj2003.1000
- Keeney, D. R. (1982). Nitrogen management for maximum efficiency and minimum pollution. Nitrogen in Agricultural Soils, 22, 605–649. https://doi.org/https://doi.org/10.2134/agronmonogr22.c16
- Khan, N., Jan, A., Khan, I. A., & Khan, N., . N. K. (2002). Response of canola to nitrogen and sulphur nutrition. Asian Journal of Plant Sciences, 1(5), 516–518. https://doi.org/https://doi.org/10.3923/ajps.2002.516.518
- Khan, N. A., Anjum, N. A., Nazar, R., & Lone, P. M. (2008). Activity of 1-aminocyclopropane carboxylic acid synthase and growth of mustard (Brassica juncea) following defoliation. Plant Growth Regulation, 56(2), 151–157. https://doi.org/https://doi.org/10.1007/s10725-008-9296-1
- Khan, S., Anwar, S., Kuai, J., Noman, A., Shahid, M., Din, M., Ali, A., & Zhou, G. (2018b). Alteration in yield and oil quality traits of winter rapeseed by lodging at different planting density and nitrogen rates. Scientific Reports, 8(1), 634. https://doi.org/https://doi.org/10.1038/s41598-017-18734-8
- Khan, S., Anwar, S., Kuai, J., Noman, A., Shahid, M., Din, M., Ali, A., Zhou, G., Vasconcelos, B. H. B., Chiang, J. O., Martins, L. C., Casseb, L. M. N., Da Silva, E. V., Carvalho, V. L., Vasconcelos, B. C. B., Rodrigues, S. G., Oliveira, C. S., Quaresma, J. A. S., & Vasconcelos, P. F. C. (2018a). Alteration in yield and oil quality traits of winter rapeseed by lodging at different planting density and nitrogen rates. Scientific Reports, 8(1), 1–12. https://doi.org/https://doi.org/10.1038/s41598-017-17765-5
- Kjellstrom, ca.1997. Agronomy, production and nutrient status of Brassica juncea and Brassica napus under Swedish conditions.
- Leghari, S. J., Wahocho, N. A., Laghari, G. M., HafeezLaghari, A., MustafaBhabhan, G., HussainTalpur, K., Bhutto, T. A., Wahocho, S. A., & Lashari, A. A. (2016). Role of nitrogen for plant growth and development: A review. Advances in Environmental Biology, 10(9), 209–219.
- Li, W. P., Shi, H. B., Zhu, K., Zheng, Q., & Xu, Z. (2017). The quality of sunflower seed oil changes in response to nitrogen fertilizer. Agronomy Journal, 109(6), 2499–2507. https://doi.org/https://doi.org/10.2134/agronj2017.01.0046
- Li, X., Zuo, Q., Chang, H., Bai, G., Kuai, J., & Zhou, G. (2018). Higher density planting benefits mechanical harvesting of rapeseed in the Yangtze River Basin of China. Field Crops Research, 218, 97–105. https://doi.org/https://doi.org/10.1016/j.fcr.2018.01.013
- Liu, B., Ren, T., Lu, J., Li, X., Cong, R., & Wu, L. (2017). On-farm trials of site-specific N management for maximum winter oilseed rape (Brassica napus L.) yield. Journal of Plant Nutrition, 40(9), 1300–1311. https://doi.org/https://doi.org/10.1080/01904167.2016.1264599
- Mahajan, S., & Tuteja, N. (2005). Cold, salinity and drought stresses: An overview. Archives of Biochemistry and Biophysics, 444(2), 139–158. https://doi.org/https://doi.org/10.1016/j.abb.2005.10.018
- Mahipat, S., & Mukesh, K. (2014). Effect of nitrogen and sulphur levels on seed yield and some other characters in mustard [Brassica juncea (L.) Czern and Coss]. International Journal of Agricultural Sciences, 10, 449–452. https://www.cabdirect.org/cabdirect/abstract/2014319278
- Men, S., Chen, H., Chen, S., Zheng, S., Shen, X., Wang, C., Yang, Z., & Liu, D. (2020). Effects of supplemental nitrogen application on physiological characteristics, dry matter and nitrogen accumulation of winter rapeseed (Brassica napus L.) under waterlogging stress. Scientific Reports, 10(1), 1–10. https://doi.org/https://doi.org/10.1038/s41598-020-67260-7
- Merrien, A., & Blanchet, R. 1984. Physiologie du tournesol. Cultivar, 65–66.
- Merrien, A., Palleau, J., & Maisonneuve, ca. 1988. Mineral element requirements of rape cultivated in France. Physiologie et élaboration du rendement du colza d’hiver, 34–46.
- Mika, A., Gołębiowski, M., Skorkowski, E., & Stepnowski, P. (2014). Lipids of adult brown shrimp, Crangon crangon: Seasonal variations in fatty acids class composition. Journal of the Marine Biological Association of the United Kingdom, 94(5), 993–1000. https://doi.org/https://doi.org/10.1017/S0025315414000162
- Mokhtassi-Bidgoli, A., AghaAlikhani, M., Nassiri-Mahallati, M., Zand, E., Gonzalez-Andujar, J. L., & Azari, A. (2013). Agronomic performance, seed quality and nitrogen uptake of Descurainia sophia in response to different nitrogen rates and water regimes. Industrial Crops and Products, 44(1),583–592. https://doi.org/https://doi.org/10.1016/j.indcrop.2012.09.018
- Morley-Smith, E. R., Pike, M. J., Findlay, K., Köckenberger, W., Hill, L. M., Smith, A. M., & Rawsthorne, S. (2008). The transport of sugars to developing embryos is not via the bulk endosperm in oilseed rape seeds. Plant Physiology, 147(4), 2121–2130. https://doi.org/https://doi.org/10.1104/pp.108.124644
- Ni, F., Liu, J., Zhang, J., Khan, M. N., Luo, T., Xu, Z., & Hu, L. (2019). Effect of soluble sugar content in silique wall on seed oil accumulation during the seed-filling stage in Brassica napus. Crop & Pasture Science, 69(12), 1251–1263. https://doi.org/https://doi.org/10.1071/CP17392
- Noctor, G., & Foyer, C. H. (2000). Homeostasis of adenylate status during photosynthesis in a fluctuating environment. Journal of Experimental Botany, 51(suppl_1), 347–356. https://doi.org/https://doi.org/10.1093/jexbot/51.suppl_1.347
- Öztürk, Ö. (2010). Effects of source and rate of nitrogen fertilizer on yield, yield components and quality of winter rapeseed (Brassica napus L.). Chilean Journal of Agricultural Research, 70(1), 132–141. https://doi.org/https://doi.org/10.4067/S0718-58392010000100014
- Pavithra, H., Gowda, B., & Shivanna, M. (2014). Biochemical changes in the composition of developing seeds of Pongamia pinnata (L.) Pierre. Industrial Crops and Products, 53, 199–208. https://doi.org/https://doi.org/10.1016/j.indcrop.2013.12.032
- Pietsch, D., & Mabit, L. (2012). Terrace soils in the Yemen Highlands: Using physical, chemical and radiometric data to assess their suitability for agriculture and their vulnerability to degradation. Geoderma, 185, 48–60. https://doi.org/https://doi.org/10.1016/j.geoderma.2012.03.027
- Queirós, J., Malça, J., & Freire, F. (2015). Environmental life-cycle assessment of rapeseed produced in Central Europe: Addressing alternative fertilization and management practices. Journal of Cleaner Production, 99, 266–274. https://doi.org/https://doi.org/10.1016/j.jclepro.2015.03.016
- Rathke, G.-W., Christen, O., & Diepenbrock, W. (2005). Effects of nitrogen source and rate on productivity and quality of winter oilseed rape (Brassica napus L.) grown in different crop rotations. Field Crops Research, 94(2–3), 103–113. https://doi.org/https://doi.org/10.1016/j.fcr.2004.11.010
- Sawan, Z., Hafez, S., & Basyony, A. (2001). Effect of nitrogen fertilization and foliar application of plant growth retardants and zinc on cottonseed, protein and oil yields and oil properties of cotton. Journal of Agronomy and Crop Science, 186(3), 183–191. https://doi.org/https://doi.org/10.1046/j.1439-037X.2001.00473.x
- Schjoerring, J., Bock, J., Gammelvind, L., Jensen, C., & Mogensen, V. (1995). Nitrogen incorporation and remobilization in different shoot components of field-grown winter oilseed rape (Brassica napus L.) as affected by rate of nitrogen application and irrigation. Plant and Soil, 177(2), 255–264. https://doi.org/https://doi.org/10.1007/BF00010132
- Shahidi, F. (1990). North American production of canola. In Canola and rapeseed. Springer. (pp. 15–23).
- Singh, S. K., Houx, I. I. I., Maw, M.J., J. H., & Fritschi, F. B. (2017). Assessment of growth, leaf N concentration and chlorophyll content of sweet sorghum using canopy reflectance. Field Crops Research, 209, 47–57. https://doi.org/https://doi.org/10.1016/j.fcr.2017.04.009
- Sparks, D. L., Page, A., Helmke, P., & Loeppert, R. H. (2020). Methods of soil analysis, part 3: Chemical methods. John Wiley & Sons.
- Tian, C., Zhou, X., Liu, Q., Peng, J., Zhang, Z., Song, H., Ding, Z., Zhran, M. A., Eissa, M. A., Kheir, A. M., Fahmy, A. E., & Abou-Elwafa, S. F. (2021). Increasing yield, quality and profitability of winter oilseed rape (Brassica napus) under combinations of nutrient levels in fertiliser and planting density. Crop & Pasture Science, 71(12), 1010–1019. https://doi.org/https://doi.org/10.1071/CP20328
- Tiwari, R., Sengar, S., & Agarwal, A. 2002. Effect of doses and methods of nitrogen application on growth, bulb yield and quality of’Pusa Red’onion (Allium cepa).
- Tuncturk, M., & Çiftçi, V. (2007). Relationships between yield and some yield components in rapeseed (Brassica napus ssp. oleifera L.) cultivars by using correlation and path analysis. Pakistan Journal of Botany, 39(1), 81. http://www.pakbs.org/pjbot/PDFs/39(1)/PJB39(1)081.pdf
- Yin, X., McClure, M. A., Jaja, N., Tyler, D. D., & Hayes, R. M. (2011). In‐season prediction of corn yield using plant height under major production systems. Agronomy Journal, 103(3), 923–929. https://doi.org/https://doi.org/10.2134/agronj2010.0450
- Zhang, H., & Flottmann, S. (2018). Source-sink manipulations indicate seed yield in canola is limited by source availability. European Journal of Agronomy, 96, 70–76. https://doi.org/https://doi.org/10.1016/j.eja.2018.03.005
- Zhang, J., Zhang, S., Cheng, M., Jiang, H., Zhang, X., Peng, C., Lu, X., Zhang, M., & Jin, J. (2018). Effect of drought on agronomic traits of rice and wheat: A meta-analysis. International Journal of Environmental Research and Public Health, 15(5), 839. https://doi.org/https://doi.org/10.3390/ijerph15050839
- Zhou, W., & Xi, H. (1993). Effects of mixtalol and paclobutrazol on photosynthesis and yield of rape (Brassica napus). Journal of Plant Growth Regulation, 12(3), 157–161. https://doi.org/https://doi.org/10.1007/BF00189647