 ?Mathematical formulae have been encoded as MathML and are displayed in this HTML version using MathJax in order to improve their display. Uncheck the box to turn MathJax off. This feature requires Javascript. Click on a formula to zoom.
ABSTRACT
The objectives of this study were to find the best vegetation index (VI) associated with plant nitrogen content at the reproductive stage in rice, to associate the number of spikelets with this VI and solar radiation, and to estimate the number of spikelets. Rice cultivars Ishikawa 65 and Koshihikari were grown in the field in 2019 and 2020 at various nitrogen application rates and transplanting densities. From 30 days before heading to just after heading, the field was imaged with a multispectral camera. The images were processed with predefined ground control point data to create VI maps. From the maps, VI data were retrieved from the canopy area where plants were harvested for the determination of plant nitrogen content at the reproductive stage and of the number of spikelets at maturity. Among 6 VIs tested, the chlorophyll index green (CIgreen) had the highest coefficient of determination (R2) with plant nitrogen content at the reproductive stage and was the only VI with a linear relation with plant nitrogen content. The number of spikelets per unit area was well explained by multiple regression with CIgreen at 15 days before heading (CIG15) and cumulative solar radiation in the 15 days before heading (CSR15) as independent variables. A higher CIG15 would increase the number of spikelets differentiated and a higher CSR15 would reduce the rate of degeneration by increasing dry matter production.
Graphical abstract
Introduction
The number of spikelets per area sets the upper limit of rice grain yield because the grain size lacks elasticity owing to the rigid palea and lemma (Hoshikawa, Citation1989). However, an excessive number of spikelets limit grain filling and thus grain yield (Matsushima, Citation1980). Therefore, there should be an optimal number of spikelets per area at which grain yield is maximized. The number of spikelets is most affected by plant nitrogen status (Matsushima, Citation1980). Therefore, understanding the association of plant nitrogen status with the number of spikelets per unit area could help to increase or optimize the number of spikelets in practical cultivation.
The number of spikelets per unit area is the product of the number of panicles per unit area and the number of spikelets per panicle. Owing to the strong trade-off between the two components, estimation of the number of the spikelets per unit area is more productive than estimation of each component separately (Yoshida et al., Citation2006). The number of spikelets is the difference between the number of differentiated spikelets and that of degenerated spikelets (Matsushima, Citation1980; Yoshida, Citation1981). Spikelet differentiation continues until approximately 15 days before heading, after which not all the spikelets that successfully differentiated survive and develop, and some degenerate. Wada (Citation1969) hypothesized that the number of spikelets differentiated correlates with the plant nitrogen content at the late stage of spikelet differentiation, and the number degenerated correlates with the crop growth rate from then until heading. Observations have shown the association between plant nitrogen content at various reproductive stages and the number of spikelets per unit area or differentiated (Kamiji et al., Citation2011; Kobayasi & Horie, Citation1994; Wada & Cruz, Citation1989). By model analysis, the number of spikelets per area has been estimated from plant nitrogen content at 2 weeks before heading and crop growth rate in the 2 weeks before heading (Yoshida et al., Citation2006). Although such analysis could specify factors limiting the number of spikelets in practical farming and could lead to a strategy for breeding cultivars with more spikelets, its practical use is still difficult owing to the time and labor required to evaluate plant nitrogen content. A method for the wide-scale and quick evaluation of plant nitrogen content could enable us to estimate the number of spikelets for practical use.
Remote sensing techniques based on satellite imagery and canopy sensors are used to nondestructively estimate plant parameters such as growth parameters and nitrogen status. Various vegetation indices (VIs) based on spectral reflectance data have been proposed for such estimation. Among VIs, the normalized difference spectral indices (NDSIs) and the ratio spectral indices (RSIs) are calculated from data in two spectral reflectance bands. The accuracy of estimation of plant parameters varies with the VI and is affected by the ground coverage of crops (Nguy-Robertson et al., Citation2012). The use of the optimum VI for plant nitrogen content at the reproductive stage in rice would facilitate the analysis of the number of spikelets.
Unmanned aerial vehicles (UAVs) carrying multispectral cameras are now affordable, and software is available for autonomous flight control and data capture, processing, and analysis. UAVs allow the creation of VI maps from spectral ortho-images. These VI maps can be used at the field level to the plot level (Duan, Chapman, Guo & Zheng, Citation2017; Sankaran et al., Citation2015). In any of the VI maps based on the same fixed ground control points (GCPs), the same position coordinate represents the same ground point. From the VI maps, VI data in any area of interest can be retrieved from a geographical information system (GIS). Therefore, at various crop growth stages, we can obtain nondestructively sampled VI data from the identical area where plant parameters are determined, such as plant nitrogen content or the number of spikelets.
In this study, we used a UAV carrying a multispectral camera, which can capture images in four spectra: green, red, red edge, and near-infrared (NIR). From the spectral reflectance data, we calculated six VIs. The objectives were to clarify the VI which correlates best with the plant nitrogen content during the reproductive growth period in rice; to clarify the relation between this VI and the number of spikelets per unit area; to clarify the effect of solar radiation on this relation; and to estimate the number of spikelets from the VI and solar radiation.
Materials and methods
Plant materials
The experimental site was the University Farm of Ishikawa Prefectural University, Nonoichi, Japan (36°02′N, 140°04′E), on a Gray Lowland soil. In 2019 and 2020, two Japanese rice (Oryza sativa L.) cultivars, Ishikawa 65 (also known as Hyakumangoku) and Koshihikari, were grown. These high-quality cultivars are widely grown in Ishikawa prefecture. Ishikawa 65 was raised in two crops with different transplanting dates in each year and Koshihikari in 1 crop in 2019 and 2 in 2020 (). In each crop, experimental plots (at least 25 m2) were arranged in a split-plot design with nitrogen application rate as the main plot and transplanting density as the subplot for Ishikawa 65 and in a randomized block design for Koshihikari, both cultivars with 3 replications (). To ensure a wide range of the number of panicles per unit area and that of spikelets per panicle, we added the second factor, planting density, in Ishikawa 65 because the regulation of these yield components only by a rate and timing of nitrogen topdressing is difficult in this cultivar (Nakamura, Citation2018, personal communication). In each year, 3 seedlings (18–28 days old) were transplanted as rectangular planting at 11.1 hills m−2 (30 cm × 30 cm; inter-row space × inter-hill space), 17.4 hills m−2 (30 cm × 19 cm), 18.5 hills m−2 (30 cm × 18 cm), and 22.2 hills m−2 (30 cm × 15 cm). Nitrogen application rate was set from 0.0 g m−2 to 14.6 g m−2. Nitrogen was applied as coated urea and ammonium sulfate. Phosphorus (10 g m−2 as calcium superphosphate) and potassium (10 g m−2 as potassium chloride) were applied to all plots as basal fertilizers. Weeds, insects, and diseases were controlled with standard chemicals as necessary.
Table 1. Dates of transplanting, heading, levels nitrogen (N) application rate, and levels of transplanting density in each year in each cultivar
Measurement of plant nitrogen content
In each plot, we determined the heading date as the day at which more than 50% of the total panicles emerged. For the measurement of plant nitrogen content in Ishikawa 65, plants were harvested at 27 and 22 days before heading (the mean heading date in each crop) in the first and second crop in 2019 and 7 and 5 days before heading in the first and second crops in 2020. In Koshihikari, plants were harvested at 26, 17, and 6 days before heading in 2019 and at 12 and 11 days before heading in the first and second crops in 2020. Aboveground parts of all plants in a randomly selected area of 4 rows by 4 hills were harvested, dried for 72 h at 80°C, and weighed. The dried samples were ground to a powder in a cyclone sample mill (CSM-F1; Udy Co., CO, USA) with a 0.5-mm screen. The nitrogen concentration (g nitrogen/g dry weight) was measured by the Dumas combustion method (NCH Analyzer, Sumika Chemical Analysis Service, Tokyo, Japan). Aboveground plant nitrogen content was calculated as nitrogen concentration × dry weight/harvested area.
Determination of number of spikelets per unit area
At maturity, all plants in a randomly selected area of 4 rows by 4 hills in each plot were harvested for the determination of the number of spikelets. Panicles were counted and threshed, and the weight of total spikelets was recorded. In a subsample of approximately 100 g, the number of spikelets was counted, and the total number was calculated from the subsample and sample weights. The number of spikelets per unit area was then determined as the total number of spikelets/harvested area.
Monitoring and calculation of vegetation indices (VIs)
Every 4–8 days from around 30 days before heading to just after heading, we recorded the paddy field with the multispectral camera (Sequoia, Parrot, Parris, France) mounted on the UAV (Bluegrass, Parrot). The camera captures 4 images of 1280 × 960 pixels in one shot in 4 bands (green 530–570 nm, red 640–680 nm, red edge 730–740 nm, and NIR 770–810 nm). On the same dates, and at the beginning of crop growth (early to mid-June in both years), and after all plants were harvested, we captured RGB images with an RGB camera mounted on another UAV (Phantom 4 Pro, DJI, Hong Kong). Although the Sequoia camera also captures RGB images, the Phantom’s camera has a higher resolution. Autonomous flight plans were plotted in Pix4Dcapture software (Pix4D S.A., Lausanne, Switzerland), with 80% front overlap, 80% side overlap, and a flight height of 30 m, as described by Tambo et al. (Citation2021). The flight time was approximately in 10 min, and image sets were captured at 1-s intervals. Images taken by both cameras have embedded GPS data, and those taken by the Sequoia also incorporate irradiance data captured by an attached sunshine sensor. Before and after each flight with Bluegrass, images of a calibrated reflectance panel at 1 m height were captured. We set 9 ground control points (GCPs) whose exact latitude, longitude, and altitude were measured with a laser surveyor (SET510S, Sokkia Topcon, Atsugi, Japan). The 9 GCPs were marked on the raw images, and the image reflectance was adjusted for the reflectance data of the calibration panel before and after each flight. The raw spectral images were then processed in Pix4Dmapper to reconstruct 4-band ortho-mosaic images. The raw RGB images were processed similarly but without irradiance calibration.
Six VIs () were calculated from the pixel data of the spectral ortho-images, and VI maps were created in QGIS v. 3.1 software (QGIS Development Team). Three NDSIs – the (red) normalized difference vegetation index (NDVI, Rouse et al., Citation1974), green NDVI (GNDVI, Gitelson et al., Citation1996), and red edge NDVI (NDRE, Rodriguez et al., Citation2006) – were calculated as follows:
Table 2. Vegetation indices (VIs), their equations and references
where NIR is the reflectance value of NIR and x is that of green, red, or red edge.
One RSI – the simple ratio (SR) – was calculated as follows (Jordan, Citation1969):
where Red is the reflectance value of red.
Two other RSIs – the chlorophyll index green (CIgreen) and the chlorophyll index red edge (CIred edge) – were calculated as follows (Gitelson et al., Citation2003):
where y is the reflectance value of green or red edge.
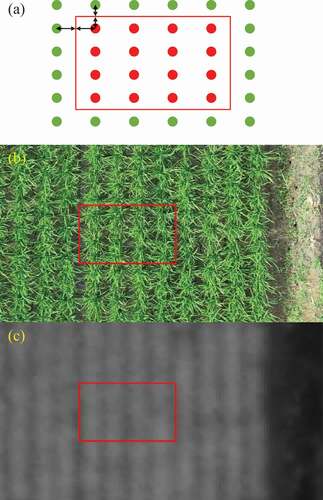
Determination of VIs and cumulative solar radiation of the canopy at harvest
We defined the harvested area for the determination of plant nitrogen content and the number of spikelets as a shape file based on the RGB ortho-images at the beginning of growth, in QGIS v. 3.1. Harvested area was considered as a rectangle with the intermediate lines between the harvested hills and the surrounding hills as the long and short sides (). From each VI map, VI values were averaged over pixels in the area defined by the shape file. For the analysis of plant nitrogen content, VI values captured just before harvest (within 2 days) were used. For the analysis of the number of spikelets per unit area, CIgreen at 15 days before heading, CIG15, were used. Since VI data could not be obtained precisely at 15 days before heading at each plot, the periodic VI data were fitted to a cubic curve and values on the exact dates were interpolated. For each harvested area, the cumulative solar radiation in the 15 days before heading, CSR15, was calculated.
Figure 1. A schematic image of harvested area.
Statistical analysis
Multiple regression analysis was conducted to determine the regression coefficients of CIG15 and CSR15 in SPSS v. 21 software (SPSS Inc., Chicago, IL, USA). The root-mean-square error (RMSE) was calculated as:
where is the estimated number of spikelets, yi is the measured number of spikelets, and n is the number of samples.
Results
Heading dates varied in the range of 3–5 days in each crop in both cultivars, depending on the location of the plot and the nitrogen application rate. In general, heading dates were later in the plots located nearer the water inlet. The daily mean temperature and cumulative solar radiation are summarized semimonthly between the first half of May and the first half of August (). Overall, daily mean temperature was lower in 2020 than in 2019. From the first half of July to the first half of August, which covered most of the reproductive period of both crops of both cultivars, the cumulative solar radiation was also 20%–40% lower in 2020 than in 2019. Across the stages, treatments, and years, plant nitrogen content ranged from 1.9 to 9.8 g m−2 in Koshihikari and from 4.3 to 16.7 g m−2 in Ishikawa 65. The number of spikelets ranged from 12,000 to 33,000 m−2 in Ishikawa 65 and from 16,000 to 32,000 m−2 in Koshihikari. The number of panicles ranged from 140 to 370 m−2 in Ishikawa 65 and from 250 to 490 m−2 in Koshihikari. The number of spikelets per panicle ranged from 79 to 131 in Ishikawa 65 and from 54 to 97 in Koshihikari.
Table 3. Semimonthly daily mean temperature and cumulative solar radiation (MJ m−2) from the first half of May to the first half of August
shows the relations between the above ground nitrogen content in rice plants and each VI. Whereas only CIgreen was linearly associated with plant nitrogen content; the other VIs become saturated at higher plant nitrogen content. The coefficients of determination (R2) between VI and plant nitrogen content were higher in green-based VIs (CIgreen, R2 = 0.837, P< 0.001; and GNDVI, R2 = 0.834, P < 0.001) than in red-based (NDVI and SR) and red-edge-based VIs (NDRE and CIred edge). NDSIs (NDVI, GNDVI, and NDRE) were more prone to saturation than RSIs (SR, CIgreen, and CIred edge). NDVI was the most prone to saturation, becoming saturated at plant nitrogen content > 5 g m−2, although the coefficient of determination was moderately high (R2 = 0.821, P < 0.001). The regression coefficients between plant nitrogen content and CIgreen calculated solely for Ishikawa 65 and Koshihikari were 0.591 and 0.615 and the interception 1.863 and 1.567, respectively. There was no significant difference in the regression coefficient and interception between cultivars.
Figure 2. Relations between plant nitrogen content and vegetation indices (VIs). The closed circles denote Isihkawa 65 and the open Koshihikari. Lines correspond the best fit function. n = 108.
Since CIgreen was linearly associated with plant nitrogen content at the reproductive stage and they had the highest coefficient of determination, we plotted the number of spikelets per area against CIgreen at 15 days before heading, CIG15. There were highly significant positive correlations in both cultivars (R2 = 0.618 in Ishikawa 65, R2 = 0.891 in Koshihikari, both P < 0.001, ). In the relations between the number of spikelets per unit area and CIG15, the number of spikelets was higher in 2019 at a given CIG15 than in 2020 in both cultivars.
Figure 3. Relations between CIG15 and the number of spikelets in Ishikawa 65 and Koshihikari. The closed circles denote 2019 and the open 2020. ***Significant at 0.001 level (n = 54 in Ishikawa 65; n = 30 in Koshihikari).
Multiple regression analysis was conducted with the number of spikelets as the dependent variable and with CIG15 and cumulative solar radiation in the 15-day period before heading (CSR15) as independent variables. CSR15 was higher in 2019 than in 2020 in both cultivars (). Overall regressions were highly significant and had high coefficient of determination in both cultivars (R2 = 0.750 in Ishikawa 65, R2 = 0.919 in Koshihikari, both P < 0.001, ). The regression coefficients for both CIG15 and CSR15 were positive in both cultivars, and that for CIG15 was higher in Koshihikari than in Ishikawa 65.
Table 4. Cumulative solar radiation (MJ m−2) in the 15-day period before heading at each plot
Table 5. Multiple regression analysis with the number of spikelets per unit area as a dependent variable and CIG15 and CSR15 as independent variables
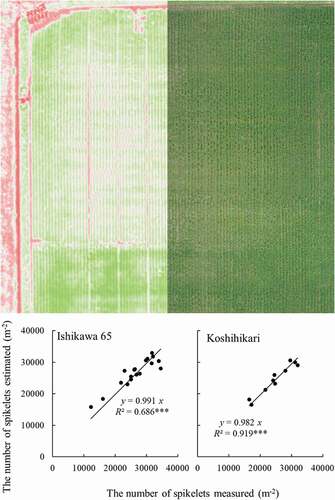
We determined the regression coefficients of CIG15 and CSR15 for each cultivar using a dataset of 2 randomly selected replications from the 3 replications in each treatment in both years. Using these regression coefficients, we estimated the number of spikelets in the rest of the dataset. shows the relations between measured and estimated number of spikelets per unit area. The coefficient of determination and the slope of the regression line forced to go through the origin were 0.686 and 0.991 in Ishikawa 65 and 0.919 and 0.982 in Koshihikari. The RMSE was 1908 m−2 in Ishikawa 65 and 1527 m−2 in Koshihikari.
Figure 4. Relations between the number of spikelets measured and that estimated in Ishikawa 65 and Koshihikari. ***Significant at 0.001 level (n = 18 in Ishikawa 65; n = 10 in Koshihikari).
Discussion
NDSIs were more prone to saturation than RSIs when calculated with the same spectral data (). NDVI became saturated at the lowest plant nitrogen content, >5 g m−2. This result is consistent with previous reports that NDVI is prone to saturation and loses sensitivity when canopy coverage exceeds a certain level (Erdle et al., Citation2011; Li et al., Citation2014; Nguy-Robertson et al., Citation2012; Vina et al., Citation2011). At the reproductive stage in rice, when plant nitrogen content usually exceeds 5 g m−2, therefore, NDVI is not an appropriate VI to estimate plant nitrogen content, although it had a moderately high coefficient of determination value.
CIgreen had the highest coefficient of determination with aboveground nitrogen content (R2 = 0.837), followed closely by GNDVI (R2 = 0.834); both are based on green reflectance (). They had much higher R2 values than the other VIs, especially those based on red edge reflectance. RSIs and NDSIs calculated from NIR and red edge or green data have high coefficient of determination with green LAI in maize and soybean (Vina et al., Citation2011), plant nitrogen content in maize (Li et al., Citation2014), and canopy chlorophyll content in crops including rice (Inoue et al., Citation2016). In these reports; however, the RSI and NDSI show higher estimation accuracy when based on red edge than on green. The lower coefficient of determination between plant nitrogen content and VIs based on red edge than on green in our study is inconsistent with these previous studies. The reason for this inconsistency may be the actual reflectance bands used for red edge and NIR. Whereas the Sequoia camera captures reflectance at 730–740 nm for red edge and 770–810 nm for NIR (instruction manual), other researchers used red edge/NIR bands of 704–710/771–786 nm (Vina et al., Citation2011), 720–740/760–780 nm (Li et al., Citation2014), and 704/815 nm (Inoue et al., Citation2016). Inoue et al. (Citation2016) showed that coefficient of determination between VI and canopy chlorophyll content changes drastically with a small change in the band region used in both the NIR and red edge regions. Using the same multispectral camera (Sequoia) as our study, Tambo et al. (Citation2021) showed that the coefficient of determination of leaf nitrogen content of soybean plants with CIgreen or GNDVI was higher than that with CIred edge or NDRE. Although more data and analysis are needed for clarification, we used CIgreen to estimate the number of spikelets on account of its high coefficient of determination and linear association with plant nitrogen content as high as 15 g m−2.
There were highly significant positive correlations between the number of spikelets and CIG15 in both cultivars (). Since CIgreen is a good indicator of the rice plant nitrogen content at the reproductive stage, this result seems to well agree with previous reports that plant nitrogen content at the late spikelet differentiation stage (approximately 15 days before heading) affects the number of spikelets differentiated (Kobayasi & Horie, Citation1994; Wada, Citation1969) and thus the number of spikelets (Kamiji et al., Citation2011; Wada & Cruz, Citation1989; Yoshida et al., Citation2006). In both cultivars, however, the number of spikelets was higher at a given CIG15 in 2019 than in 2020. A reason for this could be the higher solar radiation before heading in 2019 than in 2020, which could have enhanced dry matter production. The survival and successful development of the differentiated spikelet primordia depend on the assimilate status at the late reproductive stage (approximately 2 weeks before heading) (Kobayasi et al., Citation2001; Wada, Citation1969). The lower coefficient of determination between CIG15 and the number of spikelets per area in Ishikawa 65 can be partly explained by the larger differences in CSR15 between years and between crops in this cultivar than in Koshihikari.
The number of spikelets was well explained by multiple regression with CIG15 and CSR15 as independent variables (). Both regression coefficients were positive, indicating that both independent variables positively contributed to the number of spikelets per unit area. Wada (Citation1969) hypothesized that the number of spikelets per area is the difference between the numbers of spikelets differentiated (correlated with plant nitrogen content at the late stage of spikelet differentiation) and the number degenerated (correlated with crop growth rate in the period between the late stage of spikelet differentiation and heading). Yoshida et al. (Citation2006) explained the number of spikelets well from the plant nitrogen content at 2 weeks before heading and crop growth rate during the 2 weeks before heading by model-based analysis. Our result agrees well with those reports. Since CIgreen can be considered to represent plant nitrogen content, a higher CIG15 would increase the number of spikelets differentiated. The higher CSR15 in 2019 would have increased dry matter production and reduced the ratio of spikelets degenerated, resulting in the higher number of spikelets per area at a given CIG15.
Using the regression coefficients of CIG15 and CSR15 obtained from two-thirds of the dataset, the model estimated the number of spikelets fairly well in the rest of the dataset, as 13,000–35,000 in Ishikawa 65 (RMSE = 1908) and 16,000–32,000 in Koshihikari (RMSE = 1527) (). As the number of spikelets recommended in Ishikawa Prefecture to maximize grain yield with satisfactory grain quality under average climate conditions is 31,000 for Ishikawa 65 and 28,000 for Koshihikari (Nakamura, Citation2018), the range of the estimates was wide enough for practical use. The difference in experimental design for each cultivar would not affect robustness of the model because the ranges of the number of panicles per unit area and that of spikelets per panicle were similar between cultivars. This method will enable the estimation of the number of spikelets over a wide area. The grain quality of rice is highly associated with the number of spikelets (Tsukaguchi & Iida, Citation2008; Tsukaguchi et al., Citation2016a, Citation2016b). Thus, our results could be used for precise management to achieve high yield with satisfactory grain quality.
Our results could be used in breeding of cultivars with higher nitrogen use efficiency in spikelet production. Previous studies reported large cultivar differences in the relation between the number of spikelets per area and plant nitrogen content at late spikelet differentiation stage or heading stage, and modern high-yielding cultivars have more spikelets per area at a given plant nitrogen content, giving a higher nitrogen use efficiency (Ding & Maruyama, Citation2004; Kamiji et al., Citation2011; Yamamoto et al., Citation1991; Yoshida et al., Citation2006; Yoshinaga et al., Citation2013). The relation between CIG15 and the number of spikelets per unit area could be useful to detect a difference in nitrogen use efficiency in spikelet production. Interestingly, the number of spikelets per unit area at a given CIG15 was higher in Koshihikari than in Ishikawa 65 (). The regression coefficient of CIG15 in Koshihikari was higher (4697) than that in Ishikawa 65 (2614) (). These results imply that Ishikawa 65 has a lower nitrogen use efficiency for spikelet production, which agrees well with the report of Nakamura (Citation2018) that much more nitrogen application is necessary for Ishikawa 65 than for Koshihikari in Ishikawa prefecture, although Ishikawa 65 has a higher yield potential owing to its strong culm and lodging tolerance. Since Ishikawa 65 is a high-quality cultivar with a high-yield potential, increasing the nitrogen use efficiency in spikelet production may be the next target for breeding a low-input, high-yield, high-quality rice cultivar. While further testing is required to see whether the same regression between plant nitrogen content and CIgreen can be used for cultivars with different plant types (e.g. plant height, number of tillers, angle of leaf blades), the slope of the number of spikelets against CIG15 could be a good indicator of nitrogen use efficiency in spikelet production, and could be used in breeding or for phenotyping in genetic analysis for higher nitrogen efficiency.
In conclusion, CIgreen had the highest coefficient of determination (R2) with plant nitrogen content at the reproductive stage among 6 VIs tested and was the only VI with a linear relation with plant nitrogen content. The number of spikelets per unit area was well explained by multiple regressions with CIgreen at 15 days before heading (CIG15) and cumulative solar radiation in the 15 days before heading (CSR15) as independent variables. A higher CIG15 would increase the number of spikelets differentiated and a higher CSR15 would reduce the degeneration rate through increasing dry matter production. Using the obtained regression coefficients, a fairly accurate estimation of the number of spikelets per area is possible. These results could be used for precise management to increase grain quality and for breeding higher nitrogen use efficiency in spikelet production.
Disclosure statement
No potential conflict of interest was reported by the author(s).
Additional information
Funding
References
- Ding, Y., & Maruyama, S. (2004). Proteins and carbohydrates in developing rice panicles with different number of spikelets. Plant Production Science, 7(1), 16–21. https://doi.org/https://doi.org/10.1626/pps.7.16
- Duan, T., Chapman, S. C., Guo, Y., & Zheng, B. (2017). Dynamic monitoring of NDVI in wheat agronomy and breeding trials using an unmanned aerial vehicle. Field Crops Research, 210, 71–80. https://doi.org/https://doi.org/10.1016/j.fcr.2017.05.025
- Erdle, K., Mistele, B., & Schmidhalter, U. (2011). Comparison of active and passive spectral sensors in discriminating biomass parameters and nitrogen status in wheat cultivars. Field Crops Research, 124(1), 74–84. https://doi.org/https://doi.org/10.1016/j.fcr.2011.06.007
- Gitelson, A. A., Gritz, Y., & Merzlyak, M. N. (2003). Relationships between leaf chlorophyll content and spectral reflectance and algorithms for non-destructive chlorophyll assessment in higher plant leaves. Journal of Plant Physiology, 160(3), 271–282. https://doi.org/https://doi.org/10.1078/0176-1617-00887
- Gitelson, A. A., Kaufman, Y. J., & Merzlyak, M. N. (1996). Use of a green channel in remote sensing of global vegetation from EOS-MODIS. Remote Sensing of Environment, 58(3), 289–298. https://doi.org/https://doi.org/10.1016/S0034-4257(96)00072-7
- Hoshikawa, K. (1989). The growing rice plant. Nobunkyo, Japan.
- Inoue, Y., Guerif, M., Baret, F., Skidmore, A., Gitelson, A., Schlerf, M., Darvishzadeh, R., & Olioso, A. (2016). Simple and robust methods for remote sensing of canopy chlorophyll content: A comprehensive analysis of hyperspectral data for different types of vegetation. Plant, Cell & Environment, 39(12), 2609–2623. https://doi.org/https://doi.org/10.1111/pce.12815
- Jordan, C. F. (1969). Derivation of leaf-area index from quality of light on forest floor. Ecology, 50(4), 663. https://doi.org/https://doi.org/10.2307/1936256
- Kamiji, Y., Yoshida, H., Palta, J. A., Sakuratani, T., & Shiraiwa, T. (2011). N applications that increase plant N during panicle development are highly effective in increasing spikelet number in rice. Field Crops Research, 122(3), 242–247. https://doi.org/https://doi.org/10.1016/j.fcr.2011.03.016
- Kobayasi, K., & Horie, T. The effect of plant nitrogen condition during reproductive stage on the differentiation of spikelets and rachis branches in rice. (1994). Japanese Journal of Crop Science, 63(2), 193–199. (in Japanese with English Abstract). https://doi.org/https://doi.org/10.1626/jcs.63.193
- Kobayasi, K., Yamane, K., & Imaki, T. (2001). Effects of non-structural carbohydrates on spikelet differentiation in rice. Plant Production Science, 4(1), 9–14. https://doi.org/https://doi.org/10.1626/pps.4.9
- Li, F., Mial, Y., Feng, G., Yuan, F., Yue, S., Gao, X., Liu, Y., Liu, B., Ustin, S. L., & Chen, X. (2014). Improving estimation of summer maize nitrogen status with red edge-based spectral vegetation indices. Field Crops Research, 157, 111–123. https://doi.org/https://doi.org/10.1016/j.fcr.2013.12.018
- Matsushima, S. (1980). Rice cultivars for the million. Japan Scientific Societies Press.
- Nakamura, K. (2018). Breeding and characters of new rice cultivar ‘Hyakumangoku’ (Ishikawa 65). Hokuriku Crop Science, 53, 59–61. (in Japanese).
- Nguy-Robertson, A. L., Gitelson, A. A., Peng, Y., Vina, A., Arkebauer, T., & Rundquist, D. (2012). Green leaf area index estimation in maize and soybean: Combining vegetation indices to achieve maximal sensitivity. Agronomy Journal, 104(5), 1336–1347. https://doi.org/https://doi.org/10.2134/agronj2012.0065
- Rodriguez, D., Fitzgerald, G. J., Belford, R., & Christensen, L. (2006). Detection of nitrogen deficiency in wheat from spectral reflectance indices and basic crop eco-biophysiological concepts. Australian Journal of Agricultural Research, 57(7), 781–789. https://doi.org/https://doi.org/10.1071/AR05361
- Rouse, J. W., Haas, R. H., Well, J. A., & Deering, D. W. (1974). Monitoring vegetation systems in the great plains with ERTS. Proceedings, Third Earth Resources Technology Satellite-1 Symposium (pp. 3010–3017). Greenbelt, NASA SP-351.
- Sankaran, S., Khot, L. R., Espinoza, C. Z., Jarosmasjed, S., Ssthuvalli, V. R., Vandemark, G. J., Miklas PN, Carter AH, Pumphrey MO, Knowles NR, Pavek, M. J. (2015). Low-altitude, high-resolution aerial imaging systems for row and field crop phenotyping: A review. European Journal of Agronomy, 70, 112–123. https://doi.org/https://doi.org/10.1016/j.eja.2015.07.004
- Tambo, A., Shimada, M., Yoshifuji, A., Imamoto, Y., Nagahata, H., Fujihara, Y., & Tsukaguchi, T. (2021). Analysis of soybean yield using vegetative index captured with UAV. Japanese. Journal of Crop Science, 90(3), 261–268. (in Japanese with English Abstract).
- Tsukaguchi, T., & Iida, Y. (2008). Effects of assimilate supply and high temperature during grain-filling period on the occurrence of various types of chalky kernels in rice plants (Oryza sativa L.). Plant Production Science, 11(2), 203–210. https://doi.org/https://doi.org/10.1626/pps.11.203
- Tsukaguchi, T., Nitta, S., & Matsuno, Y. (2016a). Cultivar differences in the grain protein accumulation ability in rice (Oryza sativa L.). Field Crops Research, 192, 110–117. https://doi.org/https://doi.org/10.1016/j.fcr.2016.04.022
- Tsukaguchi, T., Taniguchi, Y., & Ito, R. (2016b). The effects of nitrogen uptake before and after heading on grain protein content and the occurrence of basal- and back-white grains in rice (Oryza sativa L.). Plant Production Science, 19(4), 508–517. https://doi.org/https://doi.org/10.1080/1343943X.2016.1223527
- Vina, A., Gitelson, A. A., Nguy-Robertson, A. L., & Peng, Y. (2011). Comparison of different vegetative indices for the remote assessment of green leaf area index of crops. Remote Sensing of Environment, 115(12), 3468–3478. https://doi.org/https://doi.org/10.1016/j.rse.2011.08.010
- Wada, G. (1969). The effect of nitrogenous nutrition on the yield determining process of rice plant. In Bulletin of the national institute of agricultural sciences A16 (pp. 27–167). National institute of agricultural sciences Japan.
- Wada, G., & Cruz, P. C. S. (1989). Varietal difference in nitrogen response of rice plants with special reference to growth duration. Japanese Journal of Crop Science, 58(4), 732–739. https://doi.org/https://doi.org/10.1626/jcs.58.732
- Yamamoto, Y., Yoshida, T., Enomoto, T., & Yoshikawa, G. (1991). Characteristics for the efficiency of spikelet production and the ripening in high-yielding japonica–indica hybrid and semidwarf indica rice varieties. Japanese Journal of Crop Science, 60(3), 365–372. (in Japanese with English Abstract). https://doi.org/https://doi.org/10.1626/jcs.60.365
- Yoshida, H., Horie, T., & Shiraiwa, T. (2006). A model explaining genotypic and environmental variation of rice spikelet number per unit area measured by cross-locational experiments in Asia. Field Crops Research, 57, 71–85. https://doi.org/https://doi.org/10.1016/j.fcr.2005.11.004
- Yoshida, S. (1981). Fundamentals of rice crop science (1–269). International rice research institute, Los Baños, Philippines.
- Yoshinaga, S., Takai, T., Sanoh, Y. A., Ishimaru, T., & Kondo, M. (2013). Varietal differences in sink production and grain-filling ability in recently developed high yielding rice (Oryza sativa L.) varieties in Japan. Field Crops Research, 150, 74–82. https://doi.org/https://doi.org/10.1016/j.fcr.2013.06.004