 ?Mathematical formulae have been encoded as MathML and are displayed in this HTML version using MathJax in order to improve their display. Uncheck the box to turn MathJax off. This feature requires Javascript. Click on a formula to zoom.
ABSTRACT
Nitrogen (N) partitioning to grain affects productivity and grain quality in rice. The objectives of this study were to clarify the difference between the rice cultivars ‘Momiroman’ (japonica) and ‘Takanari’ (indica) in the relation between the amount of total N in aboveground parts per grain dry weight (TNA/GW) and grain N concentration (GNC), to identify quantitative trait loci (QTLs) associated with the coefficient characterizing this relation by using populations derived from a cross between Momiroman and Takanari, and to verify the effects of the detected QTLs by using near-isogenic lines (NILs). We used 156 F2 plants grown under high N in 2015 and 156 F3 lines grown under high or low N in 2016, and determined N concentrations and contents in grain and aboveground vegetative parts. We found a logarithmic relation between GNC and TNA/GW in Momiroman and Takanari. The regression coefficient (A) was higher in Takanari. Under each N condition, A was calculated for each population and QTL analysis was performed. QTLs for A were detected on chromosomes (Chrs.) 6 and 10 in all conditions; the Takanari alleles of both QTLs increased the value. NILs with the Takanari allele in each region had higher A than NILs with the Momiroman alleles. We conclude that the QTLs for A are associated with N partitioning to grain in rice.
Abbreviations: GNA, amount of N in grain; GNC, grain N concentration; GW, grain dry weight; TNA, amount of N in aboveground parts
Graphical abstract
KEYWORDS:
Introduction
Nitrogen (N) partitioning to grain is crucial for productivity and grain quality in rice. The partitioning of more N to grain increases the remobilization of N from leaves, resulting in an earlier decline in biomass production (Hirel et al., Citation2007; Masclaux-Daubresse et al., Citation2008). Grain protein concentration is one of the components of grain quality and affects N partitioning to grain. Whereas grain with low protein concentration is preferred in Japan (Matsue et al., Citation2001), high protein concentration may be required from the viewpoint of nutrition (Gomez & De Datta, Citation1975; Hillerislambers et al., Citation1973). Therefore, the regulation of grain protein concentration could be a key for increasing productivity and improving grain quality, so the clarification of genetic factors underlying this process is necessary.
Many quantitative trait loci (QTLs) for grain protein concentration have been reported (Hu et al., Citation2004; Kashiwagi & Munakata, Citation2018; Tan et al., Citation2001; Yang et al., Citation2015; Ye et al., Citation2010; Zheng et al., Citation2011). Terao and Hirose (Citation2015) reported that sd1 is associated with grain protein concentration. Interactions between genotype and environment or management strongly affect grain protein concentration (Koutroubas & Ntanos, Citation2003; Perez et al., Citation1996; Singh et al., Citation1998; Tirol-Padre et al., Citation1996; Tsukaguchi et al., Citation2016), and QTLs detected for grain protein concentration vary among environments (Ye et al., Citation2010). Therefore, grain protein concentration as such may not be an appropriate measure of N partitioning to grain.
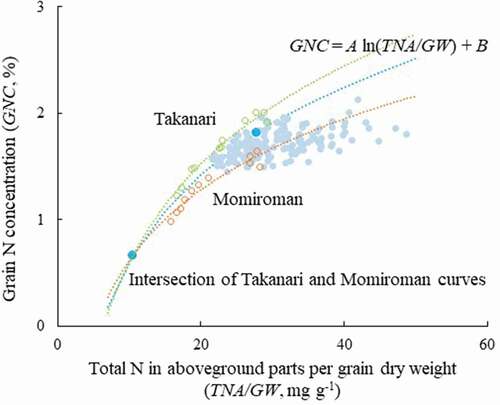
Tsukaguchi et al. (Citation2016) found a close relation between grain protein concentration and the amount of N available for grain, which is the sum of the amount of N uptake during the grain-filling period and the N in vegetative parts that can be remobilized and translocated to grain (Yoshida & Horie, Citation2009). The relation between grain protein concentration and N availability varies widely among cultivars; Tsukaguchi et al. (Citation2016) proposed that the coefficient of the relation shows the intrinsic ability of a cultivar to accumulate protein and can be used as phenotypic data for genetic analysis. ‘Takanari’, a high-yielding indica-type cultivar (Imbe et al., Citation2004), showed high ability to accumulate protein in grains, and ‘Momiroman’, a high-yielding japonica-type cultivar (Hirabayashi et al., Citation2010), markedly lower than Takanari. Because Momiroman and Takanari are high yielding with large sink size and contrasting in N partitioning to grain, we considered that these cultivars are good materials for genetic analysis of N partitioning to grain. In genetic analysis using many lines, however, the calculation of N availability is not realistic because analysis of the N content in each organ at heading and maturity takes a great deal of time and labor. Here, therefore, we considered the relation between grain N concentration (GNC) and total N in the aboveground parts (TNA) divided by grain dry weight (GW), which can be assessed at maturity. The relation between TNA and the amount of N in grain (GNA) indicates the proportion of N partitioned to grain and both TNA and GNA was divided by GW to eliminate the effect of GW on this relation. In this case, however, the regression coefficient shows the ability for N accumulation in grains, N remobilization, and N translocation from vegetative parts, because TNA includes the N that cannot be remobilized and translocated.
The objectives of this study were (i) to clarify the relation between GNC and TNA/GW in Momiroman and Takanari, (ii) to calculate the parameter, A, characterizing this relation in populations derived from a cross between Momiroman and Takanari for QTL analysis, and (iii) to verify the effects of the detected QTLs using near-isogenic lines (NILs) with Takanari alleles. To calculate A, we assumed that the GNC–TNA/GW curve of each F2 plant or line passes through the intersection of the Takanari and Momiroman curves. The QTL analysis was performed using F2 plants grown under high N and F3 lines grown under high and low N.
Materials and methods
Plant materials
Momiroman and Takanari were crossed, an F1 plant was self-pollinated to obtain F2 seeds, and each F2 plant was self-pollinated to obtain F3 seeds. We excluded individuals or lines that showed a sterility (empty spikelet) rate of >25% in either generation and used 156 F2 plants in 2015, 156 F3 lines in 2016, and Momiroman and Takanari in both years. Plants were grown in a paddy field of the University Farm of Ishikawa Prefectural University, Nonoichi, Japan (36°02′N, 140°04′E), on a Gray Lowland soil. On 22 May 2015, F2 seedlings (24 days after sowing) were transplanted at a spacing of 30 cm between plants and rows, surrounded by 3 rows of Momiroman (not used for phenotyping). Ammonium sulfate was applied at 6 g N m−2 as basal fertilizer and every 2 or 3 days at the rate of 2 g N m−2 week−1 as a topdressing from the beginning of July to the second week of September. Momiroman and Takanari (10 plants each) were grown at the same spacing as the F2 plants and at the same N level (high N) or with no N topdressing (low N). F3 plants were grown under low or high N as above. On 24 May 2016, F3 seedlings (27 days after sowing) were transplanted (1 row per line, 10 plants per row) at a spacing of 15 cm between hills and 30 cm between rows in each N plot. Momiroman and Takanari (10 plants each per replication; 3 replications per N level) were grown at high N, low N, and 3 g m−2 of N topdressing at heading. The plots for each N level were surrounded by 3 rows of Momiroman. In both years, P (10 g m−2 as basal fertilizer and 4 g m−2 as a topdressing as calcium phosphate) and K (10 g m−2 as basal fertilizer and 4 g m−2 as a topdressing as potassium chloride) were applied. Weeds, insects, and diseases were controlled with standard chemicals as necessary.
Phenotyping
In the F2 population, heading date was determined as the date of first heading in a plant. In the F3 population, heading date was averaged over a line in each N condition. At maturity, the aboveground parts of F2 plants were harvested and separated into panicles and vegetative parts. Panicles were air-dried for about 2 weeks, then threshed and dehulled. Grains were weighed, grain moisture content was measured with a grain moisture meter (CD-5; Shizuokaseiki-Co., Shizuoka, Japan), and GW was estimated. The vegetative parts were oven-dried to a constant weight. In the F3 population, all 10 plants in each N condition were harvested, separated into panicles and vegetative parts, and weighed. Panicles and vegetative parts of one average-size tiller per plant were collected from all plants in each line as subsamples and weighed. Dry weights of the grains and vegetative parts of subsamples in each line were determined as for F2. From the fresh weight of the 10 plants and the fresh and dry weights of the subsamples, dry weights of grains and vegetative parts in each line were estimated. In the parental cultivars, three average-sized plants per replication in each N treatment were harvested, and dry weights of the grains and vegetative parts were determined.
The vegetative parts and grains of all samples were powdered in a cyclone sample mill (CSM-F1; Udy Co., CO, USA) with a 0.5-mm sieve. GNC and N concentration in vegetative parts were measured by the Dumas combustion method (NCH Analyzer, Sumika Chemical Analysis Service, Tokyo, Japan). The contents of N in grains and vegetative parts were calculated as N concentration × dry weight, and summed for TNA. The N contents in hulls and rachis branches were disregarded because they accounted for <2% of TNA in Momiroman and Takanari (data not shown).
For each F2 plant or F3 line under each N condition, we calculated the regression coefficient A of the logarithmic curve, assuming that the curve passes through the intersection of the curves of Momiroman and Takanari, as:
where x is TNA/GW and y is GNC of each F2 plant or F3 line under each N condition, and xi and yi are the coordinates of the intersection of the Momiroman and Takanari regression curves.
Genotyping
Genomic DNA was extracted from a young leaf of an F2 plant as described by Takeuchi et al. (Citation2008). Among 1000 SSR markers (McCouch et al., Citation2002), 96 were polymorphic between the parental cultivars. PCR mixtures (15 µL) contained 20 ng of DNA, GoTaq Green Master Mix (Promega Co., Madison, WI, USA), and 0.7 µM primers. The amplification profile was 2 min at 95°C; 35 cycles of 40s at 95°C, 1 min at 60°C, and 30s at 72°C; and a final 5 min at 72°C. Amplified products were electrophoresed in 2.0% agarose gel containing Midori Green Advance DNA Stain (Nippon Genetics Co., Tokyo, Japan).
QTL analysis
Linkage analysis was performed in MAPMAKER/EXP 3 software (Lander et al., Citation1987). The chromosome positions and effects of putative QTLs were determined by composite interval mapping in Windows QTL Cartographer 2.5 software (Wang et al., Citation2012). The threshold for QTL detection was based on 1000 permutation tests at P = 0.05.
Production and evaluation of NILs
For the production of NILs BC4F3, and BC4F4 lines, hybrids of Momiroman and Takanari were backcrossed to Momiroman. In each of the four backcrosses, we conducted foreground selection. We also conducted background selection on BC4F2 plants using 93 simple sequence repeat markers (Fig. S1) to obtain NILs 6A, 6B, 10A, and 10B. In NIL6B, Takanari alleles were introgressed into the chromosome region around markers RM589, RM204, RM3408, RM276, RM5885, and RM8226, whereas in NIL6A, Momiroman alleles covered this region. Takanari alleles were introgressed into some regions on chromosomes (Chrs.) 5 and 7. In NIL10B, Takanari alleles were introgressed in the region around RM3152, RM5620, RM6704, RM3773, RM4477, RM3451, and RM6673, whereas in NIL10A, Momiroman alleles covered this region. We used BC4F3 and BC4F4 plants to verify the effects of the QTLs identified here in 2020 and 2021. In both years, plants were grown under high and low N conditions. Seedlings about 30 days old were transplanted at a spacing of 30 cm between rows and 15 cm between hills, 1 plant per hill, on 22 May 2020 and 18 May 2021. For low N, only a basal dressing of 4 g m−2 N was applied; for high N, an additional 4 g m−2 N was topdressed at booting stage, about 3–5 days before heading in each line. At maturity, plants were sampled and evaluated as above. In 2020, we grew 30 plants of each line per N condition in 3 rows by 10 hills, and individually evaluated 6 plants in the central row and hills for total dry weight and the number of spikelets, as well as the traits assessed by QTL analysis. In 2021, the plots (13.5 m2) were arranged in a split-plot design (main plots N, subplots genotype) with 3 replicates, 6 plants in each.
Statistical analysis for the NIL experiment
Analysis of variance (ANOVA) was performed using IBM SPSS Statistics 25 (IBM, New York, NY, USA) according to the split plot design to assess genotypic difference and the effects of N level.
Results
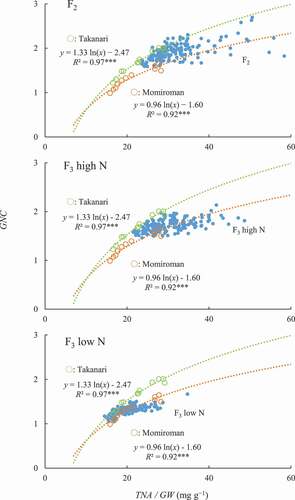
We found highly significant logarithmic relations between TNA/GW and GNC in both cultivars (R2 = 0.92 in Momiroman, R2 = 0.97 in Takanari, both P < 0.001; ), with R2 values higher than those of linear relations (R2 = 0.89 in Momiroman, R2 = 0.94 in Takanari, both P < 0.001). A was higher in Takanari (1.33) than in Momiroman (0.96), indicating that GNC was higher in Takanari at a given TNA/GW.
Figure 1. Relations between content of total N in aboveground parts per grain weight (TNA/GW) and grain N concentration (GNC).
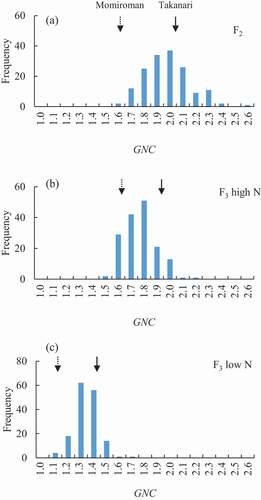
A values ranged widely (0.61–1.48 in F2, 0.55–1.55 in F3), with the peak somewhat higher in the F2 than in the F3 (). The range and the peak of the distributions were similar between N conditions in the F3 population. On the other hand, the GNC range was narrower and the peak was much lower in F3 under low N than in F2 and F3 under high N ().
Figure 2. Frequency distribution of coefficient A value in (A) 156 (Momiroman × Takanari) F2 plants and (B, C) 156 F3 lines under (B) high N and (C) low N.
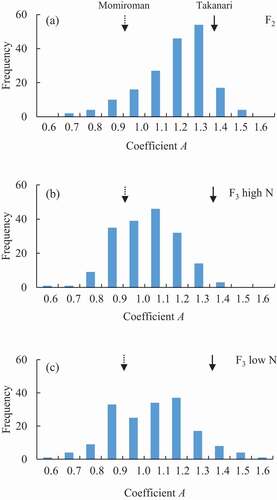
Figure 3. Frequency distribution of grain N concentration (GNC) in (A) 156 (Momiroman × Takanari) F2 plants and (B, C) 156 F3 lines under (B) high N and (C) low N.
Two QTLs for A were detected in all three populations, on Chrs. 6 and 10 (; ). The QTL on Chr. 6 explained 12.3%–20.0% and that on Chr. 10 explained 16.7%–26.9% of phenotypic variance in each population; both Takanari alleles increased A. In the F2, another QTL for A was detected on Chr. 11; the Takanari allele increased A.
Figure 4. Chromosomal locations of quantitative trait loci (QTLs) for days to heading, the coefficient A value, grain N concentration (GNC), total N in aboveground parts (TNA), grain dry weight (GW), and TNA/GW. Chromosome numbers are indicated above each linkage map. Symbols show peaks of logarithm of odds (LOD) and lines intervals of LOD > threshold values.
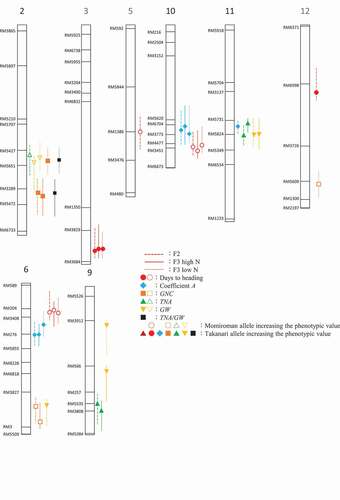
Table 1. Putative quantitative trait loci (QTLs) for regression coefficient A, days to heading, grain N concentration (GNC), grain dry weight (GW), the content of total N in aboveground parts (TNA), and TNA/GW in F2 plants and F3 lines derived from Momiroman × Takanari.
Three QTLs for days to heading were detected in all three populations, explaining 10.1%–27.1% of phenotypic variance; the Takanari allele on Chr. 3 and the Momiroman alleles on Chrs. 6 and 10 delayed heading (; ). In the F2 population, two other QTLs were detected on Chrs. 5 and 12 ().
A QTL for GNC was detected on Chr. 2 in all populations, explaining 8.3%–12.3% of phenotypic variance; the Takanari allele increased the value (; ). One QTL was detected on the long arm of Chr. 6 in the F2 population and in the F3 population under high N, explaining 15.6%–15.8% of phenotypic variance; the Momiroman allele increased the value (; ). In the F3 population, a QTL was detected on Chr. 12 under high N; the Takanari allele increased GNC ().
No QTLs common to all populations and conditions were detected for GW or TNA (; ). Three QTLs for GW were detected in the F2 and two in the F3 under each N condition. Three QTLs for TNA were detected in the F2 and two in the F3 under high N. In the region closely neighboring the QTL for GNC on Chr. 2, a QTL was detected in the F3 under each N condition; the Takanari allele increased the TNA/GW (; ).
A was significantly higher in NIL6B than in NIL6A in 2020 and 2021 (). There was no significant difference in total dry weight, TNA, the number of spikelets, GNA, or GNC between NIL6A and NIL6B in 2020 and 2021. GW was higher in NIL6B than in NIL6A in 2020. TNA/GW was higher in NIL6A than in NIL6B in 2020 and 2021. Interaction between genotypes and N level was significant in GNC (2020) and in TNA/GW (2020 and 2021). TNA/GW was markedly lower in NIL6B than in NIL6A under low N. Days to heading was 5–7 days shorter in NIL6B than in NIL6A in 2020 and 2021. The logarithmic relations between TNA/GW and GNC in both NILs were highly significant (R2 = 0.98 in NIL6A, R2 = 0.97 in NIL6B, both P < 0.001; 5). The regression coefficient was 1.01 in NIL6A and 1.14 in NIL6B.
Figure 5. Graphical genotypes of the near-isogenic lines NIL6A, NIL6B, NIL10A, and NIL10B. □ Homozygous for Takanari segment; ■ homozygous for Momiroman segment. Chromosome numbers are indicated above each linkage map.
Table 2. Days to heading, total dry weight (TW), grain dry weight (GW), content of total N in aboveground parts (TNA), number of spikelets per plant, content of N in grains (GNA), grain N concentration (GNC), coefficient A, and TNA/GW in NIL6A and NIL6B under high (H) and low (L) N in 2020.
Table 3. Days to heading, total dry weight (TW), grain dry weight (GW), content of total N in aboveground parts (TNA), number of spikelets per area, content of N in grains (GNA), grain N concentration (GNC), coefficient A, and TNA/GW in NIL6A and NIL6B under high (H) and low (L) N in 2021.
A and GNC were significantly higher in NIL10B than in NIL10A in 2020 and 2021 (). Interaction between genotypes and N level was significant in GNC in 2020 and 2021. The genotypic difference in GNC was larger under high N. There was no significant difference in total dry weight, GW, TNA, the number of spikelets, GNA, or TNA/GW in 2020 or 2021 between NIL10A and NIL10B. Days to heading was 5–7 days shorter in NIL10B than in NIL10A in 2020 and 2021. The logarithmic relations between TNA/GW and GNC in both NILs were highly significant (R2 = 0.89 in NIL10A, R2 = 0.94 in NIL10B, both P < 0.001; 5). The regression coefficient was 1.07 in NIL10A and 1.31 in NIL10B.
Table 4. Days to heading, total dry weight (TW), grain dry weight (GW), content of total N in aboveground parts (TNA), number of spikelets per plant, content of N in grains (GNA), grain N concentration (GNC), coefficient A, and TNA/GW in NIL10A and NIL10B under high (H) and low (L) N in 2020.
Table 5. Days to heading, total dry weight (TW), grain dry weight (GW), content of total N in aboveground parts (TNA), number of spikelets per area, content of N in grains (GNA), grain N concentration (GNC), coefficient A, and TNA/GW in NIL10A and NIL10B under high (H) and low (L) N in 2021.
Discussion
GNC was highly associated with TNA/GW in Momiroman and Takanari (). This relation clearly shows that GNC is determined by the regression coefficient A, an intrinsic characteristic of a cultivar, at a given TNA/GW that depended on N application. Although this relation is similar to that between GNC and the amount of N that can be used for grain filling (Tsukaguchi et al., Citation2016), the meanings of the regression coefficients are different. A here indicates not only the ability for N accumulation in grain (as in Tsukaguchi et al., Citation2016), but also that for N remobilization and translocation from vegetative parts, because TNA includes the N incorporated into structural materials that cannot be remobilized and translocated to grain (Yoshida & Horie, Citation2009). A could indicate the degree of N partitioning to grain, even though TNA/GW varies among genotypes.
In the F2 population (which was grown under high N) and the F3 population grown under high N, the range of the TNA/GW distribution was shifted toward higher values (), resulting in much higher GNC values, than in the F3 population under low N, which can be explained by the higher TNA/GW under high N. Several QTLs for GNC were detected and a QTL for GNC was detected on Chr. 2 under all conditions, where the Takanari allele increased the value. In a closely neighboring region, a QTL for TNA/GW was also detected in the F3 population under high and low N, where both Takanari alleles increased the value, and there was a (non-significant) LOD peak of TNA/GW (LOD = 4.7) in the F2 population (data not shown). It is possible that the QTL for GNC and that for TNA/GW are the same, with pleiotropic effects on GNC and TNA/GW and with Takanari alleles increasing the values. This result implies that some of the QTLs detected for GNC may also be associated with TNA/GW.
A for each F2 plant or F3 line was calculated as the increment of GNC with that of ln(TNA/GW) from the intersection of the Momiroman and Takanari regression curves. We consider the intersection to be a better base point than the origin because neither regression curve passes through the origin. N condition affected A much less than it affected GNC (). QTLs for A with significant LOD scores were detected on Chrs. 6 and 10; Takanari alleles of both increased the value in all conditions (; ). The QTLs for A were verified in the experiment using NILs (). NIL6B (with the Takanari allele at the QTL for A on Chr. 6; 6) had higher A than NIL6A (Momiroman allele on Chr. 6) and NIL10B (Takanari allele on Chr. 10) had higher A than NIL10A (Momiroman allele).
Figure 6. Relations between content of total N in aboveground parts per grain weight (TNA/GW) and grain N concentration (GNC) in NILs.
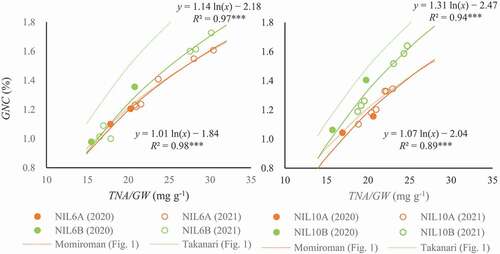
The relation between TNA/GW and GNC in Momiroman and Takanari () indicates that GNC can be increased by increasing either TNA/GW or A. We found (non-significant) LOD peaks of GNC (1.8–2.6) in the regions overlapping those for A on Chrs. 6 and 10, where Takanari alleles increased the values in all conditions, as well as (non-significant) LOD peaks of TNA/GW (1.8–3.0) in the same regions, where Momiroman alleles increased the values in all conditions (data not shown). Because a higher TNA/GW increases GNC, the LOD peaks of TNA/GW should be associated with those of GNC where alleles of the same parent increase the values, which were common to other LOD peaks of TNA/GW, significant or not. Among them were the QTLs for GNC and TNA/GW on Chr. 2 and a QTL for GNC on Chr. 6. The co-presence of the LOD peaks of GNC and TNA/GW, where alleles of the different parent increased the values, can be explained by the presence of the QTLs for A, i.e. increment of GNC with that of TNA/GW. NIL10B, with the Takanari allele at the QTL for A, had significantly higher GNC than NIL10A, which can be well explained by the higher A in NIL10B with no significant difference in TNA/GW between them (). On the other hand, there was no significant difference in GNC between NIL6B and NIL6A, which can be explained by the higher A in NIL6B but lower TNA/GW than in NIL6A (). The regression curves between TNA/GW and GNC shows higher GNC at a given TNA/GW in NIL6B than in NIL6A and higher GNC in NIL10B than in NIL10A ( 5). These results strongly suggest that A is associated with N partitioning to grain in the grain-filling period and thus with GNC, although further testing is required using NILs with narrower substituted regions to confirm this.
In regions similar to those of the QTLs for A on Chrs. 6 and 10, Zhou et al. (Citation2017) detected QTLs associated with N use efficiency (NUE), shown as grain yield per N uptake, the reciprocal of TNA/GW, using chromosome segment substitution lines between japonica and indica rice cultivars. QTLs associated with grain protein concentration were detected in regions similar to the QTL for A on Chr. 6 (Hu et al., Citation2004; Kashiwagi & Munakata, Citation2018; Zheng et al., Citation2011) and on Chr. 10 (Zheng et al., Citation2011) in populations derived from a cross between an indica cultivar and a japonica cultivar. The non-significant LOD peaks of TNA/GW or GNC in the regions overlapping QTLs for A shows the possibility that the QTLs for A are the same as those for NUE or grain protein concentration reported previously. Nevertheless, the QTLs for A with significant LOD scores were detected where no significant LOD score of TNA/GW nor GNC was detected in the populations we used, indicating the effectiveness of using A as phenotypic data in analysis to detect genetic factors associated with N partitioning.
QTLs associated with days to heading were detected on Chrs. 6 and 10 in regions overlapping those for A; both Momiroman alleles delayed heading in all populations and conditions (; ). Genotypes with later heading tend to have lower GNC owing to lower plant N concentration during the grain-filling period than those with earlier heading (Hillerislambers et al., Citation1973; Kido & Yanatori, Citation1965). To avoid the effect of days to heading on GNC, we applied heavy top dressing. A rice cultivar ‘Bekoaoba’ showed much lower A than Takanari whereas Bekoaoba headed earlier (recalculated from Tsukaguchi et al., Citation2016), implying that heading date is not the determinant of A. Still there is a possibility that A is affected by days to heading because heading date affects many traits by changing growth duration and thus the amount of intercepted radiation and N uptake. Further study is required to clarify the association between them.
High-yielding rice cultivars, such as Takanari and Momiroman, generally have higher N uptake ability than average cultivars (Ookawa et al., Citation2003; Yoshinaga et al., Citation2013); their NUE for sink production is also higher (Yoshida et al., Citation2006), resulting in higher N remobilization from vegetative parts, which may reduce biomass production ability and grain yield if N uptake in the later growth period is insufficient (Ida et al., Citation2009; Wada & Wada, Citation1991). In these high-yielding cultivars, the effect of A on N dynamics in plants during the grain-filling period would be enlarged. Jiang et al. (Citation2004) reported stay-green QTLs in similar regions on these chromosomes, which could also be associated with N dynamics in plants. These results imply that higher A accelerates N remobilization from vegetative parts, leading to earlier decline in dry matter production especially under low N. On the other hand, a QTL associated with single grain weight of tertiary spikelets was detected in a region similar to the QTL for A on Chr. 10 by QTL analysis using RILs between Takanari and Momiroman, where the Takanari allele increases the value (Nakano et al., Citation2019), which seems to contradict the above scenario because the lower-order spikelets that flower and fill later (Mohapatra et al., Citation1993) may be affected by dry matter production in the later grain-filling period. It is obscure whether the location of the QTL for A is distinctly different from that of the QTL associated with single grain weight of tertiary spikelets (Nakano et al., Citation2019) or the QTL for A complicatedly affects dry matter production and grain filling. Therefore, although the QTL for A could be useful improving productivity and grain quality through changing N partitioning to grain, further study is required.
In conclusion, we found a logarithmic relation between GNC and TNA/GW in Momiroman and Takanari. A was higher in Takanari than in Momiroman. A values were much less affected by N condition than was GNC, which was distributed in a much lower range in the F3 population under low N than in F2 and F3 under high N. QTLs for A were detected on Chrs. 6 and 10 in all populations, and the Takanari alleles at both increased the value. NIL6B, with the Takanari allele at the QTL for A, had higher A than NIL6A, with the Momiroman allele. NIL10B, with the Takanari allele at the QTL for A on Chr. 10, had higher A than NIL10A, with the Momiroman allele. These results verify the QTLs for A. Further, A was suggested to be associated with N partitioning to grain.
Acknowledgments
This work was partially supported by JSPS KAKENHI Grant Number 19K06004.
Disclosure statement
No potential conflict of interest was reported by the author(s).
References
- Gomez, K. A., & De Datta, S. K. (1975). Influence of environment on protein content of rice 1. Agronomy Journal, 67(4), 565–568. https://doi.org/10.2134/agronj1975.00021962006700040029x
- Hillerislambers, D., Rutger, J. N., Qualset, C. O., & Wiser, W. J. (1973). Genetic and environmental variation in protein content of rice (Oryza sativa L.). Euphytica, 22(2), 264–273. https://doi.org/10.1007/BF00022634
- Hirabayashi, H., Nemoto, H., Ando, I., Kato, H., Oota, H., Satou, H., … Kaji, R. (2010). ‘Momiroman’, a new rice cultivar for feed use. Bulletin of the National Institute of Crop Science, 11, 31–47.
- Hirel, B., Gouis, J. L., Ney, B., & Gallais, A. (2007). The challenge of improving nitrogen use efficiency in crop plants: Towards a more central role for genetic variability and quantitative genetics within integrated approaches. Journal of Experimental Botany, 58(9), 2369–2387. https://doi.org/10.1093/jxb/erm097
- Hu, Z. L., Li, P., Zhou, M. Q., Zhang, Z. H., Wang, L. X., Zhu, L. H., & Zhu, Y. G. (2004). Mapping of quantitative loci (QTLs) for rice protein and fat content using double haploid lines. Euphytica, 135(1), 47–54. https://doi.org/10.1023/B:EUPH.0000009539.38916.32
- Ida, M., Ohsugi, R., Sasaki, H., Aoki, N., & Yamagishi, T. (2009). Contribution of nitrogen absorbed during ripening period to grain filling in a high-yielding rice variety, Takanari. Plant Production Science, 12(2), 176–184. https://doi.org/10.1626/pps.12.176
- Imbe, T., Akama, Y., Nakane, A., Hata, T., Ise, K., Ando, I., … Koga, Y. (2004). Development of a multipurpose high-yielding variety ‘Takanari’. Bulletin of the National Institute of Crop Science, 5, 35–51.
- Jiang, G. H., He, Y. Q., Xu, C. G., Li, X. H., & Zang, Q. (2004). The genetic basis of stay-green in rice analyzed in a population of doubled haploid lines derived from an indica by japonica cross. Theoretical Applied Genetics, 108(4), 688–698. https://doi.org/10.1007/s00122-003-1465-z
- Kashiwagi, T., & Munakata, J. (2018). Identification and characteristics of quantitative trait locus for grain protein content, TGP12, in rice (Oryza sativa L.). Euphytica, 214(9), 165. https://doi.org/10.1007/s10681-018-2249-5
- Kido, M., & Yanatori, S. (1965). Histochemical studies of protein accumulating process in rice grain. Japanese Journal of Crop Science, 34(2), 204–209. https://doi.org/10.1626/jcs.34.204
- Koutroubas, S. D., & Ntanos, D. A. (2003). Genotypic differences for grain yield and nitrogen utilization in Indica and Japonica rice under Mediterranean conditions. Field Crops Research, 83(3), 251–260. https://doi.org/10.1016/S0378-4290(03)00067-4
- Lander, E. S., Green, P., Abrahamson, J., Barlow, A., Daly, M. J., Lincoln, S. E., & Newberg, L. A. (1987). MAPMAKER: An interactive computer package for constructing primary genetic linkage maps of experimental and natural populations. Genomics, 1(2), 174–181. https://doi.org/10.1016/0888-7543(87)90010-3
- Masclaux-Daubresse, C., Reisdorf-Cren, M., & Orsel, M. (2008). Leaf nitrogen remobilization for plant development and grain filling. Plant Biology, 10(s1), 23–36. https://doi.org/10.1111/j.1438-8677.2008.00097.x
- Matsue, Y., Sato, H., & Uchimura, Y. (2001). The palatability and physicochemical properties of milled rice for each grain-thickness group. Plant Production Science, 4(1), 71–76. https://doi.org/10.1626/pps.4.71
- McCouch, S. R., Teytelman, L., Xu, Y., Lobos, K. B., Clare, K., Walton, M., Fu, B., Maghirang, R., & Xing, Y. (2002). Development and mapping of 2240 new SSR markers for rice (Oryza sativa L.). DNA Research, 9(6), 199–207. https://doi.org/10.1093/dnares/9.6.199
- Mohapatra, P. K., Patel, R., & Sahu, S. K. (1993). Time of flowering affects grain quality and spikelet partitioning within the rice panicle. Australian Journal of Plant Physiology, 20(2), 231–241. https://doi.org/10.1071/PP9930231
- Nakano, H., Takai, T., & Kondo, M. (2019). Identification of quantitative trait loci for panicle structure and grain filling using a cross between indica- and japonica- type high-yielding rice cultivars. Plant Production Science, 22(4), 443–455. https://doi.org/10.1080/1343943X.2019.1667836
- Ookawa, T., Naruoka, Y., Yamazaki, T., Suga, J., & Hirasawa, T. (2003). A comparison of accumulation and partitioning of nitrogen in plants between two rice cultivars, Akenohoshi and Nipponbare, at the ripening stage. Plant Production Science, 6(3), 172–178. https://doi.org/10.1626/pps.6.172
- Perez, C. M., Juliano, B. O., Liboon, S. P., Alcantara, J. M., & Cassman, K. G. (1996). Effects of late nitrogen fertilizer application on head rice yield, protein content, and grain quality of rice. Cereal Chemistry, 73(5), 556–560.
- Singh, U., Ladha, J. K., Castillo, E. G., Punzalan, G., Tirol-Padre, A., & Duqueza, M. (1998). Genotypic variation in nitrogen use efficiency in medium- and long-duration rice. Field Crops Research, 58(1), 35–53. https://doi.org/10.1016/S0378-4290(98)00084-7
- Takeuchi, Y., Hori, K., Suzuki, K., Nonoue, Y., Takemoto-Kuno, Y., Maeda, H., Sato, H., Hirabayashi, H., Ohta, H., Ishii, T., Kato, H., Nemoto, H., Imbe, T., Ohtsubo, K., Yano, M., & Ando, I. (2008). Major QTLs for eating quality of an elite Japanese rice cultivar, Koshihikari, on the short arm of chromosome 3. Breeding Science, 58(4), 437–445. https://doi.org/10.1270/jsbbs.58.437
- Tan, Y. F., Sun, M., Xing, Y. Z., Hua, J. P., Sun, X. L., Zhang, Q. F., & Corke, H. (2001). Mapping quantitative trait loci for milling quality, protein content and color characteristics of rice using a recombinant inbred line population derived from an elite rice hybrid. Theoretical Applied Genetics, 103(6–7), 1037–1045. https://doi.org/10.1007/s001220100665
- Terao, T., & Hirose, T. (2015). Control of grain protein contents through SEMIDWARF1 mutant alleles: Sd1 increases the grain protein content in Dee-geo-woo-gen but not in Reimei. Molecular Genetics and Genomics, 290(3), 939–954. https://doi.org/10.1007/s00438-014-0965-7
- Tirol-Padre, A., Ladha, J. K., Singh, U., Laureles, E., Punzalan, G., & Akita, S. (1996). Grain yield performance of rice genotypes at suboptimal levels of soil N as affected by N uptake and utilization efficiency. Field Crops Research, 46(1–3), 127–143. https://doi.org/10.1016/0378-4290(95)00095-X
- Tsukaguchi, T., Nitta, S., & Matsuno, Y. (2016). Cultivar differences in the grain protein accumulation ability in rice (Oryza sativa L.). Field Crops Research, 192, 110–117. https://doi.org/10.1016/j.fcr.2016.04.022
- Wada, Y., & Wada, G. (1991). Varietal difference in leaf senescence during ripening period of advanced indica rice. Japanese Journal of Crop Science, 60(4), 529–536. https://doi.org/10.1626/jcs.60.529
- Wang, S., Basten, C. J., & Zeng, Z. B. (2012). Windows QTL Cartographer 2.5. Department of Statistics, North Carolina State University. http://statgen.ncsu.edu/qtlcart/WQTLCart.htm
- Yang, Y., Guo, M., Li, R., Shen, L., Wang, W., Liu, M., Zhu, Q., Hu, Z., He, Q., Xue, Y., Tang, S., Gu, M., & Yan, C. (2015). Identification of quantitative trait loci responsible for grain protein content using chromosome segment substitution lines and fine mapping of qPC-1 in rice (Oryza sativa L.). Molecular Breeding, 35(6), 130. https://doi.org/10.1007/s11032-015-0328-z
- Ye, G., Liang, S., & Wan, J. (2010). QTL mapping of protein content in rice using single chromosome segment substitution lines. Theoretical Applied Genetics, 121(4), 741–750. https://doi.org/10.1007/s00122-010-1345-2
- Yoshida, H., Horie, T., & Shiraiwa, T. (2006). A model explaining genotypic and environmental variation of rice spikelet number per unit area measured by cross-locational experiments in Asia. Field Crops Research, 97(2–3), 337–343. https://doi.org/10.1016/j.fcr.2005.11.004
- Yoshida, H., & Horie, T. (2009). A process model for explaining genotypic and environmental variation in growth and yield of rice based on measured plant N accumulation. Field Crops Research, 113(3), 227–237. https://doi.org/10.1016/j.fcr.2009.05.010
- Yoshinaga, S., Takai, T., Sanoh, Y. A., Ishimaru, T., & Kondo, M. (2013). Varietal differences in sink production and grain-filling ability in recently developed high yielding rice (Oryza sativa L.) varieties in Japan. Field Crops Research, 150, 74–82. https://doi.org/10.1016/j.fcr.2013.06.004
- Zheng, L., Zhang, W., Chen, X., Ma, J., Chen, W., Zhao, Z., Zhai, H., & Wan, J. (2011). Dynamic QTL analysis of rice protein content and protein index using recombinant inbred lines. Journal of Plant Biology, 54(5), 321–328. https://doi.org/10.1007/s12374-011-9170-y
- Zhou, Y., Tao, Y., Tang, D., Wang, J., Zhong, J., Wang, Y., Yuan, Q., Yu, X., Zhang, Y., Wang, Y., Liang, G., & Dong, G. (2017). Identification of QTL associated with nitrogen uptake and nitrogen use efficiency using high throughput genotyped CSSLs in rice (Oryza sativa L.). Frontiers in Plant Science, 8, 1166. https://doi.org/10.3389/fpls.2017.01166