ABSTRACT
Rice production in Ghana is limited by low varietal choices, which puts farmers at a disadvantage in meeting the market demand for consumers. The objectives of this study were to (i) assess the yield potentials of improved rice varieties developed by the Africa Rice Center (AfricaRice), and (ii) to allow farmers to select improved varieties of their choice based on growth and yield, as observed in the field, in order to ensure a high adoption rate, increase productivity and food security. Two seasons (i.e. 2020 major and 2020–2021 minor) field experiments were conducted at two lowland within the Mankran watershed in the Ashanti region of Ghana. The experiment comprised thirteen (13) improved varieties and two local checks and was conducted using recommended good agronomic practices. The key findings of the study showed that growth and yield parameters vary significantly between varieties across locations. The biplot analysis showed that varieties FARO 66, SAHEL 317, and Amankwatia are the best in the major season while WITA 9, GT 11, ARS-957-BGJ-171-15-D-B, NERICA L36, and AGRA were the best in the minor season at both locations. Farmers’ preference for the varieties was based not only on growth and yield but on resistance to lodging, pests, and diseases. In conclusion, the best performing varieties have demonstrated yield potential which is about 92% higher than the yield of the local checks and can be recommended for adoption by farmers. Future breeding programs on these varieties should include the most preferred attributes by farmers in this study.
GRAPHICAL ABSTRACT
1. Introduction
In Ghana, rice is a strategic staple crop and its consumption is continuously increasing due to urbanization and change in consumers’ preferences (Ragasa & Chapoto, Citation2017). In the country, the crop is second after maize in terms of food source and income for most rural households (MoFA, Citation2017) and is grown in 0.33 million ha area with a productivity of 2.93 t ha−1 (FAOSTAT, Citation2021). The demand for rice is projected to outpace maize in the medium to long-term making rice not just a staple crop but an important food security crop. Therefore, boosting rice production is imperative in improving food security in Ghana (FAO, Citation2014; MiDA, Citation2010). Rice is cultivated in all the agro-ecological zones of the country ranging from the semi-deciduous to high rain-forest agro-ecological zones (Buri & Issaka, Citation2019; Issaka et al., Citation1996). Over the last decade, rice production in the country has seen a steady increase with an average annual production growth rate of about 5.3% mostly due to the expansion of the area under cultivation (Ouédraogo et al., Citation2021). However, the country is still only 40% self-sufficient in rice production while the remaining 60% is supplied from importation. In 2020, the cost for rice importation was about 1.25 billion USD (FAOSTAT, Citation2021). This situation threatens the rice self-sufficiency, food security, and economy of the country.
Several factors account for the low capacity of farmers to fully explore the potential of rice production systems and market opportunities across the country. One major factor is climate change-induced decrease in rainfall and increase in temperature and drought spells that have affected not only agricultural production in general but the rice production system in particular (FAO, Citation2019). Furthermore, the use of old released and traditional varieties, low use and/or inadequate management of inputs, weeds and pests management, and water-limited rice yield (Arouna et al., Citation2021; Bado et al., Citation2011; Devkota et al., Citation2021; Dossou-Yovo et al., Citation2022). To curtail these challenges, scientists and researchers have introduced various technologies such as improved rice varieties and good agronomic practices (Becker & Johnson, Citation2001; Dinesh et al., Citation2017). For instance, the Africa Rice Initiative (ARI) and the NERICA Rice Dissemination Project (NRDP) were both established in 2001 to improve rice production and enhance rice self-sufficiency in Africa including Ghana through the widespread dissemination and adoption of new and high-yielding rice varieties (Diagne, Citation2006). However, the adoption and integration of these technologies into farmers’ production practices have seen relatively less success (Asuming-Brempong et al., Citation2011). Asuming-Brempong et al. (Citation2011) have highlighted that only a 6% adoption of NERICA varieties as against a potential rate of 90% following their introduction to farmers in northern Ghana. One of the reasons for the low adoption rate of new varieties was incomplete exposure of farmers to the varieties, while participatory variety selection (PVS) helps to address this challenge (Joshi et al., Citation2012). These constraints are further exacerbated under rain-fed (lowlands and uplands) conditions, where 78% of rice is produced with limited resources, poor infrastructure, and limited access to ready market (Ouédraogo et al., Citation2021; Vlek et al., Citation2017).
To improve and ensure sustainable rice production and increase rice self-sufficiency in Ghana, a holistic approach that considers input use efficiency, preferred variety, good agronomic practices, and a standardized rice market is required (Devkota et al., Citation2022; Rodenburg et al., Citation2014). The use of improved rice varieties has been reported to positively impact rice yields and consequently food security and poverty alleviation in several countries including Ghana (Arouna et al., Citation2017; Mansaray & Jin, Citation2020; Scarrow, Citation2017).
Against the foregoing context, this study sought to (i) assess the yield potentials of thirteen (13) improved rice varieties developed by Africa Rice Center (AfricaRice), with farmers within the Mankran watershed in southern Ghana using Participatory Varietal Selection (PVS) approach and (ii) to allow farmers select improved varieties of their choice based on their most preferred attributes. Such a farmer-led PVS approach is expected to expose farmers to the attributes of improved varieties and enable a high adoption rate. Further, the study is intended to generate information that will greatly contribute to the success of the Government of Ghana’s (GoG’s) flagship program, namely Planting for Food and Jobs (PFJ) introduced in 2017, which focus on making key inputs such as improved seeds and fertilizers available to farmers, free extension services, and market prospects (MoFA, Citation2017).
2. Materials and methods
2.1 Study area and site selection
The experiment was conducted in two major rice-growing inland valleys (Adugyama located at 06° 53’ 3.4” N and longitude 1° 52’ 42.5” W and Biemso located at 06° 53’ 0.2” N and longitude 1° 51’ 2.8” W) in the Mankran watershed in the Ashanti region of Ghana. The study was conducted over two cropping seasons (i.e. 2020 major season and 2020–2021 minor season). The watershed has a bimodal rainfall pattern with the major rainy season spanning from March – July and the minor rainy season from September – November and annual mean temperatures between 27.5°C and 37.4°C. The Sawah system (i.e. integrated soil, nutrient and water management) has been practiced by farmers in both locations to grow rice all year round. The inland valleys of Adugyama and Biemso were selected because rice farmers in the area have been involved in several rice developmental projects and have adequate knowledge of good agronomic practices (GAPs) for rice production.
2.2 Soil characteristics
Soils at the sites are predominantly Eutric Gleyic and Eutric Gleyic Fluvisols. The soils in both inland valleys were classified as sandy loam with mean topsoil and subsoil pH of 6.5 and 7.3, respectively. The total soil organic carbon content at the study locations was characterized as low (in the upper 40 cm) () which limits nutrient storage and water-holding capacity to support rice growth. The mean total nitrogen content of soils at both inland valleys was Adugyama was 0.07% in the upper 40 cm. The overall N content of soils was lower than the critical level of 0.10% N required for improved and sustainable crop production in soils of the humid tropics. Similarly, available phosphorus was generally low and decreased with depth at both locations. The cation exchange capacity of soils was also low. The general nutrient status of the study locations was classified as low in agreement with previous report (Buri et al., Citation2010) ().
Table 1. Initial physico-chemical properties of soils in the experimental sites.
2.3 Rainfall distribution during the cropping seasons
The total rainfall was 807 and 411 mm during the major and minor seasons, respectively (). In the major and minor seasons, 81% and 49%, respectively of the total rainfall received was concentrated at the vegetative and reproductive stages of rice growth.
Figure 1. Rainfall amount during the major (a) and minor (b) seasons.
2.4 Experiment setup and crop management practices
Before the establishment of the trials, the land was cleared of all weeds, ploughed using a mini-tractor (i.e. 12–18 hp 2-wheel power tiller), and levelled. Then, the land was demarcated into smaller plots of 10 m × 2 m by constructing mini bunds around each plot.
Thirteen (13) newly introduced improved rice varieties from AfricaRice and two (2) local checks (AGRA and Amankwatia) were cultivated on these demarcated plots. The experiment was a single non-replicate trial arranged in a Randomised Complete Block Design (RCBD) with locations considered as factors (Potvin, Citation2020). The characteristics of these varieties are presented in . Seeds were first pre-germinated by broadcasting onto a wet bed nursery. At 21 days old, two seedlings were transplanted per hill at a distance of 20 cm × 20 cm on plots with water level of about 5 cm above the soil surface. Split application of an improved mineral fertilizer blend (NPK 15-20-20 + 0.7 Zn) was made where 300 kg ha−1 of NPK was applied 5 days after transplanting and 100 kg ha−1 of urea applied as top-dress 25 days after the basal fertilizer application. Weed control was mainly by ponding the field with water but a few water-resistant weeds were manually removed by hand. Pests and disease control were carried out by spraying recommended chemicals. Supplemental irrigation was applied when rainfall was inadequate to avoid water stress during the experiment.
Table 2. Characteristics of improved rice varieties evaluated.
2.5 Data collection
2.5.1 Yield and yield attributes
At maximum tillering stage, the number of tillers is counted within a 1-m2 quadrat at three random locations (served as replicates) for each of the varietal plots. Panicle number was counted in five randomly selected and tagged stands. Plant height was measured in the tagged stands at harvest using a meter rule. At harvest, rice yield was estimated for each varietal plot using a 1 m2 quadrat from three randomly selected locations excluding border rows. Threshed rice was oven dried at 65°C for 72 h. Grain yield and 1000 grains weight (GW) were measured for each variety using an electronic balance.
2.5.2 Participatory varietal selection and farmers’ assessment of the improved varieties
At physiological maturity, a varietal selection exercise (farmers’ day) was conducted for farmers within the catchment area of the watershed. About 100 people (i.e. 85 farmers and 15 Agricultural Extension Officers) who participated in ranking varieties, selected their best (preferred) first and second best performing and third (worst i.e. non-preferred) choices among the 15 rice varieties based on the appearance in the field. During this exercise, farmers were requested to answer a simple questionnaire with the list of rice varieties and suggested reasons for their choice (with the assistance of technicians in the case of illiterate farmers). The suggested reasons included plant height, field appearance, tillering capacity, lodging resistance, panicle size, grain size, disease tolerance, pests tolerance, expected yields, and maturity period.
2.6 Statistical analysis
Data were checked for normal distribution using residual plots in GENSTAT v.9 (Trust, 2007). The data obtained from both locations for the two seasons were subjected to analysis of variance (ANOVA) using the SISVAR statistical software version 5.6 (Ferreira, Citation2008). The ANOVA model included variety, location, and their interaction done separately for each season. The Scott Knot test was used to separate significant means at 5% probability level. The significant variety × location interaction for grain yield was further explored using the genotype mean plus genotype by environment interaction (GGE) biplot function using the GEA-R software version 4.0 (Pacheco et al., Citation2015). The GGE biplot shows the first two principal component (PC) derived from subjecting location-centred yield data to singular value decomposition (SVD). Through SVD, variety by location (V × L) matrix of mean yield is approximated as the product of variety and location matrices. This was displayed as V × L means with V points for variety and L points for locations (Yan et al., Citation2000). In order to compare the performance of the various varieties and the response at the different locations, the genotype-focused and environment-focused scaling, respectively, were used. Symmetric scaling was used to visualize the which-won-where pattern of the multi-locational yield data (Yan, Citation2002).
3. Results
3.1 Growth and yield of rice varieties
The growth parameters of rice varieties within and across locations varied significantly in each season (). FARO 67 was the tallest variety at both sites in the major season. At Adugyama, FARO 67 was taller by 22 cm and 18.3 cm than the local checks AGRA and Amankwatia, respectively. In the minor season, however, WAB 56–50 was the tallest variety at Adugyama while FARO 67 was the tallest at Beimso No. 1 ().
Table 3. P-values from the analysis of variance on growth and yield parameters for rice varieties for each season.
Table 4. Growth and yield performance of rice varieties in the Makran watershed during 2020–2021.
Similarly, the number of tillers significantly varied within and between sites. In the major season, varieties ORYLUX 6, FARO 66, GT 11, ORYLUX 4, and ARS-957-BGJ-171-15-D-B produced a higher (p < 0.05) number of tillers at Adugyama than observed at Biemso No. 1. At Biemso No. 1, SAHEL 305 produced the highest number of tillers. In the minor season, the interaction effects between variety and location were significant with the local check AGRA recording the highest number of tillers at Adugyama while WITA 9 recorded the highest number of tillers at Biemso No. 1 (). The number of panicles per plant followed a similar trend as the number of tillers. The number of panicles per plant was affected by the interaction between variety and location (). The variety ORYLUX produced the highest number of panicles at Adugyama while Amankwatia produced the highest number of panicles at Biemso No. 1 during the major season. However, during the minor season, WITA 9 variety produced a significantly higher number of panicles in both locations ().
The 1000-grain weight for the different varieties varied significantly across locations in both seasons (). The variety with the highest 1000-grain weight in the major season was ARS-957-BGJ-171-15-D-B. At Biemso No. 1, six (6) of the improved rice varieties recorded 1000 GW that were statistically at par with the two local checks (). The influence of different locations on 1000-grain weight was particularly observed for varieties ARS-957-BGJ-171-15-D-B, ORYLUX 3 and SAHEL 177. A similar trend of significant variety × location interaction was observed for 1000-grain weight in the minor season () with the highest recorded for ARS-957-BGJ-171-15-D-B at Adugyama and for a local check (Amankwatia) at Biemso No. 1. The 1000-grain weight varied significantly between the locations for the varieties FARO 66, FARO 67, and WAB 56–50 ().
3.2 Grain yield
A significant variety x location interaction was also observed in grain yield () during each season (). On average, grain yields at Adugyama (5.33 ± 1.06 t ha−1) and Biemso No. 1 (4.35 ± 1.10 t ha−1) were higher in the major season compared with the minor season (3.68 ± 0.97 t ha−1 and 3.48 ± 1.55 t ha−1, respectively). Seven (7) out of the thirteen (13) varieties produced grain yields that were statistically at par with the yield of the local checks (Amankwatia and AGRA) in the major season at Adugyama. At Biemso No. 1, FARO 66 and FARO 67 produced significantly higher yields than all the other varieties. WITA 9, GT 11. ORYLUX 3 and ORYLUX 6 produced the lowest grain yields. Grain yields recorded in the minor season followed a similar trend of significant variety × location interaction. Three (3) of the newly introduced improved varieties (WITA 9, ARS-957-BGJ-171-15-D-B, and GT 11) produced yields that were statistically at par with the two local checks. The yield recorded for all the other varieties was not significantly different. The significant variety x location interaction observed was further explored using the GGE biplot.
Figure 2. Grain yield performance of improved varieties at the study locations for two cropping seasons. .
3.3 Biplot analysis
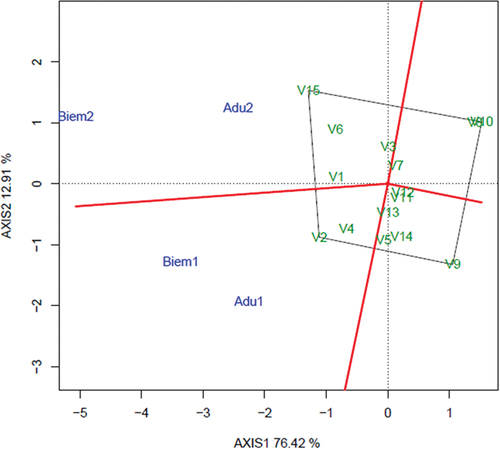
The polygon view of the GGE biplot which explicitly displays the which-won-where pattern of the varieties across locations grouped the study locations into two sectors with different varieties performing best in each of the sectors (). In the first sector (which comprises both locations in the major season), Amankwatia produced the highest grain yield which was slightly different from the yield of FARO 66 and SAHEL 317. WITA 9 recorded the highest yield in the second sector (which comprises both locations in the minor season) and was followed by GT 11, AGRA, ARS-957-BGJ-171-15-D-B, and NERICA L36.
Figure 3. The ‘which-won-where’ view of the GGE biplot based on the variety × location data in .
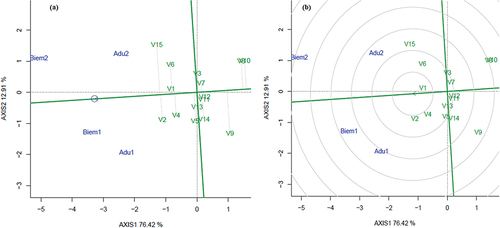
The mean versus stability biplot using the average environment coordination (AEC) revealed that the first two principal components (PC) axes explained 89.3% of the total variation in the yield (). Grain yield performance and stability of rice varieties evaluated showed that the AGRA variety (local check) produced the highest average yield which was stable across locations followed by FARO 66, Amankwatia (local check), GT 11, WITA 9, SAHEL 317, and FARO 67. All the remaining varieties produced below average grain yields. Based on the length of the projection of each variety to the AEC ordinate, the local check AGRA was considered more stable (a short projection on the AEC ordinate) followed by FARO 66, Amankwatia and GT 11. Ranking the varieties with reference to an ideal variety (i.e. high average yield and short projection on the AEC ordinate), the local check AGRA was identified as an ideal variety followed closely by the second local check Amankwatia. Among the test varieties, FARO 66, and GT 11 came close to an ideal variety ().
Figure 4. Mean verses stability (a) and variety-focused scaling (b) for comparing improved varieties and local checks. .

3.4 Varietal selection based on farmers’ preference
In , out of the 85 farmers, about 29% indicated that FARO 66 was their preferred first choice variety followed by NERICA L36 and AGRA (local check). Twenty-one and 19% of the farmers indicated that their reason for first choice variety was based on expected high yields and panicle sizes (data not shown). Most farmers opted for Nerica L 36 as the second-best choice due to its moderate height (according to 19% of the farmers), followed by WITA 9 and WAB 56–50, and Amankwatia. For the most undesirable rice variety (third choice), 19% and 16% of the farmers chose FARO 67 and GT 11, respectively. FARO 67 and GT 11 were undesired by farmers particularly because of their overly tall height (29% farmers) and susceptibility to diseases (12% farmers).
Figure 5. Farmers’ preference for newly introduced improved rice varieties compared to local checks in the Mankran watershed in Ghana.
4. Discussion
The prediction that the importation of rice to sub-Saharan Africa will increase by about 25% by 2026 due to the ever-increasing demand of consumers overemphasizes the need to increase rice production (USDA, Citation2017). On average, the rice yield in rainfed lowland in Ghana is 2.93 t ha−1. Improved rice varieties tested in this study showed enhanced growth and yield qualities with the potential for use in increasing rice yields by up to 91% over the national average (FAOSTAT, Citation2021). Rice yields have been reported to be influenced by traits such as plant height, number of panicles per plant, filled grains per panicle, and 1000 grain weight (Huang et al., Citation2013). The significant differences observed in plant height across locations indicate that rice growth pattern varied at the different locations. This could have been influenced by environmental conditions, particularly the differences in soil properties between the two sites (García et al., Citation2015). Although both sites were characterized by low fertility status, the levels of soil nutrients were higher at Adugyama than Biemso No. 1, which could have contributed to the higher growth parameters and grain yield. According to Buri et al. (Citation2015) nutrients such as nitrogen are a major contributor to crop growth and total dry matter accumulation. The observation that some rice varieties produced a large number of tillers which did not necessarily translate into more panicle formation and ultimately large grain weight could mean that some of the tillers were not productive possibly due to the low soil fertility status at both sites.
The difference observed in the 1000-grain weight within variety was not surprising as this trait is genetic (Blog, U. R., Citation2022). Nonetheless, the differences in the performance of these rice varieties across locations for this trait as observed may have been influenced by the availability of water during the experimental period. Although the experiment was established under rainfed conditions, the study sites had irrigation facilities and so supplementary irrigation was done as and when necessary and could have varied for each site (Katsura & Nakaide, Citation2011). It has been reported that drying of the germinating pollen tube may lead to the formation of partially filled or empty grains, which could have been the case in this study (Blog, U. R., Citation2022).
The observed significant variety × location interaction means that the ranking of rice varieties in terms of grain yield fluctuated across the study locations. For the which-won-where biplot, Amankwatia has ranked the best variety at both locations in the major season while WITA 9 was the best in the minor season. These findings are interesting as breeders normally have a high interest in varieties that can adapt to a wide range of environments (Yan et al., Citation2000). This means that Amankwatia and WITA 9 varieties would be the most recommended varieties for both study locations in the major and minor seasons, respectively. Meanwhile, for wider adoption of recommended varieties, such varieties must have the ability to produce high and stable yields across locations and seasons. The mean versus stability biplot gave a clear view of such varieties in this study. For example, AGRA, FARO 66, Amakwatia, and GT 11 were identified to possess stable high yielding characteristics across locations and seasons. Varieties with such stable characteristics in terms of grain yield across locations could be recommended for other locations with similar environmental conditions as the study location. These results further highlight why farmers have a high preference for AGRA and Amakwatia varieties (the local checks) in Ghana as a whole and in the study areas to be specific. The improved varieties tested in this study that gave high and stable yields also present a potential for adoption to enhance rice productivity in the country. The yield increases observed with improved varieties over the current average yields correspond to a net profit of 2215 USD ha−1 (Sekyi-Annan et al., Citation2021). Awika (Citation2011) reported that improved rice varieties are usually high yielding and respond better to external inputs. Although WITA 9 produced yield that was above the mean, it was less stable in performance. This variety could thus be recommended for a specific location and/or season.
Another important factor to consider during varietal selection for enhanced adoption is farmers’ preference for the introduced varieties. Farmers consider both growth and yield traits before accepting or rejecting an introduced variety. For instance, in this study, the highest percentage of farmers preferred FARO 66 owing to its panicle size and expected high yields. The reason for farmers’ most preferred variety in this study is buttressed by the fact that large number and size of panicles are pre-conditions for high rice yield (Blog, U. R., Citation2022). The second most preferred variety; NERICA L36 was also based on its moderate plant height and expected high yields. A relatively moderate plant height will improve the crop’s resistance to lodging ability in the case of strong winds and this will prevent grain yield losses. NERICA L36 was a second choice for farmers in this study, however it had below average grain yield, hence cannot be recommended to farmers. FARO 67 and GT 11 though amongst the best varieties in terms of the growth and yield parameters measured were the least preferred varieties due to their tall heights. According to farmers in the study area, rice varieties that are relatively tall are easily dislodged by winds which results in high grain yield losses.
Our study clearly showed 2.7 t ha−1 yield gap can be closed by the adoption of improved rice varieties. The national average yield of local varieties is 2.93 t ha−1, which is 96% lower than the yield of local varieties from our experiment. This difference might be due to the adoption of integrated GAP in the experimental plots. Integrated use of quality seeds of good variety and GAP might offer a good opportunity to boost rice yield in the region. Further, based on our experiences, policy options such as ‘performance-based incentive’ (i.e. supporting hardworking farmers with inputs e.g. power tillers, irrigation facilities, processing and storage facilities among others) combined with improved ‘farm gate price’ might be the other options to boost rice yield in the region.
5. Conclusions
Grain yields of improved rice varieties considered in this study showed that they have the potentials to be used as alternative varieties for farmers in the study locations. FARO 66 and GT 11 produced above average yields that were stable across locations. Although GT 11 produced stable yields across locations, it was among the least preferred varieties together with FARO 67 by farmers due to its tall height and susceptibility to lodging. This indicates that farmers’ participation is paramount in varietal selection to ensure a high rate of adoption when made available. The WITA 9 and FARO 66 varieties which had above average yields across locations and were most preferred by farmers should be evaluated further for grain quality, cooking time, and taste. This will ensure adequate exposure of farmers to the varieties and enhance the easy adoption of these varieties.
Acknowledgments
The authors express our appreciation to Mr. Nathaniel Biney and the entire technical staff of the Soil Chemistry, Fertility and Plant Nutrition Division of the CSIR-Soil Research Institute for their assistance during the fieldwork and data collection.
Disclosure statement
No potential conflict of interest was reported by the authors.
Data availability statement
The data presented in this study are available on request from the corresponding author. The data are not publicly available for ethical reasons.
Additional information
Funding
References
- Arouna, A., Devkota, K. P., Yergo, W. G., Saito, K., Frimpong, B. N., Adegbola, P. Y., Depieu, M. E., Kenyi, D. M., Ibro, G., Fall, A. A., & Usman, S. (2021). Assessing rice production sustainability performance indicators and their gaps in twelve sub-Saharan African countries. Field Crops Research, 271, 108263. https://doi.org/10.1016/j.fcr.2021.108263
- Arouna, A., Lokossou, J., Wopereis, M., Bruce-Oliver, S., & Roy Macauley, H. (2017). Contribution of improved rice varieties to poverty reduction and food security in sub-Saharan Africa. Global Food Security, 14, 54–60. https://doi.org/10.1016/j.gfs.2017.03.001
- Asuming-Brempong, S., Gyasi, K., Marfo, K., Diagne, A., Wiredu, A., Boakye, A. A., Haleegoah, J., & Frimpong, B. (2011). The exposure and adoption of new rice for Africa (NERICAs) among Ghanaian rice farmers: What is the evidence? African Journal of Agricultural Research, 6(27), 5911–5917. https://doi.org/10.5897/AJAR11.882
- Awika, J. M. (2011). Major cereal grains production and use around the world (advances in cereal science: Implications to food processing and health promotion. ACS Publications.
- Bado, B., Traore, K., Devries, M., Sow, A., & Gaye, S. (2011). Integrated Management of fertilizers, weed and rice genotypes can improve rice productivity (innovations as key to the green revolution in Africa. Springer.
- Becker, M., & Johnson, D. (2001). Improved water control and crop management effects on lowland rice productivity in West Africa. Nutrient Cycling in Agroecosystems, 59(2), 119–127. https://doi.org/10.1023/A:1017585328904
- Blog, U. R. (2022). https://ucanr.edu/blogs/blogcore/postdetail.cfm?postnum=14826&sharing=yes
- Buri, M. M., Iassaka, R. N., Fujii, H., & Wakatsuki, T. (2010). Comparison of soil nutrient status of some rice growing environments in the major agro-ecological zones of Ghana. Journal of Food, Agriculture & Environment, 8(1), 384–388.
- Buri, M. M., & Issaka, R. N. (2019). Managing soil nitrogen under rain-fed lowland rice production systems in the forest agroecological zones in Ghana (sustainable crop production. IntechOpen.
- Buri, M. M., Nuhu, I. R., Ato, E., & Naathanial, B. (2015). Effect of nitrogen rates on the growth and yield of three rice (Oryza sativa L.) varieties in rain-fed lowland in the forest agro-ecological zone of Ghana. International Journal of Agricultural Sciences, 5(7), 878–885.
- Devkota, K. P., Devkota, M., Paudel, G. P., & McDonald, A. J. (2021). Coupling landscape-scale diagnostics surveys, on-farm experiments, and simulation to identify entry points for sustainably closing rice yield gaps in Nepal. Agricultural systems, 192, 103182. https://doi.org/10.1016/j.agsy.2021.103182
- Devkota, K. P., Futakuchi, K., Mel, V. C., & Humphreys, E. (2022). Does wet seeding combined with sub1 varieties increase yield in submergence prone lowlands of West Africa? Field Crops Research, 276, 108375. https://doi.org/10.1016/j.fcr.2021.108375
- Diagne, A. (2006). Diffusion and adoption of NERICA rice varieties in Côte d’Ivoire. The Developing Economies, 44(2), 208–231. https://doi.org/10.1111/j.1746-1049.2006.00014.x
- Dinesh, D., Baskar, A., & Rajan, K. (2017). Effect of cultivation methods and nitrogen management strategies on growth and yield of rice (Oryza sativa L.) grown in coastal alluvial soils of southern India. International Journal of Current Microbiology and Applied Sciences, 6(3), 2176–2187. https://doi.org/10.20546/ijcmas.2017.603.248
- Dossou-Yovo, E. R., Devkota, K. P., Akpoti, K., Danvi, A., Duku, C., & Zwart, S. J. (2022). Thirty years of water management research for rice in sub-Saharan Africa: Achievement and perspectives. Field Crops Research, 283, 108548. https://doi.org/10.1016/j.fcr.2022.108548
- FAO. (2014). A regional rice strategy for sustainable food security in Asia and the Pacific. http://www.fao.org/3/a-i3643e.pdf
- FAO. (2019). The state of food insecurity and nutrition in the world: Safeguarding against economic slowdowns and downturns. In Rome: Food and Agriculture ORganisation. UN Children’s Fund, World Food Programme and World Health Organisation. http://www.fao.org/3/ca5162en/ca5162en.pdf
- FAOSTAT. (2021). United nations food and agricultural organisation. [WWW Document]. http://www.fao.org/faostat/en/#data
- Ferreira, D. F. (2008). SISVAR: Um programa para análises e ensino de estatística. In Revista symposium, 36–41.
- García, G. A., Dreccer, M. F., Miralles, D. J., & Serrago, R. A. (2015). High night temperatures during grain number determination reduce wheat and barley grain yield: A field study. Global Change Biology, 21(11), 4153–4164. https://doi.org/10.1111/gcb.13009
- Huang, R., Jiang, L., Zheng, J., Wang, T., Wang, H., Huang, Y., & Hong, Z. (2013). Genetic bases of rice grain shape: So many genes, so little known. Trends in plant science, 18(4), 218–226. https://doi.org/10.1016/j.tplants.2012.11.001
- Issaka, R. N., Masunaga, T., Kosaki, T., & Wakatsuki, T. (1996). Soils of inland valleys of West Africa: General fertility parameters. Soil Science and Plant Nutrition, 42(1), 71–80. https://doi.org/10.1080/00380768.1996.10414690
- Joshi, K., Devkota, K., Harris, D., Khanal, N., Paudyal, B., Sapkota, A., & Witcombe, J. (2012). Participatory research approaches rapidly improve household food security in Nepal and identify policy changes required for institutionalisation. Field Crops Research, 131, 40–48. https://doi.org/10.1016/j.fcr.2012.03.001
- Katsura, K., & Nakaide, Y. (2011). Factors that determine grain weight in rice under high-yielding aerobic culture: The importance of husk size. Field Crops Research, 123(3), 266–272. https://doi.org/10.1016/j.fcr.2011.05.023
- Mansaray, B., & Jin, S. (2020). Do the determinants of food security differ in improved rice variety adoption? Evidence from Sierra Leone. Open Agriculture, 5(1), 466–484. https://doi.org/10.1515/opag-2020-0047
- MiDA. (2010). Investment opportunity in Ghana: Maize, rice and soybean. Millennium Challenge Account Program (MCA).
- MoFA. (2017). Planting for food and jobs: Strategic plan for implementation (2017–2020). Ministry of Food and Agriculture, Ghana.
- Ouédraogo, A., Bockel, L., Abedi, A., Arouna, A., & Gopal, P. (2021). Rice value chain in Ghana–Prospective analysis and strategies for sustainable and pro-poor growth. Food & Agriculture Org.
- Pacheco, A., Vargas, M., Alvarado, G., Rodriguez, F., Crossa, J., & Burgueño, J. (2015). GEA-R (Genotype x environment analysis with R for windows) version 2.0. CIMMYT.
- Potvin, C. (2020). ANOVA: Experiments in controlled environments (design and analysis of ecological experiments. Chapman and Hall/CRC.
- Ragasa, C., & Chapoto, A. (2017). Limits to green revolution in rice in Africa: The case of Ghana. Land Use Policy, 66, 304–321. https://doi.org/10.1016/j.landusepol.2017.04.052
- Rodenburg, J., Zwart, S. J., Kiepe, P., Narteh, L. T., Dogbe, W., & Wopereis, M. C. (2014). Sustainable rice production in African inland valleys: Seizing regional potentials through local approaches. Agricultural systems, 123, 1–11. https://doi.org/10.1016/j.agsy.2013.09.004
- Scarrow, R. (2017). Food security: Ghana rice revolution falters. Nature Plants, 3(7), 1–1. https://doi.org/10.1038/nplants.2017.111
- Sekyi-Annan, E., Buri, M. M., Devkota, K. D., Dossou-Yovo, E., Osei, O., Ayamba, B. E., & Musah, M. (2021). Integrating rice and fish cultivation for increased yields and improved income for smallholder farmers within the Biem watershed in southern Ghana. In C. Heindord, A. Lazos, L. Meza, T. González, & V. Ávila (Eds.), Scientists and society in action for biodiversity and sustainability – case studies from around the world. Institute for Agricultural and Rural Sciences, Autonomous University of the State of Mexico. (pp. 120–129).
- USDA. (2017). Agricultural projections to 2017. Office of the chief economist, world agricultural outlook board. Us department of agriculture. prepared by the interagency agricultural projections committee. Long-term Projections Report OCE-2008-1.
- Vlek, P. L., Khamzina, A., & Tamene, L. (2017). Land degradation and the sustainable development goals: Threats and potential remedies. International Center for Tropical Agriculture (CIAT). p. 67. http://hdl.handle.net/10568/81313
- Yan, W. (2002). Singular-value partitioning in biplot analysis of multienvironment trial data. Agronomy journal, 94, 990–996.
- Yan, W., Hunt, L., Sheng, Q., & Szlavnics, Z. (2000). Cultivar evaluation and mega-environment investigation based on the GGE biplot. Crop Science, 40(3), 597–605. https://doi.org/10.2135/cropsci2000.403597x