ABSTRACT
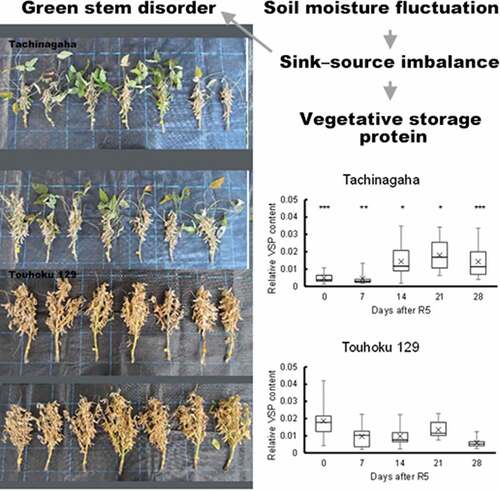
Green stem disorder (GSD), characterized by delayed stem senescence during seed maturation, complicates harvesting in soybean production. Although GSD is associated with a sink – source imbalance, a rapid and precise evaluation of GSD has not been established. In sink-limited soybean plants, vegetative storage protein (VSP) accumulates. In this study, pot and field experiments were conducted to reevaluate the relationship between GSD, sink – source imbalance caused by soil moisture change, and VSP accumulation as a possible indicator of GSD in Kyoto, Japan over two years. Drought treatment for four weeks from R1 (beginning flowering), R3 (beginning pod), or R5 (beginning seed) growth stage in pots using the short growth-period cultivar Yukihomare reduced sink size in both years, but reduced relative sink mass (pod weight/shoot weight) and increased GSD severity only in 2017, suggesting that sink-source imbalance, affected by soil moisture, can induce GSD. Soil moisture change from around R3 or R5 to maturity in fields using trench-filled or unfilled water tended to change GSD severity but not VSP accumulation in the uppermost fully expanded leaves from R5 (2018) or 15 days before R5 (2019) to 28 days after R5. GSD and VSP responses, however, differed between the two contrasting cultivars, Tachinagaha and Touhoku 129, suggesting the potential usability of VSP for GSD evaluation.
GRAPHICAL ABSTRACT
1. Introduction
Green stem disorder (GSD) is perceived as an unstable factor that reduces soybean [Glycine max (L.) Merr.] yield (Ogiwara, Citation2002), and is the reason for lowering seed grade and storability when harvested by machinery (Hill et al., Citation2006). The conventional diagnosis of GSD severity is conducted by visual inspection at maturity, which requires time and experience. Additionally, apart from the narrow sense of GSD (Furuya & Umezaki, Citation1993), other similar phenomena, such as green soybean syndrome, in which maturity of entire plant delayed, have become a problem (Harbach et al., Citation2016). Thus, a rapid and precise GSD evaluation method is needed.
The underlying mechanism of GSD is considered to be source overloading in vegetative organs (Yamazaki et al., Citation2018, Citation2022) and sink deficiency during maturation (Sato et al., Citation2007). Previous studies have reported that drought causes GSD (Takeda et al., Citation2006; Tsujimoto et al., Citation2006). Takeda et al. (Citation2006) demonstrated that drought treatments using a lysimeter from the R3 (beginning pod) to R5 (beginning seed) growth stages caused GSD, along with a decrease in seed weight, pod number, seed number per pod, and increase in stem weight. Tsujimoto et al. (Citation2006) investigated farmer’s fields and found that large soil moisture changes during the earlier growth, anthesis, and podding stages caused GSD. Both studies attributed GSD to the sink decline caused by drought. In contrast, excess soil water conditions during the reproductive growth period can also cause GSD, while drought soil conditions tend to suppress GSD (Sato et al., Citation2007). Therefore, reevaluation of the relationship between GSD and drought or excess soil water is needed.
Sato et al. (Citation2007) suggested that excessive growth of vegetative organs occurred with high levels of cytokinin flux in the xylem, maintaining a high leaf nitrogen content during seed filling under excess soil water conditions. When the nitrogen supply is abundant, vegetative storage protein [VSP, serving as temporary storage reserves for nitrogen, Staswick (Citation1994)] and vegetative lipoxygenase [VLX, catalyzing the oxygenation of fatty acids, Fischer et al. (Citation1999)] accumulate in leaves at flowering and are presumably degraded to contribute to the pool of nitrogen that is mobilized to developing organs (Feller & Keist, Citation1986). There are two types of VSPs; VSPα (VSP25) and VSPβ (VSP27) (Staswick, Citation1994). VSPα and VSPβ are abundant in young sink leaves (constituting 6% to 15% of soluble proteins), but decline to 1% during seed filling (Wittenbach, Citation1982). This VSP accumulation pattern is similar in seed pods (Staswick, Citation1989b) and seedling hypocotyls (Mason & Mullet, Citation1990). Nitrogen is mobilized from seed pods during seed protein synthesis, and VSP accounts for 45% of pod protein reduction from 3 to 6 weeks after flowering (Staswick, Citation1989b). Soybean VSP was detected when depodded plants maintained high levels of protein in leaves, even though most RuBisCO disappeared (Wittenbach, Citation1982). Detip (removal of all axillary and terminal buds) and subsequent retip (regrow) treatments cause VLX accumulation in the leaves (Fischer et al., Citation1999). Therefore, VSPs, including VLX, are considered part of the source and are expected to be a good indicator for GSD.
In this study, we hypothesized that soil moisture change is one of the key factors in GSD in fields and sought to gain insights for developing a GSD diagnosis method that could be used by farmers in their fields. Thus, the first objective of this study was to reevaluate the relationship between GSD and soil moisture change (drought and excess wet), which would frequently occur in rain-fed fields, using the short growth-period cultivar Yukihomare and the two contrasting cultivars Tachinagaha (GSD-susceptible) and Touhoku 129 (GSD-resistant). The second objective of this study was to clarify genotypic differences in VSP accumulation associated with GSD. This is the first report demonstrating a possible relationship between GSD susceptibility and unique VSP dynamics in field-grown soybean plants.
2. Materials and methods
2.1. Drought treatments (pot)
Drought experiments (pots) were conducted using a nodulating soybean [Glycine max (L.) Merrill] variety Yukihomare (determinate type) in 2017 and 2018 in the experimental field of Kyoto University, Japan (35° 2′ N, 135° 47′ E; elevation:65 m asl; soil: fluvic aquepts). Seedlings were preliminarily grown in a nursery plastic tray filled with nursery soil and then transplanted to #10 unglazed pots (31 cm diameter, 25 cm depth) filled with field soil supplemented with 5.3 g of compound fertilizer (N:P:K = 8:8:8) at the V1 growth stage (first trifoliolate leaf unrolled). The unglazed pots were buried at 50 cm intervals in the field until the onset of drought treatment. The soil surface levels were the same inside and outside the pots. In 2017, there were three sowing dates, June 23, July 6, and July 11, to obtain plants at the R5, R3, and R1 (beginning flowering) growth stages, respectively, on July 24, when drought treatments started. For the drought treatments, the unglazed pots were lifted to the ground surface and kept for four weeks to accelerate evaporation from the side of unglazed pots, while pots for the control remained buried in the field. After the drought treatments, pots were returned (buried) to the field again until maturity [3–5 replicates (pots) for each treatment]. In 2018, the same cultivar, Yukihomare, was sowed on June 28, July 10, and July 17, and subjected to drought treatment on August 1 in a similar way to that in 2017 [7–8 replicates (pots) for each treatment]. Irrigation was applied constantly for the control treatment, and occasionally when the soil surface was dried for the drought treatment to avoid permanent wilting (500 mL water for each time, once a day at maximum). In 2018, a soil moisture sensor EC-5 (Decagon devices Inc., Pullman, USA) was placed between a plant and pot wall to monitor soil moisture. Plant mean leaf temperature was measured occasionally around noon using an infrared camera C2 (FLIR Systems, Sweden) from a height of 280 cm above the soil surface during the drought treatment. To check for biotic stress, insecticides and fungicides were regularly sprayed in the fields. Meteorological data and drought treatment periods are shown in Fig. S1.
2.2. Drought and excess wet experiments (field)
The soybean cultivars Tachinagaha and Touhoku 129 were used in drought and excess wet experiments in the experimental field of Kyoto University, Japan, in 2018 and 2019. Tachinagaha is GSD susceptible and Touhoku 129 is GSD resistant (Yamada et al., Citation2014). Each cultivar was sown in a single row (21 m long, 120 cm apart between rows) with a black vinyl mulch at 33 cm intervals. Tachinagaha was sown on July 9 and June 26 in 2018 and 2019, respectively. Touhoku 129 was sown on June 22 and June 20 in 2018 and 2019, respectively. There were three treatments: drought, control, and excess wet, with two field replications (north and south) (seven plants for each plot). Fertilizers (3 g m−2 N, 10 g m−2 P2O5, and 10 g m−2 K2O) were applied in 2018 and 2019. Trenches (3 m long, 40 cm wide, and 20 cm deep) were dug between rows when Tachinagaha reached around R5 (Touhoku 129 reached around R3). The drought and excess wet plots were separated by the control plot of 3 m length. The trenches accelerated evaporation during the drought treatment and increased the soil moisture in the excess wet treatment by being empty and filled with water once a day, respectively until maturity. In 2018, a soil moisture sensor EC-5 (Decagon devices Inc., Pullman, USA) was placed between plants to monitor soil moisture. In 2019, because plants in one of the field replications were infected with Meloidogyne incognita, only one replication was analyzed. To check for biotic stress, insecticides and fungicides were regularly sprayed in the fields.
2.3. Sampling for pod number and weights
All plants at maturity were harvested with their roots in the pot experiment. Because the progression of pod maturation differed significantly within a plant in the pot drought treatment of 2017, maturity was considered when at least one pod was shattered. Pot plants of control and drought treatments were harvested simultaneously in 2017. Note that the difference in maturation dates between control and drought treatments was less than one week. After taking a photo, the plant samples were air-dried and divided into pods, stems, leaves, and roots (if any). The number of pods and the weight of each organ were measured. Field plants were harvested in a similar way to that of pot experiments.
2.4. Sampling for VSP measurements
Leaf disks were sampled from the uppermost developed leaves of four plants. The plants were randomly selected each time (2018) or randomly selected only for the first time and repeatedly selected afterwards (2019) in each plot of the field experiments every week. A 2 mL plastic tube was used to punch the leaf disks. The samples were ground using a Mixer Mill (QIAGEN K.K., Tokyo, Japan) with a zirconia bead at 1,800 rpm for 60 s, and leaf proteins were extracted with 200 μL of VSP extraction buffer [25 mM Tris, pH 7.6, 1 mM EDTA, and 10 mM 2-mercaptoethanol (ME)] (Staswick, Citation1989a) by grinding for another 60 s. Extracted soluble proteins were quantified by the Bradford method (Bradford, Citation1976). Protein extracts and a standard protein (recombinant VSP) were spotted on a nitrocellulose membrane (dot blot) and reacted with an anti-VSP antibody prepared against the oligopeptide CTLYDEWVNKG as the primary antibody and a secondary goat anti-rabbit IgG alkaline phosphatase conjugate (Promega, Madison, USA). The extract was also mixed with an equal volume of 2×SDS buffer [125 mM Tris, pH 6.8, 4% (w/v) SDS, 0.1% (w/v) bromophenol blue, 20% (w/v) glycerol, and 5% (v/v) 2-mercaptoethanol (ME)] and used for SDS-PAGE (14% T gel, 200 V constant for 1 h). Immunoreactions and detection were performed as described by Khan et al. (Citation2012). The detected signals were quantified using ImageJ software (Rasband, W.S., ImageJ, U. S. National Institutes of Health, Bethesda, Maryland, USA, https://imagej.nih.gov/ij/, 1997–2018). Relative VSP content was calculated by dividing the VSP concentration by the soluble protein concentration.
2.5. Standard protein (recombinant VSP)
A standard recombinant VSP protein was prepared using an Escherichia coli (E. coli) expression system (Rosetta-gami B(DE3), Merck KGaA, Darmstadt, Germany) to quantify VSP accumulation in soybean leaves. VSP cDNA was inserted into the plasmid pET-21d (Merck KGaA, Darmstadt, Germany) and transferred into E. coli cells according to Katsube-Tanaka and Monshi (Citation2022). The cells were incubated in Luria-Bertani (LB) medium containing ampicillin (50 ug/mL), tetracycline (12.5 ug/mL), kanamycin (15 ug/mL), chloramphenicol (34 ug/mL), and 5 µM riboflavin at 37°C and 160 rpm, until the optical density at 600 nm reached 0.5. Isopropyl β-D-1-thiogalactopyranoside (1 mM) was added to induce recombinant VSP expression, followed by a 3 h incubation at 37°C. The cells were disrupted by sonication in an E. coli lysis buffer (35 mM sodium phosphate buffer, pH 8.0, 100 mM NaCl, and 1 mM EDTA). The precipitate was dissolved in 3 M urea and used as a standard protein for VSP quantification.
2.6. Green component proportion
RGB images of soybean plants harvested at R8 were transformed into an HSV model consisting of Hue, Saturation, and Brightness (Value) using the ImageJ software. Hue in the HSB model represents ‘pure color’. ‘Saturation (the shade of color)’ and ‘Brightness (the overall brightness of the color)’ can be separated from the pure color (Schneider et al., Citation2012). In the present study, the Hue from 62 to 103 was defined as the green component, that is different from the Hue around 30 representing matured brown pods and from the Hue around 210 representing a background sheet. A fixed size of image covering soybean shoot (stem, leaf, pod, and petiole) was measured. The number of pixels of the green component divided by the number of all measured pixels was calculated as the proportion of green components.
3. Results
3.1. Preparation of recombination VSP (standard protein)
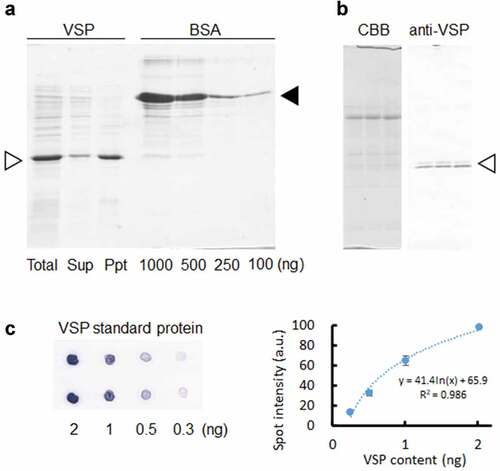
Recombinant VSP (VSPr) was prepared using an Escherichia coli expression system at high concentrations. After sonication of the cells, more than two-thirds of the VSPr was recovered in an insoluble fraction (Ppt) with a relatively high purity (). After estimating the VSPr concentration using bovine serum albumin (BSA), a dilution series of VSPr was prepared. Two bands of native VSP (VSPn) were detected in soybean leaf extracts using western blotting with the anti-VSP antibody (), suggesting that VSPα (lower band) and VSPβ (upper band) could be detected specifically with this antibody. Dot blotting using a dilution series of VSPr and the specific antibody demonstrated that VSP content could be quantitatively estimated between 0.3 and 2 ng ().
Figure 1. Quantification system for VSP. (a) Recombinant VSP prepared in Escherichia coli (E. coli) cells (Total) was separated into supernatant (Sup) and insoluble (Ppt) fractions after ultrasonication. The fractionated samples were electrophoresed in SDS-PAGE with BSA (1,000, 500, 250, and 100 ng) followed by CBB staining. White and black arrowheads represent VSP and BSA, respectively. (b) Specificity and reactivity of anti-VSP antibody was confirmed. Three independent soybean leaf proteins prepared at 14 d after V0 were electrophoresed in SDS-PAGE and detected with CBB and anti-VSP antibody. White arrowhead indicates two native VSP bands (VSPα and VSPβ). (c) VSP dilution series used in a dot blot for quantification (two replications each) were detected with anti-VSP antibody, followed by quantified with the ImageJ software.
3.2. Drought experiment (pot)
There was rainfall moderately and scarcely in the drought treatment period in 2017 and 2018, respectively (Fig. S1). Soil moisture was therefore clearly different between the drought and control treatments except for Aug 14–17 and 23 in 2018 (data not shown). Accordingly, the difference in mean leaf temperature between the two treatments reached 4°C several times in 2018 (data not shown). Yukihomare is a short growth-period cultivar adapted to the northern area of Japan. The drought treatment started on 24 July 2017 and 1 August 2018. Although the plants in each treatment reached R5, R3, and R1 at the beginning of the drought treatment, the growth stage at the end of the drought treatment was less advanced in 2017 than in 2018. In 2017, only the R5 plot (drought treatment started at R5) reached R7, while the other plots reached R6. In 2018, the R5 plot was six days before R8, R3 plot (drought treatment started at R3) reached R7 (15 days before R8), and R1 plot (drought treatment started at R1) was at R6.
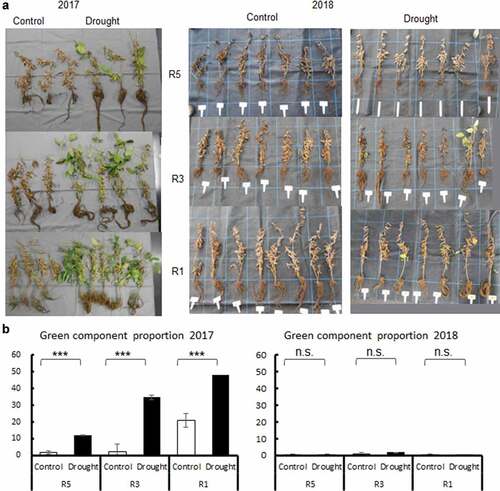
In 2017, all plants in the control group matured normally, whereas all plants in the drought treatments conducted at R5, R3, and R1 growth stages delayed maturation (within one week compared to control) and showed GSD symptoms, that is, pods matured, but leaves remained green (). There was a significant difference in the proportion of green components between the control and drought treatments at any growth stage (). Note that the earlier the drought treatment started, the higher was the proportion of green components. In 2018, however, almost no GSD symptoms were observed, even in the drought treatments. The proportion of green components was remarkably lower in 2018 than that in 2017. There was no difference in the proportion of green components between the control and drought treatment groups.
Figure 2. GSD in drought experiments with pots. (a) Photo of Yukihomare at R8 subjected to control and drought treatments at R5, R3, and R1 in 2017 and 2018. (b) Green component proportion (%) at R8 was calculated as the number of pixels of which Hue was from 62 to 103 using the ImageJ software. Mean ± standard error. ***: significant at p < 0.001, n.s.: not significant at p < 0.05.
Sink formation and dry matter partitioning were also affected by drought treatments. In 2017, pod number and pod weight significantly decreased by 33–47% under drought treatments at any treatment onset from R5 to R1 (). In contrast, stem and leaf weights tended to increase, and root weight was significantly increased by drought treatments. Accordingly, the pod-to-shoot (stem, leaf, and pod) weight ratio and root-to-vegetative organs (stem, leaf, and root) weight ratio decreased by 18% on average and increased by 37% on average in the drought treatments in 2017 (). In 2018, except for the drought treatment starting from R5, pod number and pod weight significantly decreased (p < 0.001) by 11–39% in drought treatments (), showing a similar tendency to that in 2017. However, stem, leaf, and root weights did not show the same tendency as that in 2017. Stem, leaf, and root weights were unchanged or decreased by drought treatments. Consequently, the pod-to-shoot (stem, leaf, and pod) weight ratio and the root-to-vegetative organs (stem, leaf, and root) weight ratio were almost unchanged or decreased under the drought treatments in 2018 (). The pod number and vegetative organ weight in the control were 1–3.3 times higher in 2018 than in 2017, indicating that environmental and growth conditions differed between the two years. Pod number, pod weight, stem and leaf weights, and root weight were significantly different between sowing dates in 2018; R5 plots had lower values than R3 and R1 plots.
Figure 3. Growth parameters in drought experiments with pots. Pod number, pod weight, stem and leaf weight, and root weight at R8 were compared between the control and drought treatments initiated at R5, R3, and R1 in 2017 (a) and 2018 (b). ***: significant at p < 0.001, **: significant at p < 0.01, *: significant at p < 0.05, n.s.: not significant at p < 0.05. The same letters indicate no difference between R5, R3, and R1 plots in the control in 2018. Bars with no letters also show no significant differences between R5, R3, and R1 plots within the control or drought treatments each year.
Table 1. Relative sink and root biomass of Yukihomare in pot experiments in 2017 and 2018.
3.3. Drought and excess wet experiment (field)
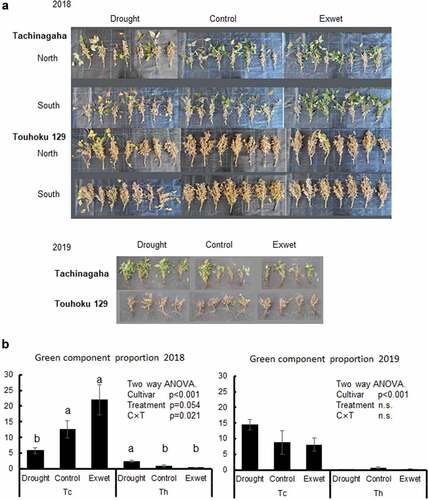
The drought and excess wet treatments in fields started in late August and there was frequent rainfall in 2018 (Fig. S1). Soil moisture was therefore not significantly different between the two treatments until mid-September, after which soil moisture was mostly higher in the excess wet than that in the drought treatment in 2018 (data not shown). In 2019, rainfall was scarce except for late August (Fig. S1). In both years, Tachinagaha showed remarkably higher GSD symptoms and green component proportions than did Touhoku 129 (). In Tachinagaha, the proportion of green components was lower in the drought treatment than in the control and wet treatments in 2018, but tended to be higher in the drought treatment than in the control and wet treatments in 2019. In Touhoku 129, the proportion of green components was significantly higher and lower in the drought treatment than that in the control in 2018 and 2019, respectively.
Figure 4. GSD in drought and excess wet experiments in field. (a) Photo of Tachinagaha and Touhoku 129 in drought, control, and excess wet (Exwet) treatments at R8 in 2018 and 2019. In 2018, both north and south plots were shown (n = 7). In 2019, only one plot was analyzed because of root-knot nematode damages (n = 4). (b) Green component proportion (%) at R8 of Tachinagaha (Tc) and Touhoku 129 (Th) was calculated as the number of pixels of which Hue was from 62 to 103 using ImageJ software. Mean ± standard error. Same letters indicate no difference between treatments within each cultivar at n < 0.05. n.s.: not significant at n < 0.05.
VSP accumulation was measured from R5 in 2018 and from R5–15d in 2019 (). In both years and cultivars, there was no significant difference in VSP between the soil moisture treatments. Therefore, data from each treatment were pooled to compare the chronological dynamics between the two cultivars. In 2018, Tachinagaha showed significantly lower relative VSP content than Touhoku 129 at R5 and R5 + 7d, but higher relative VSP content than Touhoku 129 afterwards. In 2019, the relative VSP content tended to be lower than in 2018. Touhoku 129 had a higher relative VSP content than Tachinagaha at R5–1d. Meanwhile, Tachinagaha tended to show a higher relative VSP content than Touhoku 129 after R5. Note that Tachinagaha showed a higher relative VSP content in 2019 than in 2018 at R5–1d (R5) and R5 + 6d (R5 + 7d). In both years, the relative VSP varied from 0.001 to 0.042, and there were large differences in the relative VSP content between individuals even in the same cultivar on the same sampling date.
Figure 5. Dynamics of relative VSP content in Tachinagaha and Touhoku 129 in drought and excess wet experiments. The relative VSP content in Tachinagaha and Touhoku 129 in the field experiments was compared in 2018 (a) and 2019 (b). The data between treatments were combined. The whiskers show the highest and lowest data points in the dataset. Three lines in the box from top to bottom show the third quartile, median, and first quartile of the dataset. The symbol ‘×’ shows the average of the dataset. Differences between cultivars on the same date were compared at the following significance levels: †:10%, *:5%, **:1%, ***:0.1%.
4. Discussion
4.1. GSD of a short growth-period cultivar in lower latitude areas
It is generally acknowledged that GSD is associated with a relatively smaller sink size than source size (Egli & Bruening, Citation2006; Shiraiwa et al., Citation2005; Yamazaki et al., Citation2018, Citation2019). However, a variety of causes for sink – source imbalance have been proposed, and a singular cause may not be present in farmer’s fields. In this study, we hypothesized that soil moisture change would be one of the most important factors to induce GSD in farmer’s fields. Thus, firstly we preliminarily examined the relationship between drought and GSD in pots.
In the pot experiment of the present study, drought treatment decreased sink (pod number) in both years but produced GSD only in 2017. Takeda et al. (Citation2006) grew Sachiyutaka in a lysimeter to apply drought treatment from R3 to R5, and found a decrease in sink (seed weight and pod number) and an increase in source (stem weight) coupled with GSD occurrence. Ohashi et al. (Citation2009) demonstrated that drought at the R5 stage reduced photosynthesis and induced greater partitioning of 13C from leaves to vegetative organs (stem) with an export rate of 72% compared to the control which had an export rate of 32%. Silva et al. (Citation2018) conducted drought treatments from R2 to R5 and R5.1 to R6 and found re-accumulation of non-structural carbohydrates in leaves and stems after drought treatments. These previous studies are consistent with the dry matter partitioning in the pot drought treatment used in the present study in 2017. However, stem and leaf weights decreased or tended to decrease in the pot drought treatment in 2018. This difference corresponded to the fact that the relative pod mass and relative root mass did not essentially change (sink – source ratio did not decrease) in 2018 ().
In 2018, Yukihomare was sown one week later, but the growth period was one week shorter than that in 2017. Steele and Grabau (Citation1997) planted maturity group II cultivars at a lower latitude area than their traditional production area on four different sowing dates. They found that yield was significantly different between sowing dates as well as between years, suggesting that short growth-period cultivars (cultivars with a low maturity group number) are vulnerable to environmental fluctuations in lower latitude areas. The sowing date of the present pot experiment in 2018 was later, and the dry weight was higher than that in 2017. In 2018, the R3 and R1 plots, which were sowed later, had a larger dry weight than the R5 plot. In addition, it was assumed that re-accumulation of dry matter (increase in stem weight) after drought treatment did not occur because the end of the drought treatment was too close to R8 in 2018. Fujii et al. (Citation2015) found early flowering genotypes showed a more severe GSD symptom within a determinate stem growth habit (D type). Consequently, for short growth-period cultivars such as Yukihomare (adapted to Hokkaido, northern Japan), when planted in southern areas (Kyoto), development, growth, and dry matter partitioning were likely to fluctuate, resulting in a large variation in GSD between years in response to changes in environmental factors.
4.2. Variation of VSP accumulation between individuals and genotypes
VSP accumulates in the leaves and stems when the source capacity is overloaded to the sink size (Wittenbach, Citation1982), and VSP is supposed to be associated with GSD for this reason. However, as far as we know, no studies have examined the relationship between VSP and GSD in fields except the study which examined VSP and delayed leaf senescence using field-grown soybeans (Wittenbach, Citation1983). In the present study, we established a quantification system for VSP and studied its chronological dynamics in two contrasting cultivars grown in the field for the first time.
The VSP abundance largely differed between individuals even in the same plot. The highest accumulation was 5.4–19.9 times and 3.1–11.2 times higher than the lowest for Tachinagaha and Touhoku 129, respectively, in 2018, and 1.8–4.7 times and 1.8–4.1 times higher than that for the two cultivars, respectively, in 2019 (). The reason for the large difference between individuals is unknown, but as reported by Mason and Mullet (Citation1990) and Zhang et al. (Citation2016), wounds of leaves and damage to seeds by pests, typhoons (strong winds), etc. might have caused the difference.
The accumulation patterns of VSP and GSD were significantly different between Tachinagaha and Touhoku 129 (). Yamazaki et al. (Citation2019) applied thinning treatments to Tachinagaha to increase assimilate supply and decrease the sink – source ratio at R5 and found that Tachinagaha showed severe GSD irrespective of the thinning treatments. Yamada et al. (Citation2014) found three QTLs attributable to GSD in the recombinant inbred lines of Tachinagaha and Touhoku 129. The ‘Touhoku 129’ genotype for these 3 QTLs all shortened a seed-filling period. Egli et al. (Citation1987) reported that leaf N concentration declined faster from R5 in a soybean genotype with an exceptionally short seed-fill duration. From the above, it was considered that the different characteristics related to the source (N) accumulation and translocation of the two varieties, possibly caused by the different length of seed filling period, could be confirmed by VSP dynamics.
4.3. Possibility to diagnose GSD with VSP
In the present field experiment, there was no difference in VSP accumulation between treatments in either cultivar. One reason may be the large difference between individuals in the VSP in the field, as discussed above. Another reason may be that the uppermost developed leaves, which were the analysis targets in this study, might not show a good response to drought and excess wet treatments. Mason and Mullet (Citation1990) reported that the expression of VspA and VspB mRNA in the youngest leaves was the highest among all leaves at V7. Ogiwara and Ishikura (Citation1994) demonstrated that VSP abundance differed in the cortex after de-pod treatments at R4 and R8, but showed no difference in leaves at R4. Moreover, Lee et al. (Citation2014) showed that in a water deficit experiment on white clover, VSP accumulated in the stolon instead of the leaves. Thus, it is possible that the stem is more appropriate to use than the leaf for detecting VSP with high sensitivity. However, non-destructive or less damaging measurements are necessary when GSD is continuously diagnosed by VSP in farmer’s fields. Therefore, to determine the true VSP value of populations beyond differences between individuals, the number of samples should be increased, and a quicker and simpler VSP analysis method is necessary. Although the VSP dynamics data in this study were limited and differed between years, varietal difference in VSP accumulation, for example at 14 days after R5, might be used for the GSD diagnosis. Further studies are required to confirm the relation of VSP to GSD.
Author contributions
JZ and TKT conceived, designed, and performed the experiments. JZ, TS, and TKT analyzed the data and wrote the manuscript. All authors have read and approved the final manuscript.
PPS2022_075RP-File007.tif
Download TIFF Image (1.8 MB)Acknowledgment
We are grateful to Ms. Megumi Hasegawa for technical assistance. This study was partly supported by a Young Scientists Scholarship for foreign students of the Hirose Foundation to J.Z. and JSPS KAKENHI Grant No. 21H02330 to T.S. and Grant Number 20H02967 to T.K.-T.
Disclosure statement
No potential conflict of interest was reported by the authors.
Supplementary data
Supplemental data for this article can be accessed online at https://doi.org/10.1080/1343943X.2023.2170257.
References
- Bradford, M. M. (1976). A rapid and sensitive method for the quantitation of microgram quantities of protein utilizing the principle of protein-dye binding. Analytical Biochemistry, 72(1–2), 248–254. https://doi.org/10.1016/0003-2697(76)90527-3
- Egli, D. B., & Bruening, W. P. (2006). Depodding causes green-stem syndrome in soybean. Crop Management, 5(1), 1–9. https://doi.org/10.1094/CM-2006-0104-01-RS
- Egli, D. B., Swank, J. C., & Pfeiffer, T. W. (1987). Mobilization of leaf N in soybean genotypes with varying durations of seedfill. Field Crops Research, 15(3–4), 251–258. https://doi.org/10.1016/0378-4290(87)90014-1
- Feller, U., & Keist, M. (1986). Senescence and nitrogen metabolism in annual plants. In Fundamental, Ecological and Agricultural Aspects of Nitrogen Metabolism (pp. 219–234). Martinus Nijhoff Publishers. https://doi.org/10.1007/978-94-009-4356-8_34
- Fischer, A. M., Dubbs, W. E., Baker, R. A., Fuller, M. A., Stephenson, L. C., & Grimes, H. D. (1999). Protein dynamics, activity and cellular localization of soybean lipoxygenases indicate distinct functional roles for individual isoforms. The Plant Journal, 19(5), 543–554. https://doi.org/10.1046/j.1365-313x.1999.00550.x
- Fujii, K., Kato, S., Sayama, T., Tanaka, Y., Nakazaki, T., Ishimoto, M., & Shiraiwa, T. (2015). Stability verification of the effects of stem determination and earliness of flowering on green stem disorder of soybean against genetic background and environment. Plant production science, 18(2), 166–179. https://doi.org/10.1626/pps.18.166
- Furuya, T., & Umezaki, T. (1993). Simplified distinction method of degree of delayed stem maturation of soybean plants. Japanese Journal of Crop Science, 62(1), 126–127. https://doi.org/10.1626/jcs.62.126 In Japanese
- Harbach, C., Allen, T., Bowen, C., Davis, J., Hill, C., Leitman, M., Leonard, B., Mueller, D., Padgett, G., Phillips, X., Schneider, R., Sikora, E., Singh, A., & Hartman, G. L. (2016). Delayed senescence in soybean: Terminology, research update, and survey results from growers. Plant Health Progress, 17(2), 76–83. https://doi.org/10.1094/PHP-RV-16-0008
- Hill, C. B., Hartman, G. L., Esgar, R., & Hobbs, H. A. (2006). Field evaluation of green stem disorder in soybean cultivars. Crop Science, 46(2), 879–885. https://doi.org/10.2135/cropsci2005.0207
- Katsube-Tanaka, T., & Monshi, F. I. (2022). Characterization of 2S albumin allergenic proteins for anaphylaxis in common buckwheat. Food Chemistry: Molecular Sciences, 5, 100127. https://doi.org/10.1016/j.fochms.2022.100127
- Khan, N., Takahashi, Y., & Katsube-Tanaka, T. (2012). Tandem repeat inserts in 13S globulin subunits, the major allergenic storage protein of common buckwheat (Fagopyrum esculentum Moench) seeds. Food Chemistry, 133(1), 29–37. https://doi.org/10.1016/j.foodchem.2011.12.056
- Lee, B. R., Lee, D. G., Avice, J. C., & Kim, T. H. (2014). Characterization of vegetative storage protein (VSP) and low molecular proteins induced by water deficit in stolon of white clover. Biochemical and Biophysical Research Communications, 443(1), 229–233. https://doi.org/10.1016/j.bbrc.2013.11.087
- Mason, H. S., & Mullet, J. E. (1990). Expression of two soybean vegetative storage protein genes during development and in response to water deficit, wounding, and jasmonic acid. The Plant Cell, 2(6), 569–579. https://doi.org/10.1105/tpc.2.6.569
- Ogiwara, H. (2002). Delayed leaf senescence. In Agriculture, forestry and fisheries research council of japan, ed. Soybean-technical development for improving national food self-sufficiency ratio. (In Japanese). Annotated bibliography of agriculture, forestry, and fisheries research Vol. 27. (pp. 291–294). Tokyo, Japan: Association of agriculture and forestry statistics.
- Ogiwara, H., & Ishikura, N. (1994). Physiological analysis of delayed stem maturation in soybean plants and possibility of its prediction. (In Japanese). Japanese Journal of Crop Science, 63(Extra issue 2), 201–202.
- Ohashi, Y., Nakayama, N., Saneoka, H., Mohapatra, P., & Fujita, K. (2009). Differences in the responses of stem diameter and pod thickness to drought stress during the grain filling stage in soybean plants. Acta Physiologiae Plantarum, 31(2), 271–277. https://doi.org/10.1007/s11738-008-0229-4
- Sato, J., Shiraiwa, T., Sakashita, M., Tsujimoto, Y., & Yoshida, R. (2007). The occurrence of delayed stem senescence in relation to trans-zeatin riboside level in the xylem exudate in soybeans grown under excess-wet and drought soil conditions. Plant Production Science, 10(4), 460–467. https://doi.org/10.1626/pps.10.460
- Schneider, C. A., Rasband, W. S., & Eliceiri, K. W. (2012). NIH image to ImageJ: 25 years of image analysis. Nature Methods, 9(7), 671–675. https://doi.org/10.1038/nmeth.2089
- Shiraiwa, T., Sato, J., Sakashita, M., & Horie, T. (2005). The effect of soil water environment on nitrogen dynamics and plant development in soybean. Nihon Sakumotsu Gakkai kiji, 74(Suppl. 1), 378–379.
- Silva, A. J. D., Magalhães Filho, J. R., Sales, C. R. G., Pires, R. C. D. M., & Machado, E. C. (2018). Source-sink relationships in two soybean cultivars with indeterminate growth under water deficit. Bragantia, 77(1), 23–35. https://doi.org/10.1590/1678-4499.2017010
- Staswick, P. E. (1989a). Developmental regulation and the influence of plant sinks on vegetative storage protein gene expression in soybean leaves. Plant Physiology, 89(1), 309–315. https://doi.org/10.1104/pp.89.1.309
- Staswick, P. E. (1989b). Preferential loss of an abundant storage protein from soybean pods during seed development. Plant Physiology, 90(4), 1252–1255. https://doi.org/10.1104/pp.90.4.1252
- Staswick, P. E. (1994). Storage proteins of vegetative plant tissues. Annual Review of Plant Physiology and Plant Molecular Biology, 45(1), 303–322. https://doi.org/10.1146/annurev.pp.45.060194.001511
- Steele, C., & Grabau, L. (1997). Planting dates for early-maturing soybean cultivars. Agronomy Journal – AGRON J, 89(3), 449–453. https://doi.org/10.2134/agronj1997.00021962008900030013x
- Takeda, H., Ohdaira, Y., & Sasaki, R. (2006). Effect of drought from pod elongation stage to seed filling stage on green stem disorder and growth during maturation of soybean (In Japanese). Report of the Chugoku Branch of the Crop Science Society of Japan, 47, 32–33.
- Tsujimoto, Y., Sato, J., Shiraiwa, T., Tanaka, Y., & Horie, T. (2006). Field investigation of environmental factors causing delayed stem senescence in soybean. (In Japanese with English abstract). Kinki Journal of Crop Science and Breeding, 51, 37–43.
- Wittenbach, V. A. (1982). Effect of pod removal on leaf senescence in soybeans. Plant Physiology, 70(5), 1544–1548. https://doi.org/10.1104/pp.70.5.1544
- Wittenbach, V. A. (1983). Effect of pod removal on leaf photosynthesis and soluble protein composition of field-grown soybeans. Plant Physiology, 73(1), 121–124. https://doi.org/10.1104/pp.73.1.121
- Yamada, T., Shimada, S., Hajika, M., Hirata, K., Takahashi, K., Nagaya, T., Hamaguchi, H., Maekawa, T., Sayama, T., Hayashi, T., Ishimoto, M., & Tanaka, J. (2014). Major QTLs associated with green stem disorder insensitivity of soybean (Glycine max (L.) Merr.). Breeding Science, 64(4), 331–338. https://doi.org/10.1270/jsbbs.64.331
- Yamazaki, R., Katsube-Tanaka, T., Kawasaki, Y., Katayama, K., & Shiraiwa, T. (2019). Effect of thinning on cultivar differences of green stem disorder in soybean. Plant Production Science, 22(2), 311–318. https://doi.org/10.1080/1343943X.2018.1557531
- Yamazaki, R., Katsube-Tanaka, T., Ogiso-Tanaka, E., Kawasaki, Y., & Shiraiwa, T. (2022). High source–sink ratio at and after sink capacity formation promotes green stem disorder in soybean. Scientific reports, 12(1), 10440. https://doi.org/10.1038/s41598-022-14298-4
- Yamazaki, R., Katsube-Tanaka, T., & Shiraiwa, T. (2018). Effect of thinning and shade removal on green stem disorder in soybean. Plant Production Science, 21(2), 83–92. https://doi.org/10.1080/1343943X.2018.1446758
- Zhang, X., Wang, M., Wu, T., Wu, C., Jiang, B., Guo, C., & Han, T. (2016). Physiological and molecular studies of staygreen caused by pod removal and seed injury in soybean. The Crop Journall, 4(6), 435–443. https://doi.org/10.1016/j.cj.2016.04.002