ABSTRACT
Red crown rot (RCR) is a soil-borne disease that damages soybean growth and decreases yield. Infected plants show earlier defoliation and pencil-like roots, sometimes resulting in mortality. This disease became common relatively recently, and information about its field-scale appearance is insufficient. Insufficient data is a major constraint when planning countermeasures. In this study, unmanned aerial vehicle (UAV)-acquired images were used to visualize the spatial and time series variation in the area damaged by RCR in the same farmer fields in 2018 and 2020. Field investigation showed that RCR severely damaged soybean production. The reductions of yield were estimated at 17.5% and 12.7% in 2018 and 2020, respectively. The visualized damage clarified the difference in the increasing rate and patterns of RCR between the 2 years. In 2018, the damaged area expanded along the planting row to the whole field, but in 2020, the expansion along the planting row was not great, and half of the fields remained sparsely damage. This difference implies that various factors are associated with damage occurrence and pathogen distribution. The method applied in this study is effective in visualizing RCR damage, but further improvement is required in the evaluation of intermediate damage and the generalization of the evaluation procedure.
GRAPHICAL ABSTRACT
1. Introduction
Soybean (Glycine max (L.) Merr.) has several production constraints. One of the most serious is red crown rot (RCR) caused by the soil-borne pathogen Calonectria ilicicola. After first being observed in 1968 (Misonou, Citation1973), RCR has been recognized as a severe disease of soybean in Japan and has also been recently reported in other countries (Guan et al., Citation2010; Kleczewski et al., Citation2019). The infected plants exhibit symptoms of early defoliation and black root rot proceeding to pencil-like roots, resulting in yield loss (Ochi et al., Citation2014). Severe symptoms cause mortality (Nishi et al., Citation1989). The pathogen sometimes forms red perithecia on stems near the soil surface. This damage often appears at full pod (R4 (Fehr et al., Citation1981)) or beginning seed (R5) of soybean growth stages, which ranges from mid-August to early September in Japan (Akamatsu et al., Citation2020).
Appropriate countermeasures require information based on actual production scenes, such as farmer fields. However, only a few studies have quantitatively researched RCR damage to soybean in farmer fields. Akamatsu et al. (Citation2020) collected data in several prefectures and reported that past disease incidence and continuous soybean cultivation increased the damage severity. Ochi et al. (Citation2022) reported that the disease increased the occurrence of wrinkled seeds. Some studies have indicated that soil water variation is a factor promoting RCR outbreaks (Hujita et al., Citation1989; Nishi et al., Citation1994, Citation1999), but the outbreak factors remain unclear in farmer fields (Tazawa, Citation2013). Several countermeasures have been proposed (Matsuda et al., Citation2020; Yagihashi & Iwama, Citation2021), but effective management has not yet been developed. To quantify the outbreak factors and to establish countermeasure management, spatial and temporal observations of RCR damage in farmer fields are necessary.
Unmanned aerial vehicles (UAVs), such as drones, are utilized for spatial observation to capture the conditions of crop canopies in farmer fields (Inoue, Citation2020; Tsukaguchi et al., Citation2022; Zhou et al., Citation2021). Recently, the number of studies evaluating crop productivity based on UAV observations has increased (Hashimoto et al., Citation2019; Kawamura et al., Citation2020; Perros et al., Citation2021). Some studies have tried to evaluate crop disease using UAV (Neupane & Baysal-Gurel, Citation2021). Guo et al. (Citation2021) monitored wheat yellow rust using UAV with a hyperspectral sensor. Wang et al. (Citation2020) estimated cotton root rot damage using UAV. For soybean, Tetila et al. (Citation2017) detected foliar disease using UAV, but the pathogen species was not specified. Phillips et al. (Citation2021) collected data by UAV to analyze the effect of frogeye leaf spot on soybean productivity. However, to our knowledge, evaluation of RCR using UAVs has not been conducted, although field observations on the ground suggest that UAV observations could capture defoliation by the disease.
Supervised classification with UAVs has been commonly utilized to evaluate crop conditions in recent studies (G. Yang et al., Citation2017; Tsouros et al., Citation2019). For example, Hashimoto et al. (Citation2020) estimated the leaf area index in farmer fields, and Y. Yang et al. (Citation2022) estimated salt damage to rice. Several additional studies have addressed crop disease using supervised classification (Mattupalli et al., Citation2018; Rodríguez et al., Citation2021; Ye et al., Citation2020). Among the several machine learning methods, random forest classification is often selected due to its applicability and robustness (López-Calderón et al., Citation2020; Ok et al., Citation2012; Zhu et al., Citation2022). Random forest classification is a nonparametric learning method to classify data using an ensemble of several decision trees (Breiman, Citation2001; Müller, Citation2016). Many studies showed effectiveness to apply random forest classification for analyzing crop canopy states with UAV images, detecting weed in sunflower or cotton fields (De Castro et al., Citation2018), vegetation mapping in urban area (Feng et al., Citation2015) and identifying pest damage to corn (Tao et al., Citation2022).
Past studies mainly focused on physiological relations between RCR and soybean in laboratories or small plot fields. The research gaps of this study are (i) how RCR damage increases in farmer fields, and (ii) how much impact RCR has on yield. To answer them, this study conducted field investigation to evaluate RCR damage in soybean farmer fields. The spatial and temporal change of damaged area was observed by using UAV. The increase rate and pattern of the damaged area were evaluated after specifying the area by supervised classification. The outbreak factors and countermeasure management were discussed based on the increase rate and patterns observed.
2. Materials and methods
2.1. Study site
The study was conducted in soybean farmer fields in the coastal area of Sendai city, Miyagi prefecture, Japan, in 2018 and 2020 (38.22°N, 140.97°E). We selected 4 adjacent 1-ha fields from dozens of hectares that were managed by an agricultural cooperative corporation. The selected fields were the same in both years and used for rice production in 2017 and 2019. Cultivation methods were almost the same in the 2 years with no special measures for RCR. Drainage was conducted with open ditches and culverts. The planted cultivar was ‘Miyagishirome’, which is the most popular in the prefecture. Sowing dates were June 9 to 11 and June 8 to 9 in 2019 and 2020, respectively. All in one operation was conducted for seeding with ridging and fertilizing. The seed was treated with ‘Cruiser MAXX’ (Syngenta AG, Basel, Switzerland). Sowing density was 5 cm par seed on 70 cm interval row. Inter-tillage frequency was twice between late June and mid-July.
2.2. UAV data acquisition and image processing
To acquire multispectral images, we used a Sequoia multispectral imaging sensor (Parrot, Paris, France) mounted on a Phantom 3 Advanced UAV (DJI, Guangdong, China) in 2018. In 2020, we used a P4 Multispectral default sensor mounted on the UAV (DJI, Guangdong, China) () due to malfunction of Sequoia between the years. The former has bandwidths for green (G) 510–590 nm, red (R) 620–700 nm, red edge (RE) 725–745 nm, and near-infrared (NIR) 750–830 nm, and the latter has bandwidths for blue (B) 434–456 nm, G 544–576 nm, R 634–666 nm, RE 714–746 nm, and NIR 814–866 nm. Flight height was 50 m in 2018, but 120 m in 2020 to reduce flight time and to mitigate the change in solar radiation condition.
Table 1. Flight settings in 2018 and 2020. Overlap and sidelap rates were set at 80%. G: green, R: red, RE: red edge, and NIR: near infrared.
The Agisoft Metashape image processing software (Agisoft LLC, Saint Petersburg, Russia) and Pix4D mapper (Pix4D, Lausanne, Switzerland) were used in 2018 and 2020, respectively, to output orthomosaic reflectance images from the original images. The digital number recorded by the Sequoia sensor was converted to reflectance by importing calibrated reflectance panel (MicaSense, Seattle, USA) images taken before and after UAV flight to Agisoft Metashape. P4 Multispectral recorded reflectance factor by dividing reflected radiance by incident radiance. The reflectance factor was used as reflectance without any conversion by a Pix4D mapper.
2.3. Supervised classification of RCR-damaged area
The orthomosaic reflectance images were meshed to 1 × 1 m for the supervised classification of the RCR-damaged area. The damaged and nondamaged meshes were specified on the image for the labeled dataset (). Damaged meshes were chosen as the basis of color change from green to yellow.
Figure 1. Preparation of labeled meshes for supervised classification of red crown rot-damaged areas based on orthomosaic reflectance images. (a) Red and white circles show points manually specified as damaged and undamaged by red crown rot, respectively. (b) Damaged and nondamaged meshes are marked by red and white, respectively, based on (a). The mesh size is 1 × 1 m.
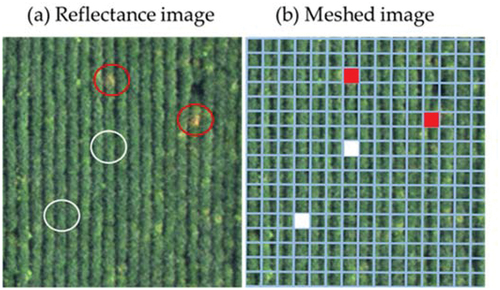
The RCR damage was confirmed by field observations. Any other foliar disease did not cause severe damage. The number of specified meshes is listed in . The number was determined considering the damage situation. Random forest classification was applied to the classification for each image with the free machine learning software scikit-learn ver. 0.21.3 (Pedregosa et al., Citation2011) with python 3.7 due to its availability and robustness. The explanatory variables were the maximum value, minimum value, mean, and standard deviation of reflectance of the four bands of G, R, RE, and NIR in a 1 × 1 m mesh. The labeled dataset was divided into a training dataset and a test dataset at ratios of 8 and 2, respectively. The classification model was evaluated by accuracy:
Table 2. Number of meshes of the labeled dataset and accuracy of supervised classification for each image in (a) 2018 and (b) 2020.
accuracy = (TP + TN) / (TP + TN + FP + FN)
where TP, TN, FP and FN indicate true positive, true negative, false-positive and false-negative, respectively. After confirming the accuracy, the models classified all meshes into damaged or nondamaged for each image. The free GIS software QGIS ver. 3.16 (QGIS Development Team, QGIS Geographic Information System) was used to visualize the red crown rot-damaged area, including geometric calibration. QGIS was also used to provide the most widely used vegetation index, Normalized Difference Vegetation Index (NDVI) (Rouse et al., Citation1973), calculated from spectral band of NIR and R:
NDVI = (NIR – R) / (NIR + R)
NDVI images were compared with classified images to clarify damage appearance.
2.4. Field investigation
We conducted a field investigation to observe RCR damage and evaluate the damage to soybean yield. The observations were conducted weekly from planting to harvesting at 80 and 32 investigation points in 2018 and 2020, respectively. Soil moisture content (SMC) was measured with TDR soil moisture meter ‘Field Scout TDR100’ (Spectrum Technologies, Inc., Aurora, USA). The average of 4 times of measurement at the point was used for analysis. Precipitation data was derived from the Automated Meteorological Data Acquisition System (AMeDAS) in Sendai, which is the nearest to the investigation fields. Additional observations were occasionally conducted to confirm the symptom caused by RCR. The coordinate of investigation points and tens of ground control points were measured by Pro Mark 120 GNSS system (Spectra Precision Division, Westminster, USA), providing the accuracy of a few centimeters. The damage to soybean yield was investigated at the 80 and 32 investigation points in 2018 and 2020, respectively. The investigation points were randomly selected in the research fields after seeding (no RCR symptoms were observed), and at each point, a 2-m-length on a planting row was evaluated. The mortality rate was measured by counting the ratio of dead plants to all plants within the 2-m-length on October 3 in both years, and the soybean yield was determined for the 2-m-length after threshing and drying the harvested plants at 80°C for 72 h.
2.5. Comparing classification and yield
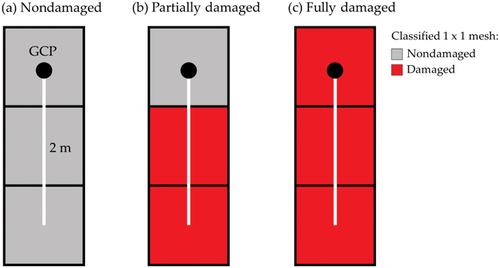
We compared the result of damaged area from classification results and determined yield to ensure feasibility of evaluating RCR. From the classification result, field investigation points were specified based on ground control points. Two or three meshes involved in the 2-m-length. Each involving case was assigned to three damage degrees, such as (a) nondamaged, (b)partially damaged, and (c) fully damaged ().
Figure 2. Categorization of damage degrees based on classification result. Black points were Ground Control Points (GCPs). White bars represented 2-m-length of field investigation range.
3. Results
3.1. Rainfall and measured SMC
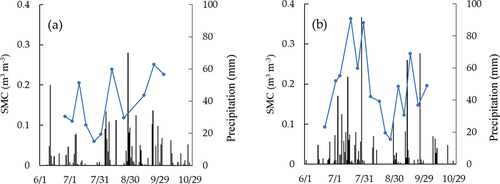
shows mean of measured SMC and daily precipitation for growth period. SMC changed almost consistently with precipitation in both years. SMC and rainfall tended to be higher in 2020 than 2018. The highest daily precipitation was 70 mm on August 28 and 91.5 mm on July 28, respectively. The highest SMC in the measurement was 0.25 m3m−3 on September 23 and 0.36 m3m−3 on July 17, in 2018 and 2020, respectively.
Figure 3. SMC value measured with TDR soil moisture meter (blue line) and daily precipitation (black bar) in (a) 2018 and (b) 2020.
3.2. Evaluation of RCR damage in farmer fields
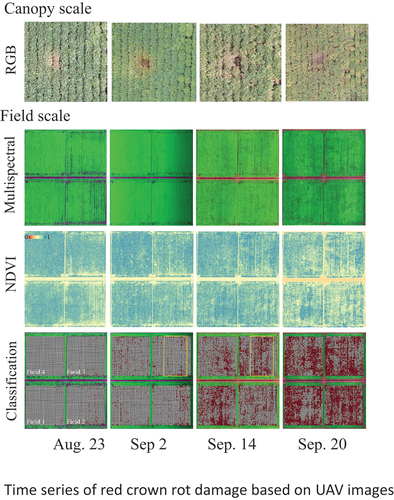
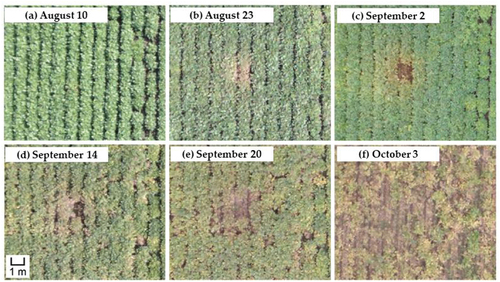
represents a time series of RCR damage with RGB images taken by the UAV. On (a) August 10, there was no evident change in the canopy. The beginning of RCR symptoms was confirmed by yellowness on (b) August 23. The center plants with symptoms were dead, and the soil surface was visible on (c) September 2. The surrounding plants also turned yellow, and their early defoliation developed from (d) September 14 to (e) 20. However, the symptoms were barely distinguishable from the ordinary senescence of the other plants on the image taken on (f) October 3. A similar process was also observed in 2020 (data not shown).
Figure 4. Time series RGB photos of the canopy damaged by red crown rot in 2018.
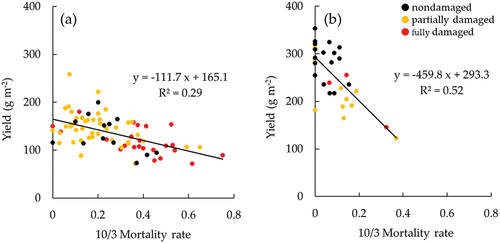
RCR damage occurred in a wide area in the fields during the soybean maturation period. The field investigation indicated that the mortality rates by red crown rot were significantly different between years. The averages of mortality rate on the investigation points were 0.26 and 0.081 in 2018 and 2020, respectively. shows the relationship between the mortality rate by RCR and the yield of soybean determined by field investigation. Although the yield was different between years, the mortality rate significantly reduced the yield in both years. The reduction of yield was estimated by dividing the average by the expected value without damage (y-intercept), resulting 28.9 g m−2 (17.5%) and 37.3 g m−2 (12.7%) in 2018 and 2020, respectively.
Figure 5. Relationship between mortality rate and yield of soybean in (a) 2018 and (b) 2020. The mortality rate and yield were determined for a 2-m-length on a planting row at the investigation points in the fields. The mortality rate was measured on October 3 in both years. The nondamaged, partially damaged, and fully damaged investigation points were included in nondamaged meshes, nondamaged and damaged meshes, and damaged meshes on September 14 in 2018 and on September 10 in 2020 in , respectively.
To evaluate relation of SMC and the mortality rate, we conducted correlation analysis using SMC for each investigated day. Correlation coefficients (r) were −0.19 to −0.092 and −0.062 to 0.47, in 2018 and 2020, respectively. SMC on July 24 (r = 0.47, p < 0.01) and on August 6 (r = 0.41, p < 0.05) in 2020 were only significant with the mortality rate in the two years.
3.3. Spatial and time-series variation in RCR
The difference of damage by RCR between years was partly observed in multispectral images and NDVI images taken by UAV (). Black dots in multispectral images were more remarkable and decrease of NDVI is larger in (a) 2018. However, since spatial variation of NDVI masked the decrease of NDVI, the difference between years was not so obvious.
Figure 6. Spatial variation in the time series of multispectral image (RGB = R-NIR-G in 2018 and R-G-B in 2020), NDVI ((NIR-R)/(NIR+R)), and the supervised classification in (a) 2018 and (b) 2020. The supervised classification model classified the 1 × 1 meshes into damaged (red) and nondamaged (white). Miss planted places were set to nondamaged. The four studied fields were the same in 2018 and 2020.
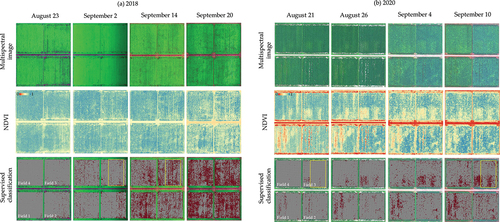
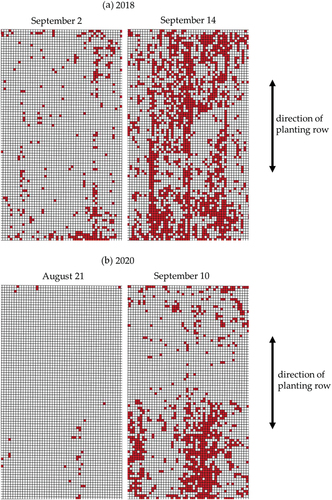
To highlight the damage area, the supervised classification was employed. The accuracies of the supervised classification models for the test dataset are shown in . These accuracies seemed to be sufficient to use the model. shows the spatial and time-series variations in the damaged area obtained by the application of the model in the study fields. The damaged area (number of red-colored meshes) increased as the dates passed. The damaged meshes occupied 31% on 14 September 2018 and 19% on 10 September 2020, being not completely consistent with the mortality rate on October 3 in both years, but the investigation points with higher mortality rate tended to be included in the damaged meshes (). The fields were the same in both years, but the spatial and time-series variations were different. shows enlarged display of the areas inside the yellow frame of in both years, respectively. This exhibited remarkable characteristics of spatial and time-series patterns of RCR damage. In 2018, the damaged area was sparse on September 2; and increased along planting rows (the arrow of ), occupying wide area on September 14. In 2020, the damaged area was also sparse on August 21; and increased in lower part while remained sparse in upper part of the area on September 10 (). The difference between years was commonly observed in the fields. Accordingly, some damaged areas in 2018 turned to nondamaged areas in 2020.
Figure 7. Typical expansion pattern of areas damaged by red crown rot in (a) 2018. And (b) 2020. The area was extracted from the yellow windows of .
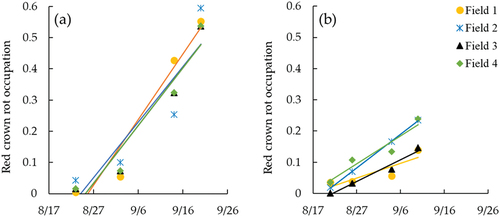
The increase in damaged area in each field was compared by the relationship between the dates and RCR occupation (), which were determined by the number of damaged meshes to that of total meshes for each field in . The increase rates of RCR occupation as slope of the liner regression were different between years: 0.019 day−1 in 2018 and 0.0079 day−1 in 2020 (p < 0.001). The increase rate was almost the same among fields in 2018 (p = 0.84), while those in fields 2 and 4 (0.011 day−1 and 0.0089 day−1, respectively) were larger than those in fields 1 and 3 (0.0048 day−1 and 0.0069 day−1, respectively) in 2020 (p < 0.001).
Figure 8. Time-series changes in the red crown rot occupation in each field in (a) 2018 and (b) 2020. The red crown rot occupation was determined by the number of damaged meshes to that of total meshes for each field in .
4. Discussion
Since RCR is one of the most serious diseases of soybean, evaluation of its behavior in farmer fields is required to consider countermeasures (Akamatsu et al., Citation2020). The field investigation conducted in this study revealed that the mortality rate by RCR directly reduced yield. The estimated reduction of yield reached 17.5% in 2018. The images taken by the UAV supported the observation of RCR damage expansion. Supervised classification quantified the spatial and time-series variation in RCR damage, which visualized the damaged area more clearly than multispectral images or NDVI images. The evaluation was conducted in the same fields in 2018 and 2020, but the mortality rate was significantly different, being consistent with the spatial and time-series variation. These expansion features have not been recently reported.
Discriminating RCR symptoms from other disease is one of the important topics in this study. In Miyagi prefecture, RCR has been a noticeable disease for years (Honkura & Oikawa, Citation1986; Sakurada et al., Citation2020). Honkura and Oikawa (Citation1986) reported RCR was the most widely increased disease in the prefecture. RCR apparently caused early defoliation starting in the middle of August in this study, which was also reported by other studies (Akamatsu et al., Citation2020; Arai et al., Citation2011; Mikoshiba et al., Citation2009; Tazawa, Citation2013). These distinguishable apparent changes are the key factor in specifying RCR damage in the UAV images (). Since farmers generally manage dozens of hectares of soybean fields and their priority is mostly on rice production, detection of first symptom is quite difficult. In the case of , farmers may recognize the occurrence of RCR damage on September 14. Accordingly, the specification in the image on August 23 provides much advantage for the farmers. After the specification, a dataset consisting of damaged and nondamaged meshes can be prepared to construct the learned model for supervised classification. This process is relatively less laborious and effective for evaluating damage as a substitute for laborious field investigations, although the intermediate damage level, such as a transition from no damage to damage, subjectively or cannot be currently evaluated.
The classification of damaged and nondamaged meshes featured the expansion of RCR damage. The damaged area seemed to increase from the early outbreak site to the surrounding area. The distribution of pathogens may cause their uneven occurrence, but the expansion was difficult to explain by the distribution only. Converting the fields from paddy fields every year may mitigate pathogen density. In 2018 and 2020, cultivation methods were almost the same, but damage expansion was different. In 2018, the damaged area expanded along the planting row. This expansion indicates distribution of pathogens by machine intertillage ridging for row planting (Nishi et al., Citation1999). However, the expansion along the planting row was not evident in 2020, and some damaged areas in 2018 turned into nondamaged areas in 2020, although ridging and intertillage were conducted in similar period of the years. The inconsistency in expansion patterns and damaged areas between the 2 years suggests that other factors associated with RCR in addition to pathogen distribution. Soil moisture condition change by inferior drainage or rainfall was regarded as a main factor of RCR increase in several studies (Nishi et al., Citation1999; Sakurada et al., Citation2020; Tohkairin et al., Citation1984). However, in this study, the relation of SMC and the mortality rate was weak. SMC was higher in 2020, but RCR damage was more severe in 2018. This implies soil water dynamics has more impact on RCR increase than simple average of SMC. Homma et al. (Citation2010) proposed a soil water balance simulation model to evaluate farmer fields. Applying this model for farmer fields can help to investigate more detail of relation of soil moisture conditions and RCR. Although a clear relationship was not shown, Kato et al. (Citation2022) reported the effect of soil properties on the occurrence of a soil-borne disease, Phytophthora root and stem rot, in soybean farming fields. Soil chemical/physical properties may also be important factors in RCR (Nishi et al., Citation1999; Ochi et al., Citation2022). RCR has a soil-infectious mechanism, and secondary infection is considered to be unlikely to occur (Akamatsu et al., Citation2020; Nishi et al., Citation1999). However, the expansion pattern suggests that secondary infection occurred in this study field. Infection in farmer fields may require reexamination.
RCR does not always cause defoliation. Infected plants with no symptoms are unlikely to result in large yield losses (Arai et al., Citation2011; Nishi et al., Citation1999; Tazawa, Citation2013). However, when severe damage occurs in the whole field, RCR is regarded as the main constraint of soybean cultivation, as shown in this study. To manage red crown rot, early detection is necessary. The optimum setting of the sensor angle and UAV flight height can help with early detection. Since defoliation affects canopy reflectance, satellite images are promising for wide-area evaluations (Hongo et al., Citation2022; Manago et al., Citation2020), although an increase in sensitivity may be necessary. To assess the damage of RCR to soybean yield, combining the present type of assessment with crop growth models (Jones et al., Citation2003; Sinclair, Citation1986) would be promising.
We also did not generalize the learned model to classify the damaged and nondamaged meshes because we focused on quantifying the damage in the study fields. The evaluation of intermediate damage and the generalization of the evaluation procedure are the next development goals, which will be attained by collecting data on several occasions.
5. Conclusions
To evaluate the spatial and time-series variation in damage by red crown rot (RCR) in soybean farmer fields, UAVs were utilized to collect multispectral images in the same fields in 2018 and 2020. The accompanying field investigation revealed that mortality by (RCR) directly reduced soybean yield in both years. The supervised classification with multispectral images visualized the spatial and time series of damage and quantified the increase rate of the damaged area. The visualized variation and the quantified increase rate were different between the years, suggesting that various factors are associated with the occurrence of damage in addition to pathogen distribution.
Acknowledgments
We thank Sendai Arahama, an agricultural cooperative corporation, for providing the soybean fields for UAV image collection and measurements. We thank all members of the Crop Science Laboratory of the Graduate School of Agricultural Science, Tohoku University.
Disclosure statement
No potential conflict of interest was reported by the author(s).
Additional information
Funding
References
- Akamatsu, H., Fujii, N., Saito, T., Sayama, A., Matsuda, H., Kato, M., Kowada, R., Yasuta, Y., Igarashi, Y., Komori, H., Tanji, K., Kuroda, T., Fujita, Y., Hattori, M., Kawakami, O., Hori, T., Mimuro, G., Morikawa, T., Murasaki, N. … Ochi, S. (2020). Factors affecting red crown rot caused by Calonectria ilicicola in soybean cultivation. Journal of General Plant Pathologyogy, 86(5), 363–375. https://doi.org/10.1007/s10327-020-00938-y
- Arai, Y., Endo, A., & Nihei, N. (2011). Growth and yield on occurrence time of soybean black root rot in fukushima prefecture. Tohoku Journal of Crop Science of Tohoku Journal of Crop Scienceence, 54(in Japanese), 43–44.
- Breiman, L. (2001). Random forests. Machine Learning, 45(1), 5–32. https://doi.org/10.1023/A:1010933404324
- De Castro, A. I., Torres-Sánchez, J., Peña, J. M., Jiménez-Brenes, F. M., Csillik, O., & López-Granados, F. (2018). An automatic random forest-obia algorithm for early weed mapping between and within crop rows using uav imagery. Remote Sensing, 10(2), 285. https://doi.org/10.3390/rs10020285
- Fehr, W. R., Lawrence, B. K., & Thompson, T. A. (1981). Critical stages of development for defoliation of soybean. Crop Science, 21(2), 259–262. https://doi.org/10.2135/cropsci1981.0011183X002100020014x
- Feng, Q., Liu, J., & Gong, J. (2015). UAV remote sensing for Urban vegetation mapping using random forest and texture analysis. Remote Sensing, 7(1), 1074–1094. https://doi.org/10.3390/rs70101074
- Guan, M., Pan, R., Gao, X., Xu, D., Deng, Q., & Deng, M. (2010). First report of red crown rot caused by cylindrocladium parasiticum on soybean in Guangdong, Southern China. Plant Disease, 94(4), 485. https://doi.org/10.1094/PDIS-94-4-0485B
- Guo, A., Huang, W., Dong, Y., Ye, H., Ma, H., Liu, B., Wu, W., Ren, Y., Ruan, C., & Geng, Y. (2021). Wheat yellow rust detection using UAV-based hyperspectral technology. Remote Sensing, 13(1), 123. https://doi.org/10.3390/rs13010123
- Hashimoto, N., Saito, Y., Maki, M., & Homma, K. (2019). Simulation of reflectance and vegetation indices for unmanned aerial vehicle (UAV) monitoring of paddy fields. Remote Sensing, 11(18), 2119. https://doi.org/10.3390/rs11182119
- Hashimoto, N., Saito, Y., Yamaoto, S., Maki, M., & Homma, K. (2020). Evaluation of machine learning to estimate lai including solar radiation condition at uav monitoring in paddy fields. Journal of the Remote Sensing Society of Japan, 40(2), 87–96. (in Japanese with English Abstract).
- Homma, K., Okai, H., Kurose, Y., Sudo, K., Ozaki, K., Shiraiwa, T., & Katsube-Tanaka, T. (2010). Application of water budget equation model to farmer’s fields of “Tambaguro” soybean. Journal of Crop Research, 55, 27–32. (in Japanese with English summary).
- Hongo, C., Takahashi, Y., Sigit, G., Utoyo, B., & Tamura, E. (2022). Advanced damage assessment method for bacterial leaf blight disease in rice by integrating remote sensing data for agricultural insurance. The Journal of Agricultural Science, 14(4), 1. https://doi.org/10.5539/jas.v14n4p1
- Honkura, R., & Oikawa, T. (1986). Occurrence of soybean disease in miyagi prefecture. Plants Protection, 40(7), 327–332.
- Hujita, Y., Takeda, T., Sakuma, H., Katoh, T., & Sato, Y. (1989). Ecology and control of caronectria root rot of soybean. Bulletin of the Yamagata Prefectural Agricultural Experoment Station, 24, 13–36. (in Japanese with English summary).
- Inoue, Y. (2020). Satellite- and drone-based remote sensing of crops and soils for smart farming – a review. Plant Production Science, 66(6), 798–810. https://doi.org/10.1080/00380768.2020.1738899
- Jones, J. W., Hoogenboom, G., Porter, C. H., Boote, K. J., Batchelor, W. D., Hunt, L. A., Wilkens, P. W., Singh, U., Gijsman, A. J., & Ritchie, J. T. (2003). The DSSAT cropping system model. European Journal of Agronomy, 18(3–4), 235–265. https://doi.org/10.1016/S1161-0301(02)00107-7
- Kato, M., Tada, T., & Shiraiwa, T. (2022). Relationship between variation of inter-field and intra-field environmental factors and the occurrence of phytophthora root and stem rot. Japanese Journal of Crop Science, 91(3), 223–229. (in Japanese with English abstract).
- Kawamura, K., Asai, H., Yasuda, T., Khanthavong, P., Soisouvanh, P., & Phongchanmixay, S. (2020). Field phenotyping of plant height in an upland rice field in Laos using low-cost small unmanned aerial vehicles (UAVs). Plant Production Science, 23(4), 452–465. https://doi.org/10.1080/1343943X.2020.1766362
- Kleczewski, N., Plewa, D., Kangas, C., Phillippi, E., & Kleczewski, V. (2019). First report of red crown rot of soybeans caused by calonectria ilicicola (anamorph: cylindrocladium parasiticum) in illinois. Plant Disease, 103(7), 1777. https://doi.org/10.1094/PDIS-01-19-0105-PDN
- López-Calderón, M. J., Estrada-Ávalos, J., Rodríguez-Moreno, V. M., Mauricio-Ruvalcaba, J. E., Martínez-Sifuentes, A. R., Delgado-Ramírez, G., & Miguel-Valle, E. (2020). Estimation of total nitrogen content in forage maize (zea mays l.) using spectral indices: analysis by random forest. Agriculture, 10(10), 451. https://doi.org/10.3390/agriculture10100451
- Manago, N., Hongo, C., Sofue, Y., Sigit, G., & Utoyo, B. (2020). Transplanting date estimation using sentinel-1 satellite data for paddy rice damage assessment in Indonesia. Agriculture, 10(12), 625. https://doi.org/10.3390/agriculture10120625
- Matsuda, H., Watanabe, K., Fujii, N., Nakagawa, S., Toda, T., & Sato, T. (2020). Microbial material mixed Bacillus to suppress red crown root of soybean by Calonectria ilicicola. Tohoku Journal of Agricultural Researchearch, 73(in Japanese), 29–30.
- Mattupalli, C., Moffet, C. A., Shah, K. N., & Young, C. A. (2018). Supervised classification of rgb aerial imagery to evaluate the impact of a root rot disease. Remote Sensing, 10(6), 917. https://doi.org/10.3390/rs10060917
- Mikoshiba, H., Homma, K., Ushio, A., Okai, H., Ozaki, K., & Shiraiwa, T. (2009). Analysis of production variability of soybean ‘tanbakuro’. ii. difference in yield and planting environment among 4 villages in tanba in 2007. Journal of Crop Research, 54, 9–17. in Japanese with English summary).
- Misonou, T. (1973). New black root rot disease in soybeans and peanuts caused by Calonectria crotalariae. Plant Protection, 27(in Japanese), 77–82.
- Müller, A. C. (2016). Introduction to machine learning with python, a guide for data scientists. O’Reilly Media.
- Neupane, K., & Baysal-Gurel, F. (2021). Automatic identification and monitoring of plant disease using unmanned aerial vehicles: a review. Remote Sensing, 13(19), 3841. https://doi.org/10.3390/rs13193841
- Nishi, K., Sato, F., Karasawa, T., Sato, T., Fukuda, T., & Takahashi, H. (1999). Ecology and control of root necrosis of soybean caused by Calonectria crotalariae. Bulletin of the National Agricultural Research Center for Western Region of the Bulletin of the National Agricultural Research Center for Western Region, 30, 11–109. in Japanese with English summary).
- Nishi, K., Sato, F., Karasawa, T., & Takahashi, H. (1989). Yield loss associated with disease severity of Calonectria root rot in soybean. Annual Report of the Kanto-Tosan Plant Protection Society, 36(in Japanese), 37–38.
- Nishi, K., Tsukuda, K., Sato, T., & Hagiwara, H. (1994). Control of root necrosis of soybean caused by calonectria crotalariae by paddy-upland rotation. Annual Report of the Kanto-Tosan Plant Protection Society, 41(in Japanese), 51–54.
- Ochi, S., Kuroda, T., & Nakagawa, A. (2014). The development of quantitative method for isolating calonectria ilicicola from naturally infested soils. Plant Protection, 68(2), 84–87.
- Ochi, S., Mimuro, G., & Kishi, S. (2022). Effect of red crown rot of soybean on occurrence of wrinkled seeds. Journal of General Plant Pathologyogy, 88(4), 232–238. https://doi.org/10.1007/s10327-022-01064-7
- Ok, A. S., Akar, O., & Gungor, O. (2012). Evaluation of random forest method for agricultural crop classification. European Journal of Remote Sensing, 45(1), 421–432. https://doi.org/10.5721/EuJRS20124535
- Pedregosa, F., Varoquaux, G., Gramfort, A., Michel, V., Thirion, B., Grisel, O., Blondel, M., Prettenhofer, P., Weiss, R., Dubourg, V., Vanderplas, J., Passos, A., Cournapeau, D., Brucher, M., Perrot, M., & Duchesnay, E. (2011). Scikit-learn: machine learning in python. Journal of Machine Learning Researchearch, 12(85), 2825–2830.
- Perros, N., Kalivas, D., & Giovos, R. (2021). Spatial analysis of agronomic data and uav imagery for rice yield estimation. Agriculture, 11(9), 809. https://doi.org/10.3390/agriculture11090809
- Phillips, X. A., Kandel, Y. R., & Mueller, D. S. (2021). Impact of foliar fungicides on frogeye leaf spot severity, radiation use efficiency and yield of soybean in Iowa. Agronomy, 11(9), 1785. https://doi.org/10.3390/agronomy11091785
- Rodríguez, J., Lizarazo, I., Prieto, F., & Angulo-Morales, V. (2021). Assessment of potato late blight from UAV-based multispectral imagery. Computers and Electronics in Agriculture, 184, 106061. https://doi.org/10.1016/j.compag.2021.106061
- Rouse, J. W., Haas, R. H., Schell, J. A., & Deering, D. W. (1973). Monitoring vegetation systems in the great plains with ERTS (Earth Resources Technology Satellite). Proceedings of 3rd Earth Resources Technology Satellite Symposium, NASA, SP-351 I (pp. 309–317). Washington, D.C.
- Sakurada, H., Konno, T., Tsuji, H., Miyano, N., & Suzuki, T. (2020). A survey on occurrence of soybean root necrosis in miyagi prefecture. Bulletin of the Miyagi Prefectural Furukawa Agricultural Experiment Station, 16(in Japanese), 11–16.
- Sinclair, T. R. (1986). Water and nitrogen limitations in soybean grain production. I. Model development. Field Crops Research, 15(2), 125–141. https://doi.org/10.1016/0378-4290(86)90082-1
- Tao, W., Wang, X., Xue, J. H., Su, W., Zhang, M., Yin, D., Zhu, D., Xie, Z., & Zhang, Y. (2022). Monitoring the damage of armyworm as a pest in summer corn by unmanned aerial vehicle imaging. Pest Management Science, 78(6), 2265–2276. https://doi.org/10.1002/ps.6852
- Tazawa, J. (2013). Occurrence and control of red crown rot of soybean. Plant Protection, 67(2), 100–103.
- Tetila, E. S., Machado, B. B., de Souza Belete, N. A., Guimarães, D. A., & Pstori, H. (2017). Identification of soybean foliar diseases using unmanned aerial vehicle images. IEEE Geoscience and Remote Sensing Letters, 14(12), 2190–2194. https://doi.org/10.1109/LGRS.2017.2743715
- Tohkairin, H., Takeda, T., Aragaki, K., & Miura, H. (1984). Occurrence and some investigations of root necrosis by calonectria crotalariae (Loos) bell et sobers, of soybean in yamagata prefecture. Annual Report of the Society of Plant Protection of North Japan, 35(in Japanese), 46–49.
- Tsouros, D. C., Bibi, S., & Sarigiannidis, P. G. (2019). A review on uav-based applications for precision agriculture. Information, 10(11), 349. https://doi.org/10.3390/info10110349
- Tsukaguchi, T., Kobayashi, H., Fujihara, Y., & Chono, S. (2022). Estimation of spikelet number per area by UAV-acquired vegetation index in rice (Oryza sativa L.). Plant Production Science, 25(1), 20–29. https://doi.org/10.1080/1343943X.2021.1943467
- Wang, T., Thomasson, J. A., Yang, C., Isakeit, T., & Nichols, R. L. (2020). Automatic classification of cotton root rot disease based on uav remote sensing. Remote Sensing, 12(8), 1310. https://doi.org/10.3390/rs12081310
- Yagihashi, S., & Iwama, S. (2021). Suppressive effect of foliar application of liquid phosphite fertilizer against soybean root necrosis caused by Calonectria ilicicola. Annual Report of the Society of Plant Protection of North Japan, 72(in Japanese), 35–40.
- Yang, G., Liu, J., Zhao, C., Li, Z., Huang, Y., Yu, H., Xu, B., Yang, X., Zhu, D., Zhang, X., Zhang, R., Feng, H., Zhao, X., Li, Z., Li, H., & Yang, H. (2017). Unmanned aerial vehicle remote sensing for field-based crop phenotyping: Current status and perspectives. Frontiers in Plant Science, 8, 1111. https://doi.org/10.3389/fpls.2017.01111
- Yang, Y., Maki, M., Ye, R., Saito, D., Nontasri, T., Srisutham, M., Sritumboon, S., Sukchan, S., Yoshida, K., Oki, K., & Homma, K. (2022). Yearly change in severely salt-damaged areas in paddy fields in Ban Phai in Northeast Thailand. Hydrological Research Letters, 16(1), 7–11. https://doi.org/10.3178/hrl.16.7
- Ye, H., Huang, W., Huang, S., Cui, B., Dong, Y., Guo, A., Ren, Y., & Jin, Y. (2020). Identification of banana fusarium wilt using supervised classification algorithms with UAV-based multi-spectral imagery. International Journal of Agricultural and Biological Engineering, 13(3), 136–142. https://doi.org/10.25165/j.ijabe.20201303.5524
- Zhou, X., Kono, Y., Win, A., Matsui, T., & Tanaka, T. S. T. (2021). Predicting within-field variability in grain yield and protein content of winter wheat using UAV-based multispectral imagery and machine learning approaches. Plant Production Science, 24(2), 137–151. https://doi.org/10.1080/1343943X.2020.1819165
- Zhu, W., Rezaei, E. E., Nouri, H., Sun, Z., Li, J., Yu, D., & Siebert, S. (2022). UAV-based indicators of crop growth are robust for distinct water and nutrient management but vary between crop development phases. Field Crops Research, 284(1), 108582. https://doi.org/10.1016/j.fcr.2022.108582