 ?Mathematical formulae have been encoded as MathML and are displayed in this HTML version using MathJax in order to improve their display. Uncheck the box to turn MathJax off. This feature requires Javascript. Click on a formula to zoom.
ABSTRACT
We aimed to associate unmanned aerial vehicle – acquired vegetation index (VI) with the percentage of several kinds of imperfect grains and grain protein content (GPC) for use as an indicator of rice grain quality. The cultivars ‘Koshihikari’ and ‘Ishikawa 65’ were grown in the field from 2019 to 2022 at various N application rates. From 20 days before heading to 10 days after heading, the field was imaged with a multispectral camera to construct VI maps. We measured the chlorophyll index at heading (CIG0) and two climate factors, mean air temperature in the 20-day period after heading (T +20) and cumulative solar radiation in the 20-day period before heading (R−20). At maturity, we harvested plants to determine grain yield and quality. We assessed the percentages of two types of chalky grains basal-white and white-back grains (BBWG), milky-white grains (MWG), as well as other types of immature grains (OTG) and GPC. In Koshihikari, CIG0 and climate factors were associated with BBWG and MWG, whereas in Ishikawa 65, they were associated with BBWG, MWG, and OTG. Based on these findings, the response of BBWG, MWG, OTG, and GPC to CIG0 was estimated using the mean T +20 and R−20 values from the last 10 years. We found that as CIG0 increases, the sum of BBWG and MWG decreases in Koshihikari, whereas the sum of BBWG, OTG, and MWG increases in Ishikawa 65. Thus, CIG0 is an acceptable indicator of grain quality in rice.
GRAPHICAL ABSTRACT
Introduction
In rice cultivation, improving grain quality is an important issue under the warming trend in recent years because high temperature during grain-filling decreases grain quality, producing imperfect grains. Imperfect grains include cracked grains and immature grains including several types of chalky grains and other types of immature grains, such as insufficiently filled grains with a deep crease. Imperfect grains are induced not only by high temperature during grain-filling but by a number of plant factors (Morita et al., Citation2016). Numerous previous studies have reported that the occurrence of chalky grains, i.e. milky-white grains (MWG) and basal-white grains and white-back grains (collectively, BBWG), is associated with the amount or the timing of nitrogen (N) application (Takata et al., Citation2010; Tanaka et al., Citation2010; Tsukimori, Citation2008; Wakamatsu et al., Citation2008), suggesting an association between production of chalky grains and plant N status. However, N status affects production of each type of chalky grain differently. Because the percentage of MWG is negatively correlated with the amount of assimilate per spikelet (Tsukaguchi & Iida, Citation2008), plant N status affects MWG indirectly through the number of spikelets and photosynthetic ability. On the other hand, BBWG are affected directly by plant N status, not through the number of spikelets per area (Morita et al., Citation2016). A modeling analysis of plant N dynamics based on the above assumptions was able to estimate MWG and BBWG (Yoshida et al., Citation2016). These findings suggest that at each growth stage there may be a plant N content that minimizes the percentage of imperfect grains, depending upon climate conditions.
Remote sensing techniques that can be used to nondestructively estimate plant parameters such as growth parameters and N status have recently become available. Various vegetation indices (VIs) based on spectral reflectance data have been proposed. VIs using the reflectance of certain spectral bands can accurately estimate canopy chlorophyll content (Inoue et al., Citation2016) and canopy N content (Erdle et al., Citation2011; Li et al., Citation2014; Nguy-Robertson et al., Citation2012; Patel et al., Citation2021; Vina et al., Citation2011). Some VIs can be obtained by using a commercially available and affordable multispectral camera mounted on an unmanned aerial vehicle (UAV) or a portable sensor and have been used for growth diagnosis. Tsukaguchi et al. (Citation2022) showed a linear relation between rice plant N content at the reproductive stage and chlorophyll index green (CIgreen), a VI calculated from green and near-infrared (NIR) reflectance data (Gitelson et al., Citation2003). To date, no VIs directly associated with grain quality have been identified. However, the number of spikelets per area was estimated based on CIgreen data obtained nondestructively with a multispectral camera mounted on a UAV and a climate factor, cumulative solar radiation in the 15-day period before heading (Tsukaguchi et al., Citation2022). Using a similar method, grain quality could be explained with CIgreen and climate factors. If grain quality is associated with CIgreen at heading, then the CIgreen value necessary to achieve an acceptable level of imperfect grains could be targeted and achieved by top dressing.
Here, we focused on MWG, BBWG, insufficiently filled grains (classified as other types of immature grains, OTG), and grain protein content (GPC) in the ‘Koshihikari’ and ‘Ishikawa 65’ cultivars. In Ishikawa Prefecture, the imperfect grains of Koshihikari are primarily of the MWG, BBWG and cracked grains, and those of Ishikawa 65 are MWG, BBWG, OTG and cracked grains (Nakamura, Citation2018). Because chalkiness often occurs in both the back and basal parts of a single grain, we combined basal-white and white-back grains into the single category of BBWG. Because percentage of cracked grains is influenced by harvest date, and our harvest dates varied between years, we have excluded cracked grains from our analyses. We also measured GPC because it is associated with palatability and is highly affected by plant N status around the heading stage (Tsukaguchi et al., Citation2016). The objective of this study was to determine whether BBWG, MWG, OTG, and GPC are associated with CIgreen at heading (CIG0) and two climate factors, mean air temperature in the 20-day period after heading (T+20) and cumulative solar radiation in the 20-day period before heading (R−20). Because chalky grains are induced by high temperature during the first half of the period of grain filling (Tashiro & Wardlaw, Citation1991), we used T+20. Solar radiation in the 20-day period before heading affects the number of spikelets (Wada, Citation1969) and the amount of non-structural carbohydrates (NSC) stored in vegetative parts at heading, which can be used for grain filling (Nagata et al., Citation2001). We used a multispectral camera mounted on a UAV to measure CIgreen.
Materials and methods
Plant materials
The experiments were performed at the University Farm of Ishikawa Prefectural University, Nonoichi, Japan (36°02′N, 140°04′E), in Gray Lowland soil. From 2019 to 2022, two Japanese rice (Oryza sativa L.) cultivars, Ishikawa 65 (also known as Hyakumangoku) and Koshihikari, were grown. These high-quality cultivars are widely grown in Ishikawa Prefecture, the cultivation areas of Koshihikari and Ishikawa 65 in 2022 were 13,484 ha and 1,911 ha, respectively (2023, Ishikawa Prefecture, non-public data). Each year, we grew these two cultivars in one or two croppings with different transplanting dates and with a wide range of N applications; we grew Ishikawa 65 at two transplanting densities (). Some of the VI data and the number of spikelets per area in 2019 and 2020 were reported in Tsukaguchi et al. (Citation2022). Each year, 3 seedlings (18–28 days old) were transplanted in a rectangular planting pattern at 11.1 hills m−2 (30 cm × 30 cm; inter-row space × inter-hill space), 17.4 hills m−2 (30 cm × 19 cm), 18.5 hills m−2 (30 cm × 18 cm), and 22.2 hills m−2 (30 cm × 15 cm). Plot area was at least 25 m2. N application rate was set from 0.0 g m−2 to 14.6 g m−2. N was applied as coated urea and ammonium sulfate. Phosphorus (10 g m−2 as calcium superphosphate) and potassium (10 g m−2 as potassium chloride) were applied to all plots as basal fertilizers. Weeds, insects, and diseases were controlled with standard chemicals as necessary.
Table 1. Transplanting and heading dates, N levels, transplanting density and number of plots per planting date in Koshihikari and Ishikawa 65.
Measurement of yield and grain quality
At maturity, all plants in a randomly selected area of four rows by four hills in each plot were harvested for the determination of grain yield and quality. Panicles were counted and threshed, the total spikelet weight was recorded, and two subsamples (~100 g each) were taken. In the first subsample, the number of spikelets was counted, and the total number was calculated from the subsample and sample weights. The proportion of filled spikelets was determined by using NaCl solutions with a specific gravity of 1.06. Single-filled-grain weight of filled spikelets was determined and adjusted to 14% moisture content. Grain yield was calculated as the product of the number of spikelets per area, the proportion of filled grains, and single-filled-grain weight of filled spikelets. Spikelets in the second subsample were hulled, and 2000 grains, each thicker than 1.8 mm, were used to determine the proportion of MWG, BBWG, OTG, and cracked grains with a grain quality inspector (RGQI20A, Satake Co., Japan). Although sieve size used in Ishikawa Prefecture is 1.85 mm, we only have a screen with 1.80 mm sieve. Each year, in several plots, we visually verified each type of grain sorted by the grain quality inspector because the inspector classifies grains with dorsal or ventral chalkiness as white-belly grains not distinguishing white-back grains and white-belly grains. We verified that the grains defined as white-belly grains can be classified as white-back grains; we therefore considered the sum of the basal-white and white-belly grains to be basal- and white-back grains (BBWG). Grain from all categories was then combined and ground into a powder, and N content was measured by the Dumas combustion method (NCH Analyzer, Sumika Chemical Analysis Service, Tokyo, Japan). GPC was calculated by multiplying the N content by 5.95 (Jones, Citation1941). The moisture content of each sample was determined, and GPC was adjusted to a 14% grain moisture content.
Monitoring and calculation of vegetation indices (VIs)
Every 4 to 8 days, from around 20 days before heading to around 10 days after heading, we recorded the paddy field with a multispectral camera (Sequoia, Parrot, Paris, France) mounted on a UAV (Bluegrass, Parrot), as described in Tsukaguchi et al. (Citation2022). On the same dates, we captured RGB images with an RGB camera mounted on another UAV (Phantom 4 Pro, DJI, Hong Kong). Autonomous flight plans were plotted in Pix4Dcapture software (Pix4D S.A., Lausanne, Switzerland), with 80% front overlap, 80% side overlap, and a flight height of 30 m. The flight time was approximately in 10 min, and image sets were captured at 1-s intervals. Images taken by both cameras have embedded GPS data, and those taken by the Sequoia also incorporate irradiance data captured by an attached sunshine sensor. Before each flight of the Bluegrass UAV, images of a calibrated reflectance panel at 1 m height were captured. We set nine ground control points and the image reflectance was adjusted for the reflectance data of the calibration panel. The raw spectral images were then processed in Pix4Dmapper to reconstruct 4-band ortho-mosaic images. The raw RGB images were processed similarly but without irradiance calibration.
A VI, CIgreen, was calculated from the pixel data of the spectral ortho-images, and CIgreen maps were created in QGIS v. 3.1 software (QGIS Development Team). CIgreen (Gitelson et al., Citation2003) was calculated as:
where NIR and Green are the reflectance values of NIR and green.
Determination of CIgreen and cumulative solar radiation of the canopy at harvest
For the determination of grain yield and quality, we defined the harvest area as a shape file (Tsukaguchi et al., Citation2022). Harvest area was considered as a rectangle with the intermediate lines between the harvested hills and the surrounding hills as the long and short sides. From each CIgreen map, CIgreen values were averaged over pixels in the area defined by the shape file. For the calculation of CIgreen values at heading (CIG0), the periodic CIgreen data were fitted to a cubic curve and values on the exact dates were interpolated because CIgreen data could not be obtained at the precise heading date in all plots. The cumulative solar radiation in the 20 days before heading, R−20, and mean air temperature in the 20 days after heading, T+20, were calculated from the climate data obtained from Agro-Meteorological Grid Square Data, provided by the National Agriculture and Food Research Organization (NARO).
Statistical analysis
Multiple regression analysis was conducted using CIG0, R−20, and T+20 as the independent variables and BBWG, MWG, OTG, and GPC as dependent variables in SPSS v. 21 software (SPSS Inc., Chicago, IL, USA). The root-mean-square error (RMSE) was calculated as:
where is the estimated BBWG, MWG, OTG, or GPC;
is the measured BBWG, MWG, OTG, or GPC; and n is the number of samples.
Results
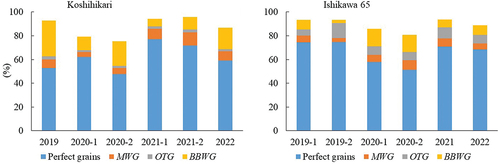
shows the mean percentage of perfect grains, BBWG, MWG, and OTG of each crop in each year. Most of the remaining grains were cracked grains, and in 2020 and 2022, these accounted for > 20% in Koshihikari and > 10% in Ishikawa 65. In Koshihikari, most imperfect grains were BBWG and MWG, whereas in Ishikawa 65, they were BBWG, OTG, and MWG.
Figure 1. Percentages of BBWG, MWG, OTG, and perfect grains averaged over plots in each cropping in Koshihikari and Ishikawa 65.
We found significant negative correlations between BBWG and CIG0 in Koshihikari (r = −0.51, P < 0.001) (). Although there was no significant correlation between BBWG and CIG0 in Ishikawa 65, they were negatively associated in each cropping. BBWG was positively correlated with T+20 and negatively correlated with R−20 in both cultivars.
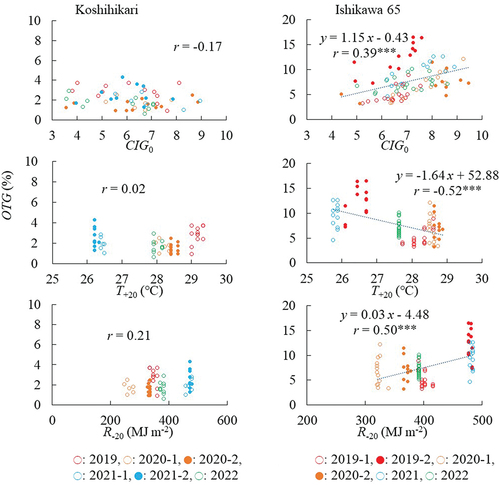
Figure 2. Relations between CIG0, T +20, or R−20 and BBWG in Koshihikari and Ishikawa 65.
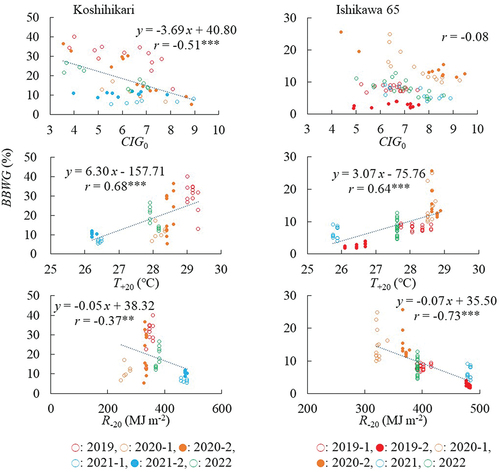
There were significant correlations between MWG and CIG0 (r = 0.53, P < 0.001) in Ishikawa 65, but not in Koshihikari (). The associations between MWG and climate factors differed between cultivars. MWG negatively correlated with T+20 in Koshihikari (r = −0.47, P < 0.001), but positively (r = 0.23, P < 0.05) in Ishikawa 65. The correlation between MWG and R−20 was positive in Koshihikari (r = 0.58, P < 0.001) but negative in Ishikawa 65 (r = −0.33, P < 0.01).
Figure 3. Relations between CIG0, T +20, or R−20 and MWG in Koshihikari and Ishikawa 65.
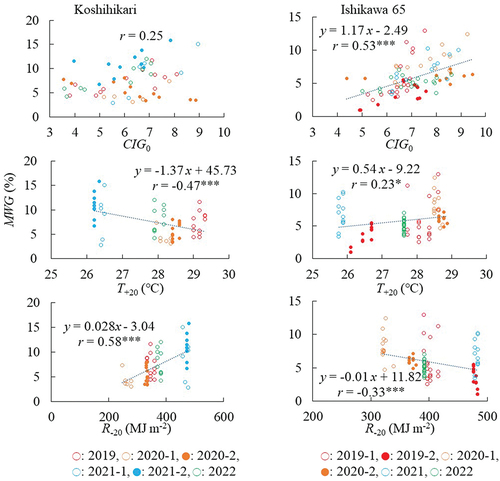
In Koshihikari, the percentage of OTG was low (<5%), and there was no significant correlation between OTG and CIG0 or climate factors (). In Ishikawa 65, on the other hand, OTG was positively correlated with CIG0 (r = 0.39, P < 0.001) and R−20 (r = 0.50, P < 0.001) and negatively correlated with T+20 (r = −0.52, P < 0.001).
Figure 4. Relations between CIG0, T +20, or R−20 and OTG in Koshihikari and Ishikawa 65.
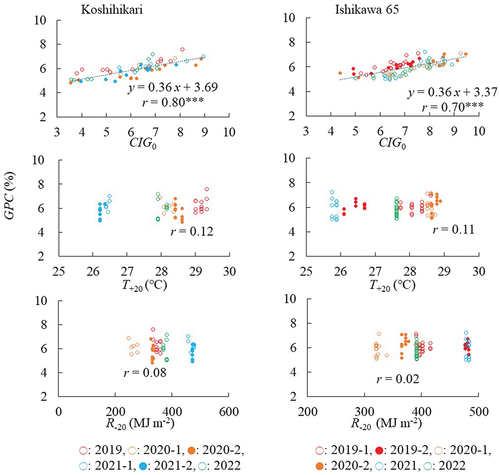
GPC was positively correlated with CIG0 (r = 0.80 in Koshihikari and r = 0.70 in Ishikawa 65, both P < 0.001) (). There was no correlation between GPC and climate factors in either cultivar.
Figure 5. Relations between CIG0, T +20, or R−20 and GPC in Koshihikari and Ishikawa 65.
shows the results of the multiple regression analysis. In the results for Ishikawa 65 with BBWG, MWG and OTG as the dependent variables, VIFs for R−20 and T+20 were > 5.0 because of the high negative correlation (r = −0.92) between them. Therefore, we used either variable R−20 or T+20, for the multiple regression in Ishikawa 65. The regressions with significant independent variables were shown. In the multiple regressions with BBWG as the dependent variable in Koshihikari, all independent variables (CIG0, R−20, and T+20) were significant. The coefficient of CIG0 was negative, and that for T+20 was positive. The coefficient for R−20 was positive although R−20 was negatively correlated with BBWG (). The result for Ishikawa 65 with BBWG as the dependent variable was similar, with CIG0 and either R−20 or T+20 with significant associations. The coefficients for CIG0, and R−20 were negative, and that for T+20 was positive. With MWG as the dependent variable, the independent variables CIG0 and R−20 were significant in both cultivars. The coefficients for CIG0 were positive in both cultivars and those for R−20 were positive in Koshihikari and negative in Ishikawa 65. In Ishikawa 65, with OTG as the dependent variable, the independent variables CIG0 and either R−20 or T+20 were significant. The coefficients for CIG0 and R−20 were positive, and that for T+20 was negative. In the regressions with GPC as the dependent variable, the independent variables of T+20 and R−20 were not significant in either cultivar but CIG0 were significant in both cultivars.
Table 2. Multiple regression analysis with BBWG, MWG, OTG, and GPC as dependent variables and CIG0, R−20, and T +20 are independent variables.
Discussion
In Koshihikari, most imperfect grains, except for cracked grains, were classified as BBWG and MWG and in Ishikawa 65 most were BBWG, OTG, and MWG (). In 2020 and 2022, a substantial percentage of grains were cracked (data not shown). Although cracked grain is associated with climate factors and plant N status (Nagata et al., Citation2004; Takahashi et al., Citation2002), it is also affected by harvest time, and a late harvest increases the percentage of cracked grains (Takita, Citation1999). The high percentage of cracked grains in 2020 and 2022 was presumably because the harvest time was more than a week later than physiological maturity, at 90% yellowing of the palea and lemma. Because harvest time differed among years, we focused on BBWG, MWG, and OTG.
BBWG was well explained by CIG0 combined with T+20 and R−20 in Koshihikari and by CIG0 and R−20 or by CIG0 and T+20 in Ishikawa 65 (). In the multiple regressions with BBWG as a dependent variable, the coefficients of CIG0 were negative, suggesting that higher N uptake at heading reduces BBWG, which agrees well with previous results. The percentage of white back grains or basal white grains is reduced by increasing N top dressing or basal N application (Takata et al., Citation2010; Wakamatsu et al., Citation2008) and BBWG is negatively associated with the amount of N uptake at heading (Tanaka et al., Citation2010). In these analyses, the coefficients of T+20 were positive, which also agrees with previous results that high temperature during grain filling increases BBWG (Nagato & Ebata, Citation1965; Wakamatsu et al., Citation2007). On the other hand, the coefficients of R−20 were not consistent between cultivars. In Koshihikari, the coefficients were positive and BBWG was higher at high R−20, which agrees with previous reports. The association between plant N status and BBWG is presumably mediated by plant N concentration (Morita et al., Citation2016), as suggested by the negative correlation between SPAD at heading and the percentage of basal-white grains (Sato et al., Citation2015), as well as by the increment of basal-white grains by CO2 enrichment, which increases dry matter production resulting in a decline in plant N concentration (Usui et al., Citation2014). Higher R−20 would increase dry matter production, leading to lower plant N concentration through a dilution effect (Greenwood et al., Citation1990). On the other hand, the coefficients of R−20 were negative in Ishikawa 65, which is difficult to explain. In our cultivation of Ishikawa 65 from 2019 to 2022, however, R−20 was negatively correlated with T+20 (r = −0.92). Considering the positive effect of T+20 on BBWG, the apparent negative effect of R−20 on BBWG may only reflect the negative correlation between T+20 and R−20 here. Even though there may have been effects of R−20 on BBWG, they might have been negated by the effect of T+20 and thus would be difficult to evaluate appropriately with our current data of Ishikawa 65. The association of BBWG and R−20 in Ishikawa 65 should be investigated further with more data obtained in other years. In both cultivars, the associations between BBWG and CIG0 or climate factors were concordant with previously reported associations between BBWG and crop N status or climate factors.
In the multiple regressions with MWG as the dependent variable, the coefficients of CIG0 were positive, suggesting that higher N uptake at heading increases MWG. These results agree well with previous results. MWG is negatively correlated with the amount of assimilate per spikelet and is increased by high temperature at a given assimilate supply (Tsukaguchi & Iida, Citation2008). An excessive number of spikelets per area increases MWG (Tsukimori, Citation2008), presumably by decreasing the assimilate supply per spikelet; N uptake at heading is positively associated with the number of spikelets per area (Wada, Citation1969). On the other hand, the independent variable T+20 was not significant, which seems to be contrary to many observations (Kobata et al., Citation2004; Nagato & Ebata, Citation1965; Tashiro & Wardlaw, Citation1991; Tsukimori, Citation2008; Wakamatsu et al., Citation2007). A potential reason for this would be the positive correlation between T+20 and solar radiation in the same period (data not shown), which is usually the case in the summer season in Ishikawa Prefecture. A higher T+20 would increase MWG at a given assimilate supply but the concomitant higher solar radiation in the same period would decrease MWG by increasing the assimilate supply, negating the effect of T+20. The coefficients of R−20 were positive in Koshihikari and negative in Ishikawa 65, and it is not clear why the coefficients of R−20 were not consistent between cultivars. It is possible that R−20 is differently associated with the amount of assimilate supply in the two cultivars, because assimilate supply per spikelet is determined by sink and source factors, and R−20 affects both. The amount of assimilate supply per spikelet can be affected by a higher R−20 through increasing the number of spikelets per area (Wada, Citation1969), or by increasing the amount of NSC in culms and leaf sheaths at heading (Nagata et al., Citation2001). Although the coefficients of the independent variable R−20 differed between cultivars, the association between MWG and CIG0 is reasonable.
The proportion of OTG tended to be higher than that of MWG in Ishikawa 65 but did not exceed 5% in Koshihikari. In Koshihikari, OTG was not associated with CIG0 or climate factors. In the multiple regressions with OTG as the dependent variable, CIG0 had a positive coefficient, suggesting that increased N uptake increases OTG in Ishikawa 65. This result agrees with the negative correlation between OTG and the number of spikelets per area (Nakamura, Citation2018). The negative coefficient of T+20 seems to be inconsistent with the results reported by Morita et al. (Citation2016) that high temperature during grain filling increases OTG. However, high OTG is observed irrespective of air temperature during grain filling (Nakamura, personal communication), implying that high temperature during grain filling is not the major factor that increases OTG in this cultivar. Although clarification of how climate factors affect OTG in this cultivar is required to validate the result of the multiple regression, the positive association between CIG0 and OTG is reasonable.
GPC was significantly correlated with CIG0, but the climate factors were not significant. This result is consistent with the report by Tsukaguchi et al. (Citation2016) that GPC is affected by plant N status but not by T+20.
Whereas we used CIgreen in this study, NDVI, a VI calculated from red and NIR reflectance data (Rouse et al., Citation1974), is often used for growth diagnosis. However, NDVI is prone to saturation at higher canopy coverage and canopy N content (Erdle et al., Citation2011; Li et al., Citation2014; Nguy-Robertson et al., Citation2012; Tsukaguchi et al., Citation2022; Vina et al., Citation2011), making it less informative at higher N content, which suggests that NDVI is not an appropriate VI to estimate grain quality. Similar analyses using NDVI revealed that the adjusted R2 values of the multiple regressions with NDVI at heading as the independent variable were generally lower than those with CIG0 as the independent variable (data not shown), suggesting that CIgreen is an appropriate VI to estimate grain quality.
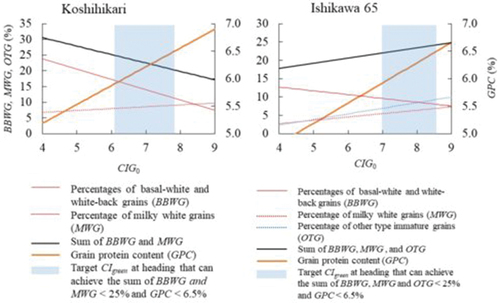
Using the regression coefficients of CIG0, T+20, and R−20 obtained from half of the dataset, chosen at random, for each cropping, the models () estimated BBWG, MWG, OTG and GPC fairly well in the rest of the dataset (). For the estimation of BBWG in Ishikawa 65, we used the multiple regression with T+20, despite its lower adjusted R2 value than that with R−20, because we could not reason the negative association between BBWG and R−20. For the estimation of OTG in Ishikawa 65, we used the multiple regression with T+20 owing to its higher R2 than that with R−20. Based on the results shown in , the responses of BBWG, MWG, OTG (Ishikawa 65), and GPC to CIG0 were calculated using T+20 and R−20 averaged over the last 10 years with heading dates of August 3 for Koshihikari and August 12 for Ishikawa 65, the mean heading dates in this study (). In Koshihikari, the sum of BBWG and MWG decreases as CIG0 increases and is < 25% when CIG0 is higher than 6.1. On the other hand, GPC < 6.5% is achieved by CIG0 <7.8. A high grain protein content decreases the eating quality of cooked rice by increasing hardness and decreasing stickiness (Hamaker & Griffin, Citation1990; Martin & Fitzgerald, Citation2002), and GPC is negatively associated with palatability when GPC > 6.5% (Kondo, Citation2007). Therefore, targeting a CIG0 of 6.1–7.8 would allow achievement of BBWG + MWG < 25% and grain protein content < 6.5%. This target value is reasonable from the viewpoint of grain yield, because grain yield is positively associated with CIG0 when CIG0 is < 6.1 () and lodging occurred in some plots when CIG0 exceeded approximately 8.0 (data not shown). In Ishikawa 65, the sum of BBWG, MWG, and OTG accounted for most of the imperfect grains, except cracked grains. The sum of imperfect grains increases when CIG0 increases and is less than 25% when CIG0 is less than 9.1. GPC is less than 6.5% at CIG0 <8.5. Therefore, CIG0 should be less than 8.5 to achieve both the sum of imperfect grains < 25% and GPC < 6.5%. Considering the positive association between CIG0 and grain yield when CIG0 <7.0 (), CIG0 of 7.0–8.5 can satisfy both grain quality and yield in Ishikawa 65.
Figure 6. Relations between observed and estimated BBWG, MWG, OTG, and GPC in Koshihikari and Ishikawa 65.
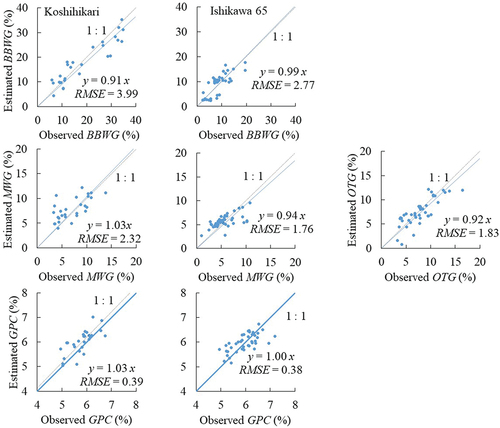
Figure 7. Estimated BBWG, MWG, OTG, and GPC at the mean T +20 and R-20 in the last 10 years.
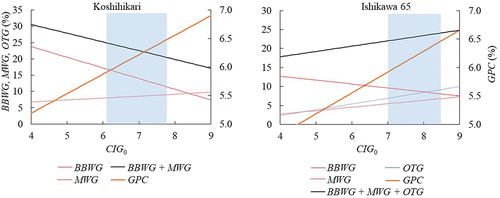
Figure 8. Relations between CIG0 and grain yield in Koshihikari and Ishikawa 65.
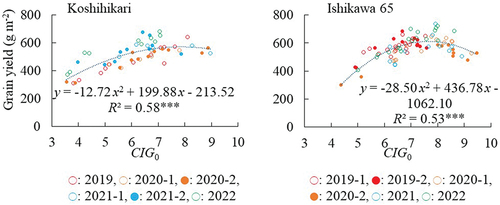
These estimates of target CIG0 () could be used to determine the amount of top dressing required to optimize grain yield and quality. The difference between the crop CIgreen value at the time of top dressing and the target CIG0 should be equal to the increment of the CIgreen value by N uptake in this period. Based on the relation between CIgreen and plant N content (Tsukaguchi et al., Citation2022), we can determine the amount of N uptake necessary for the target CIG0, which is accounted for partly by N top dressing and partly by soil mineralized N. The amount of N mineralized from soil can be estimated based on the soil type and climate factors (Chubachi et al., Citation2001). If climate forecast data are available, the target CIG0 can be calculated at the time of top dressing. Past and forecast data for gross solar radiation are available until one day before and nine days ahead and for air temperature until one day before and 26 days ahead, from the Agro-Meteorological Grid Square Data (NARO). In rice cultivation, top dressing is usually applied twice at approximately 20 and 10 days before heading. The forecast period is insufficient at present, but these data are still useful, especially for the second top dressing at 10 days before heading, covering most of the period of T+20 and R−20, necessary for calculation of the target CIG0. A target CIG0 that maximizes grain quality given that year’s climate conditions could be estimated.
In conclusion, BBWG, MWG, OTG, and GPC could be evaluated by measuring CIG0 combined with T +20 or R−20 in Koshihikari and Ishikawa 65. CIG0 was negatively associated with BBWG and positively associated with MWG, OTG, and GPC. Based on our analyses, BBWG, MWG, OTG, and GPC can be estimated by using CIG0, T +20, and R−20, and a target CIG0 that will produce acceptable BBWG, MWG, OTG, and GPC levels can be determined.
Disclosure statement
No potential conflict of interest was reported by the author(s).
Additional information
Funding
References
- Chubachi, T., Kanno, C., & Sato, K. (2001). Examined factor and prediction of soil nitrogen mineralization after middle rice growth. Japanese Journal of Soil Science and Plant Nutrition, 72, 721–728.
- Erdle, K., Mistele, B., & Schmidhalter, U. (2011). Comparison of active and passive spectral sensors in discriminating biomass parameters and nitrogen status in wheat cultivars. Field Crops Research, 124(1), 74–84. https://doi.org/10.1016/j.fcr.2011.06.007
- Gitelson, A. A., Gritz, Y., & Merzlyak, M. N. (2003). Relationships between leaf chlorophyll content and spectral reflectance and algorithms for non-destructive chlorophyll assessment in higher plant leaves. Journal of Plant Physiology, 160(3), 271–282. https://doi.org/10.1078/0176-1617-00887
- Greenwood, D. J., Lemaire, G., Gosse, G., Cruz, P., Draycott, A., & Neeteson, J. J. (1990). Decline in percentage N of C3 and C4 crops with increasing plant mass. Annals of Botany, 66(4), 425–436. https://doi.org/10.1093/oxfordjournals.aob.a088044
- Hamaker, B. R. & Griffin, V. K. (1990). Changing the viscoelastic properties of cooked rice through protein disruption. Cereal Chemistry, 67, 261–264.
- Inoue, Y., Guerif, M., Baret, F., Skidmore, A., Gitelson, A., Schlerf, M., Darvishzadeh, R., & Olioso, A. (2016). Simple and robust methods for remote sensing of canopy chlorophyll content: A comparative analysis of hyperspectral data for different types of vegetation. Plant, Cell and Environment, 39(12), 2609–2623. https://doi.org/10.1111/pce.12815
- Jones, D. B. (1941). Factors for converting percentages of nitrogen in foods and feeds into percentages of proteins. In Circular no. 183. United States Department of Agriculture.
- Kobata, T., Uemuki, N., Inamura, T., & Kagata, H. (2004). Shortage of assimilate supply to grain increases the proportion of milky white kernels under high temperatures. Japanese Journal of Crop Science, 73, 315–322. https://doi.org/10.1626/jcs.73.315
- Kondo, M. (2007). Nitrogen application techniques for the improvement of appearance quality and palatability in rice. In T. Tsukaguchi (Ed.), Agriculture and Horticulture (Vol. 82, pp. 31–34). Tokyo, Japan: Yokendo.
- Li, F., Miao, Y., Feng, G., Yuan, F., Yue, S., Gao, X., Liu, Y., Liu, B., Ustin, S. L., & Chen, X. (2014). Improving estimation of summer maize nitrogen status with red edge-based spectral vegetation indices. Field Crops Research, 157, 111–123. https://doi.org/10.1016/j.fcr.2013.12.018
- Martin, M., & Fitzgerald, M. A. (2002). Proteins in rice grains influence cooking properties! Journal of Cereal Science, 36(3), 285–294. https://doi.org/10.1006/jcrs.2001.0465
- Morita, S., Wada, H., & Matsue, Y. (2016). Countermeasures for heat damage in rice grain quality under climate change. Plant Production Science, 19(1), 1–11. https://doi.org/10.1080/1343943X.2015.1128114
- Nagata, K., Takita, T., Yoshinaga, S., Terashima, K., & Fukuda, A. (2004). Effect of air temperature during the early grain-filling stage on grain fissuring in rice. Japanese Journal of Crop Science, 73, 336–342. https://doi.org/10.1626/jcs.73.336
- Nagata, K., Yoshinaga, S., Takanashi, J., & Terao, T. (2001). Effects of dry matter production, translocation of nonstructural carbohydrates and nitrogen application on grain filling in rice cultivar Takanari, a cultivar bearing a large number of spikelets. Plant Production Science, 4(3), 173–183. https://doi.org/10.1626/pps.4.173
- Nagato, K., & Ebata, M. (1965). Effects of high temperature during ripening period on the development and quality of rice kernels. Japanese Journal of Crop Science, 34, 59–66. https://doi.org/10.1626/jcs.34.59
- Nakamura, K. (2018). Breeding and characters of new rice cultivar “Hyakumangoku ( (Ishikawa 65)). The Hokuriku Crop Science, 53, 59–61.
- Nguy-Robertson, A. L., Gitelson, A. A., Peng, Y., Vina, A., Arkebauer, T., & Rundquist, D. (2012). Green leaf area index estimation in maize and soybean: Combining vegetation indices to achieve maximal sensitivity. Agronomy Journal, 104(5), 1336–1347. https://doi.org/10.2134/agronj2012.0065
- Patel, M. K., Ryu, D., Western, A. W., Suter, H., & Young, I. M. (2021). Which multispectral indices robustly measure canopy nitrogen across seasons: Lessons from an irrigated pasture crops. Computers and Electronics in Agriculture, 182, 106000. https://doi.org/10.1016/j.compag.2021.106000
- Rouse, J. W., Haas, R. H., Well, J. A., & Deering, D. W. (1974). Monitoring vegetation systems in the Great Plains with ERTS. Proceedings, Third Earth Resources Technology Satellite-1 Symposium (pp. 3010–3017). Greenbelt, NASA SP-351.
- Sato, T., Azuma, S., Kanai, M., & Shiraya, T. (2015). Method of topdressing at panicle formation stage for reducing white-based kernel of rice cultivar “Koshihikari” in high temperature during ripening period. The Hokuriku Crop Science, 50, 39–41.
- Takahashi, W., Ojima, T., Nomura, M., & Nabeshima, M. (2002). Development of a model for predicting cracked rice kernel of rice cultivar “Koshihikari”. The Hokuriku Crop Science, 37, 48–51.
- Takata, S., Sakata, M., Kameshima, M., Yamamoto, Y., & Miyazaki, A. (2010). Varietal difference in the relation between the occurrence of white immature kernels caused by a high temperature during the ripening period and the amount of basal nitrogen application in rice. Japanese Journal of Crop Science, 79, 150–157. https://doi.org/10.1626/jcs.79.150
- Takita, T. (1999). Evaluation method for varietal differences of crack formation in rice grains. Tohoku Agriculture Research, 52, 15–16.
- Tanaka, K., Miyazaki, M., Uchikawa, O., & Araki, M. (2010). Effects of the nitrogen nutrient condition and nitrogen application on kernel quality. Japanese Journal of Crop Science, 79, 450–459. https://doi.org/10.1626/jcs.79.450
- Tashiro, T., & Wardlaw, I. F. (1991). The effect of high temperature on kernel dimensions and the type of occurrence of damage in rice (Oryza sativa L.). Australian Journal of Agricultural Science, 42(3), 485–496. https://doi.org/10.1071/AR9910485
- Tsukaguchi, T., & Iida, Y. (2008). Effects of assimilate supply and high temperature during grain-filling period on the occurrence of various types of chalky kernels in rice plants (Oryza sativa L.). Plant Production Science, 11(2), 203–210. https://doi.org/10.1626/pps.11.203
- Tsukaguchi, T., Kobayashi, H., Fujihara, Y., & Chono, S. (2022). Estimation of spikelet number per area by UAV-acquired vegetation index in rice (Oryza sativa L.). Plant Production Science, 25(1), 20–29. https://doi.org/10.1080/1343943X.2021.1943467
- Tsukaguchi, T., Taniguchi, Y., & Ito, R. (2016). The effects of nitrogen uptake before and after heading on grain protein content and the occurrence of basal- and back-white grains in rice (Oryza sativa L.). Plant Production Science, 19(4), 508–517. https://doi.org/10.1080/1343943X.2016.1223527
- Tsukimori, H. (2008). Effects of meteorological factors and transplanting time on milky white rice kernels for “Koshihikari. In Bulletin of the Shimane Agricultural Technology Center (pp. 47–56). Shimane Agricultural Technology Center.
- Usui, Y., Sakai, H., Tokida, T., Nakamura, H., Nakagawa, H., & Hasegawa, T. (2014). Rice grain yield and quality responses to free-air CO2 enrichment combined with soil and water warming. Global Change Biology, 22(3), 1256–1270. https://doi.org/10.1111/gcb.13128
- Vina, A., Gitelson, A. A., Nguy-Robertson, A. L., & Peng, Y. (2011). Comparison of different vegetative indices for the remote assessment of green leaf area index of crops. Remote Sensing of Environment, 115(12), 3468–3478. https://doi.org/10.1016/j.rse.2011.08.010
- Wada, G. (1969). The effect of nitrogenous nutrition on the yield determining process of rice plant. In Bulletin of the national institute of agricultural sciences A16 (pp. 27–167). National Institute of Agricultural Sciences Japan.
- Wakamatsu, K., Sasaki, O., Uezono, I., & Tanaka, A. (2007). Effects of high air temperature during the ripening period on the grain quality of rice in warm regions of Japan. Japanese Journal of Crop Science, 76, 71–78. https://doi.org/10.1626/jcs.76.71
- Wakamatsu, K., Sasaki, O., Uezono, I., & Tanaka, A. (2008). Effects of the amount of nitrogen application on occurrence of white-back kernels during ripening of rice under high temperature condition. Japanese Journal of Crop Science, 77, 424–433. https://doi.org/10.1626/jcs.77.424
- Yoshida, H., Takehisa, K., Kojima, T., Ohono, H., & Nakagawa, H. (2016). Modeling the effect of N application on growth, yield and plant properties associated with the occurrence of chalky grains of rice. Plant Production Science, 19(1), 34–42. https://doi.org/10.1080/1343943X.2015.1128111