
 ?Mathematical formulae have been encoded as MathML and are displayed in this HTML version using MathJax in order to improve their display. Uncheck the box to turn MathJax off. This feature requires Javascript. Click on a formula to zoom.
ABSTRACT
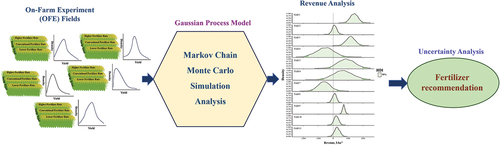
The surge in global agricultural input prices, particularly for nitrogen (N) fertilizers, has presented challenges for farmers facing stagnant crop prices and rising production costs. This study explored a system designed to sustain or enhance farmers’ income while reducing production costs, with a specific focus on implementing practices that involve cultivating crops with lower rates of fertilizer than conventional rates, particularly in smaller land settings, through on-farm experimentation (OFE). OFE was conducted over three years across 11 fields in Gifu, Japan, utilizing a strip trial design to investigate the effect of fertilizer input rates on rice yield. To collect yield data, unmanned aerial vehicle (UAV)-mounted multispectral cameras were deployed. A Gaussian process model was used to address the impact of fertilizer input rates on yield while accounting for spatial yield variation. The study further assessed the number of field trials achieving positive profits at certain probability levels by integrating outcomes from multiple OFEs. The results highlighted little rice yield response to fertilizer input in most of the fields, while several fields showed significant positive yield responses. Notably, the use of lower fertilizer input rates in certain fields proved to be more profitable whereas higher fertilizer input rates were less profitable in most fields. The results further emphasized the economic viability of lower rates, especially when fertilizer prices are high, thus contributing valuable insights for sustainable and profitable rice production in Japanese cultivation.
GRAPHICAL ABSTRACT
Introduction
The escalation of global agricultural input prices, particularly for nitrogen (N) fertilizers (Hellegers, Citation2022; Rabbi et al., Citation2023; Randive et al., Citation2021), has posed challenges for farmers facing stagnant crop prices and rising production costs (Weerahewa & Dayananda, Citation2023). Furthermore, there is an urgent need to reduce N fertilizer inputs to mitigate ground water pollution (Bijay-Singh & Craswell, Citation2021; Gao et al., Citation2012; Ju et al., Citation2006; Zhang et al., Citation1996) and global warming (Koneswaran & Nierenberg, Citation2008; Tian et al., Citation2012). Overcoming these challenges involves promoting practices where farmers can grow crops with less N fertilizer while adopting sustainable cropping practices. This approach seeks to balance economic viability with ecological sustainability, offering benefits for farmers, the broader agricultural sector, and the natural environment.
To facilitate an understanding of crop physiological responses to crop management practices, i.e. N fertilizer input rates, agricultural experimentation is traditionally conducted at research centers through randomized and replicated small-plot designs (Piepho et al., Citation2011). However, the inadequacy of small-plot experiments arises from the limitations in capturing the spatial variability inherent in large and diverse fields (Sadeghi et al., Citation2006; Stefanova et al., Citation2023). Small-plot experiments might oversimplify this complexity, leading to results that are not representative of broader field conditions (Eltaib et al., Citation2002). To obtain a more accurate and nuanced understanding of optimal treatments across fields, the on-farm experimentation (OFE) method has the potential to expedite the implementation of this system (Evans et al., Citation2020; P. B. Hegedus, Maxwell, et al., Citation2023; Roques et al., Citation2022).
OFE is a collaborative and innovative approach in agricultural research involving a dynamic partnership between farmers and professional researchers (Lacoste et al., Citation2022; Marchant et al., Citation2019). In OFEs, farmers actively participate in agronomic trials conducted directly in their fields, providing valuable real-world insights. OFE is designed to produce scientifically significant outcomes while remaining highly relevant to local farming contexts, acknowledging the diversity of environmental and management conditions (Lacoste et al., Citation2022). Collaboration ensures that experiments reflect the details of actual farming practices, enhancing the translational impact of research findings. This active engagement promotes a two-way exchange, with farmers contributing practical knowledge and researchers providing technical expertise. The holistic and inclusive nature of OFE promotes a deeper understanding of the local context and empowers farmers in decision-making, resulting in more effective and contextually relevant agricultural strategies.
Strip trials are among the popular experimental designs for OFE. This design involves dividing a field into strips, with each strip representing a distinct experimental unit where a specific treatment is applied based on the working width of agricultural machinery (e.g. seeder, spreader, and sprayer). Field-length strips serve as experimental units, and multiple replications of treatment and control strips are arranged within a field. Although designs such as chequerboard and eggboxes can achieve a finer treatment scale by using variable rate technology (Cook et al., Citation2018), strip trials remain more cost effective (Li et al., Citation2023) and easily implementable for farmers. Furthermore, the emergence and widespread adoption of yield monitoring systems and remote sensing technologies allows for data collection within strips and reveals spatial variability caused by diverse factors (Istiak Md et al., Citation2023; Javaid et al., Citation2023; Marchant et al., Citation2019; Roques et al., Citation2022). However, the traditional statistical method such as ordinary least squares regression or analysis of variance is not suitable for data analysis in OFEs because it may not effectively address the inherent spatial variability in specific response variables (Tanaka, Citation2021). Several studies have explored appropriate data analytics methods for strip trials via various statistical models, considering the large spatial dataset of yields per strip rather than a single value for the entire strip (Alesso et al., Citation2021; Marchant et al., Citation2019; Tanaka, Citation2021). Those studies demonstrated that a linear mixed model accounting for spatial variations in residuals could be used to effectively assess treatment effects, even in straightforward OFE designs, namely, strip trials.
OFEs are commonly found on expansive field sizes (Marchant et al., Citation2019) and typically exceed 10 hectares. The advantage of larger land sizes lies in their capacity to facilitate a more comprehensive evaluation of diverse agricultural factors, providing a broader and more representative understanding of real-world conditions. With the global adoption of precision agricultural technologies, even small-scale or smallholder farmers can reap the benefits of OFEs (Tanaka, Citation2021). However, designing experiments for small-scale fields requires consideration of unique challenges distinct from those encountered in large-scale fields (Tanaka, Citation2021). The principal hurdle faced by small-scale farming systems is the potential constraint on the economic benefits of OFEs due to their limited scale, which hinders their expansion via farmer networks. Economies of scale become pivotal; larger field sizes yield more substantial benefits from a single OFE. However, smaller field sizes may compromise the generalizability of OFE outcomes for the broader farming community. Aggregating and sharing data from multiple OFEs can overcome this challenge and foster a collaborative and integrated approach. This collaborative effort ensures that recommendations for small-scale farmers are robust, inclusive, and reflective of the diverse conditions encountered in small-scale farming systems, thus mitigating the challenges posed by individual OFE scales. The incorporation of multiple experimental sites offers a significant advantage in research and analysis, particularly in the context of OFEs, thus facilitating a heightened level of precision in cross-site analyses and allowing for the discernment of intricate patterns, trends, and relationships across diverse environments and conditions (Roques et al., Citation2022).
One approach for analyzing the data from multiple experimental sites is the Bayesian approach. The Bayesian approach is preferred in various fields, including medical (Achim et al., Citation2001; Natanegara et al., Citation2014; Spiegelhalter et al., Citation1999; Sutton & Abrams, Citation2001), ecological (Carl & Kühn, Citation2007; Choy et al., Citation2009; Ellison, Citation1996; Hooten & Hobbs, Citation2015), and even agricultural (Donald et al., Citation2011; P. B. Hegedus, B. D. Maxwell, et al., Citation2023; Shirley et al., Citation2020; Wang et al., Citation2012) fields, due to its robust and flexible analysis system that effectively addresses uncertainty. Unlike traditional frequentist statistics, Bayesian analysis incorporates prior knowledge, expressed as a probability distribution, and updates it with observed data to obtain a posterior distribution. In the context of spatial modeling, Bayesian analysis is particularly advantageous because it can also account for spatial autocorrelation (Besag & Higdon, Citation1999; Dendoncker et al., Citation2007; Donald et al., Citation2011; Morrison et al., Citation2012; Paccioretti et al., Citation2021; Wang et al., Citation2012). Bayesian data analysis framework can explicitly use the posterior probability for quantifying uncertainty in inference (Gelman et al., Citation2013). Therefore, Bayesian analysis enables decision-makers to quantify the treatment effect and its uncertainty for each OFE. Furthermore, pooling statistical information from multiple OFEs was proposed to facilitate an understanding of the overall treatment effect and its uncertainty synthesized from multiple OFEs (Kyveryga et al., Citation2018). While Bayesian analysis and pooling approach has great potential, to the best of our knowledge, few studies have focused on analyzing multiple OFEs via Bayesian analysis while accounting for spatial autocorrelation of each OFE.
The primary objective of this study was to develop a Bayesian data analytical framework to integrate outcomes from multiple strip trials to provide recommendations for fertilizer input management in small-scale paddy rice production systems in Japan. To date, such systems have not been adequately studied, nor have their unique circumstances been addressed. The specific goals of this study were to 1) assess the effect of fertilizer application rates on rice yield for each field trial via a Gaussian process model, 2) comprehensively explore the effect of fertilizer application rates and the associated probability of profit gain from multiple field trials, and 3) provide insights into fertilization strategies that can balance crop productivity and financial sustainability. Therefore, on-farm strip trials with different fertilizer input rates were conducted over three years across 11 paddy fields in Gifu, Japan. The yield data were collected using a UAV-based yield prediction model. The question tested in this study was whether reducing or increasing the fertilizer input rate from the conventional rate would result in enhancing farmers’ economic returns.
Materials and methods
Experimental design of OFE
OFEs were conducted over a three-year period across 11 farmers’ fields in Gifu Prefecture, Japan, from 2020 to 2022 (as detailed in ). The investigation focused on the high-yielding rice cultivar Hoshijirushi. This cultivar is tolerant of lodging even at a high N input rate; therefore, farmers tend to apply overfertilization to achieve higher yields. However, several farmers had the question of whether it was still profitable to increase or decrease fertilization under local circumstances in which the fertilizer price continued to rise while the rice price rarely changed. This socioeconomic situation facilitated the recruitment of farmers who were willing to become involved in OFEs with the aid of a local crop advisory service. The experiment was carried out across various locations involving multiple farmers who utilized different transplanting machineries and types of fertilizer. Furthermore, each farmer has different experiences and strategies for crop management. These factors presented challenges in maintaining consistent experimental conditions across the fields. Through the discussion with the farmers and local crop advisory service, three different basal fertilizer input rates were primarily applied to each farmers’ field by increasing or decreasing the basal fertilizer input from farmers’ conventional rates. The fertilizer input rates ranged from 300 to 500 kg ha−1, resulting in an increase or reduction of 10–14% compared with conventional rates. However, some farmers also experimented with much lower or higher application rates to test various hypotheses. For instance, in fields 5 to 7 and 8 to 11, other fertilizer treatments of 0 kg ha−1 and 250 kg ha−1, respectively, were additionally applied, as depicted in . For this study, variations in the experimental treatments of fertilizer rates were only considered within the range of 10–14% of the conventional rates due to the limitation of complete dataset; therefore, rates either lower (<10%) or higher (>14%) than the specified ranges were excluded from further analysis. To evaluate the effect of different basal fertilizer input rates on rice yield, a series of strip trials were systematically performed (). The trials involved the arrangement of long strips alongside a field. Each of these strips received different rates of fertilizer application, a difference determined based on the working width of the rice transplanter, which was approximately 1.9 m. Both types of slow-releasing basal fertilizer (NPK = 25:6:6 or 24:9:9) were used by the local farmers. There was no top-dressing application for any of the fields, and weed and pest management were performed according to the local crop advisory recommendation.
Figure 1. Yield and treatment maps of strip trials. Within the depicted strips, the numerical values denote the corresponding fertilizer application rates. The gradient colors represent the distribution of the predicted yield.
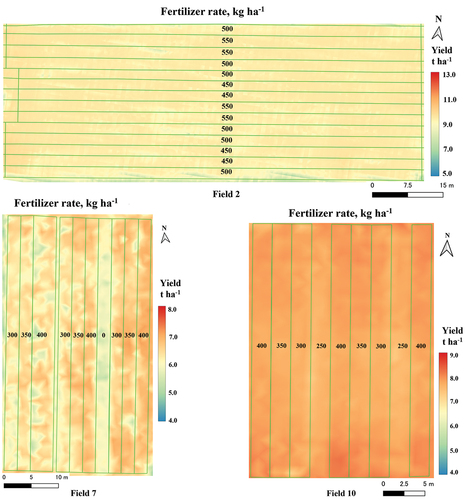
Table 1. Basic information of the OFE fields.
Data collection
A yield map was generated according to the method of Mia et al. (Citation2023). Briefly, a total of 894 samples was surveyed across 22 farmers’ fields in Japan over six years (2017–2022) to develop globally applicable rice yield prediction models. The fields of interest were surveyed using a commercial multispectral camera (Rededge Altum, MicaSense, Seattle, USA) mounted on an unmanned aerial vehicle (UAV) (Inspire 2, DJI, Shenzhen, China) during the rice flowering stage. This aerial imagery, coupled with ground truth yield data and weekly summations of weather data, facilitated the development of a yield prediction model, specifically a convolutional neural network (CNN) model. Mia et al. (Citation2023) compared rice yield prediction accuracy among 18 CNN models, and the best model (Model 8 of their work) was utilized in the present study. The model consists of AlexNet feature extractor with weekly weather data, and one additional hidden layer with 64 neurons between concatenation and output layers. The performance of the developed CNN model exhibited a R2 value of 0.68 and a root mean square error of 0.859 t ha−1 (Mia et al., Citation2023). The prediction model operated on a 1.0 m × 1.0 m unit, aligning with the input data resolution. To visualize the predicted yield values, maps were generated using QGIS 3.22.4, wherein gradient-colored points represented centroids of 1.0 m × 1.0 m prediction units (). Subsequently, the predicted yield data were stratified based on the polygons of the treatment strips.
Gaussian process model
To assess the effect of fertilizer application rates on rice yield, a Gaussian process model was established for each field trial as follows:
where y is a vector of length n of the response variable rice yield, n is the number of observations, β(X) is an n vector of the mean function of input design matrix X, and is an n × n covariance matrix. The mean function β consists of β0, β1, and β2 for the mean yield value at the farmers’ conventional fertilizer application rate, treatment effect of low fertilizer application rate, and treatment effect of high fertilizer application rate, respectively. The design matrix X consists of 3 × n elements. The first column of design matrix X consists of ones, representing the intercept term (β0) being multiplied with each observation. When low fertilizer application rate is applied, the second column has a value of 1 for multiplication with β1 while the third column has a value of 0 for multiplication with β2. Conversely, when high fertilizer application rate is applied, the second column has a value of 0 while the third column has a value of 1. Therefore, β1 and β2 represent the change in yield value relative to β0. Note that the spatial unit of each observation is defined as a 1.0 m × 1.0 m area to correspond with the UAV-based yield prediction unit. Accordingly, the number of observations (n) for each field varied from 263 to 2,832 according to the factors such as field size and misalignment between the UAV-based yield spatial resolution and working width of transplanters ().
The covariance function is also known as the kernel of the Gaussian process model. The exponential kernel function k between ith and jth observations is defined as follows:
where the hyperparameter α is the marginal standard deviation, the hyperparameter ρ is the length scale, di,j is the Euclidean distance between ith and jth observations, the hyperparameter σ is the scale of the noise, and is the Kronecker delta function representing a value of 1 when
otherwise the value is 0. The Euclidean distance di,j is calculated as follows:
where xi and xj are the Universal Transverse Mercator (UTM) x coordinates of ith and jth observations, and yi and yj are the UTM y coordinates of ith and jth observations. These coordinates are based on the centroids of 1.0 m × 1.0 m yield prediction units.
The nugget-to-sill ratio in geostatistics quantifies the relative influence of short-distance variability or measurement errors (nugget) to the overall spatial variability (sill), offering insights into the strength and scale of spatial dependence in the dataset. The hyperparameters α2 and σ2 are equivalent to the partial sill and nugget; therefore, the nugget-to-sill ratio is evaluated. A nugget-to-sill ratio close to 0 indicates that the spatial variation is mostly structured, with a small unstructured (nugget) component. This finding suggested strong spatial autocorrelation. A nugget-to-sill ratio close to 1 indicates that the dataset has a substantial unstructured or nugget component, implying weak spatial autocorrelation. In this case, spatial observations are not strongly dependent on distance. According to the posterior distribution of the nugget-to-sill ratio, the results of the Gaussian process model can be discussed.
The Gaussian process model was established using the ‘Rstan’ package (McElreath, Citation2018; Stan Development Team, Citation2022) in R version 4.3.1 (R Core Team, Citation2024). Each model underwent four Markov chain Monte Carlo chains comprising 1,000 iterations each, with a 50% burn-in. This process yielded a total of 2,000 iterations for posterior inference. The convergence and stability of these chains were inspected through trace plots and R-hat values during the monitoring process (Gelman & Rubin, Citation1992; Gelman et al., Citation2013; McElreath, Citation2018). The trace plots visually displayed the evolution of each chain over iterations, while R-hat values served as a diagnostic measure to assess the convergence of multiple chains. A value of 1 for R-hat implies favorable convergence, while larger values indicate potential convergence issues, ill-defined prior distributions and predictors or the potential need for additional iterations. The significance of the estimated parameters was assessed at the 95% highest density interval (HDI). The source code for implementing the gaussian process regressions can be found in GitHub (https://github.com/takashi2024/StanGP_RiceStripTrial).
Net revenue calculation
Leveraging the prescribed Equations (1) and (2), the field-specific net revenue ($ ha−1) associated with the yield response to varying fertilizer rates was calculated as follows:
where and
represent the revenues derived from employing a lower and higher fertilizer rate, respectively, than the farmer’s rate at Bayesian iteration number i (i.e. 1, 2, … , 2000);
is the price of fully ripened brown rice grain;
is the price of basal fertilizer; C = 0.80 is the factor converting from rough rice to fully ripened brown rice grain; Fc is the conventional fertilizer rate used by the farmer;
is the lower fertilizer rate; and
is the higher fertilizer rate (
). These parameters signify the alterations in yield resulting from the adjustment in fertilizer application rates at each specific field. The prices of grain and fertilizer exhibited annual variation. Specifically, the grain prices
in 2020, 2021, 2022, and 2023 were $1.343 kg−1, $0.997 kg−1, $1.076 kg−1, and $1.187 kg–1, respectively. The prices of fertilizer
in 2020, 2021, 2022, and 2023 were $1.200 kg−1, $1.172 kg−1, $1.362 kg–1, and $1.970 kg−1, respectively.
Comprehensive probability map for fertilization recommendation
To holistically understand the impact of fertilizer rates on profitability while accounting for variability in fertilizer and crop prices, the number of field trials that achieved positive net revenue associated with different fertilizer rates at certain probability levels was evaluated. The analytical results should be more credible if the majority of field trials consistently demonstrate positive net revenue at higher probability levels. In the previous section, constant fertilizer and grain prices were assumed for each year. However, it’s crucial to note that this assumption is strongly post-hoc and not practical. By leveraging the variability in grain and fertilizer prices, comprehensive probability for revenue gain was generated. First, the probability of gaining positive net revenues was obtained for each field by dividing the total number of positive net revenues by the total number of Bayesian iterations for each of the lower and higher fertilizer input rates based on EquationEquations (4)(4)
(4) and (Equation5
(5)
(5) ). Given the uncertainty in fertilizer and grain prices, an expansive range of grain prices
ranging from $0.883 kg−1 to $1.450 kg−1 and fertilizer prices
ranging from $1.00 kg−1 to $2.35 kg−1 was employed for EquationEquations (4)
(4)
(4) and (Equation5
(5)
(5) ). Second, the number of field trials exceeding the probability levels of 95, 90, and 80% were counted for each combination of fertilizer and grain price. The 95% probability is scientifically sound; however, it could be extremely strict for practical production level (Kyveryga et al., Citation2018). Thus, the probability levels were also considered at the 90 and 80% level. By doing so, 11 on-farm experimental outcomes could be comprehensively analyzed. The results were visualized using heatmaps, which provide overview of the likelihood of achieving positive net revenue under various market conditions, aiding in decision-making processes regarding fertilization in real agricultural practices. Note that this study simply presented the number of field trials achieving the positive net revenue rather than evaluating the frequency by dividing the total number of trials. This way could be more straightforward to convey the analytical concept for farmers without losing the context that ‘probability’ derived from each field trial.
Results
Spatial variation
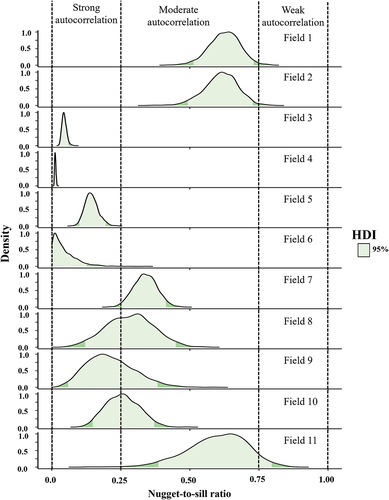
shows a visual representation of the density diagram for the nugget-to-sill ratio. The majority of posterior values in most fields ranged less than 0.50. Notably, in four of eleven fields (Field 3, 4, 5, and 6), all posterior values were consistently less than 0.25, indicating robust and widespread residual spatial variation among these fields. In the context of Gaussian process modeling, which is utilized for capturing and predicting spatial dependencies, this observation underscores the suitability of applying the Gaussian process model to these fields.
Figure 2. Density plots of the nugget-to-sill ratio for 11 fields. Light green areas represent the 95% HDI. Vertical dashed lines represent the criteria classifying strong (0.00–0.25), medium (0.25–0.75), and weak autocorrelation (0.75–1.00).
Effects of fertilizer application rates on rice yield
The effects of different fertilizer rates on yield are summarized in . The results showed that all the models properly converged, as evidenced by R-hat values less than 1.10. In Fields 2 and 10, higher fertilizer application rates significantly increased yield. Moreover, in Fields 2, 4, 7, 8, 10, and 11, lower fertilizer application rates significantly decreased yield. In contrast, Fields 1 and 3 showed a significant increase in yields even with lower fertilizer application. On the other hand, Fields 5, 6, and 9 did not exhibit any significant changes in yield when the fertilizer rate was increased or decreased from the conventional application rate.
Table 2. Summary of posterior distributions of the estimated treatment impacts of fertilizer application rates on yield. The bold numbers in the columns corresponding to lower and higher fertilizer application rates indicate that the 95% HDI does not include 0.
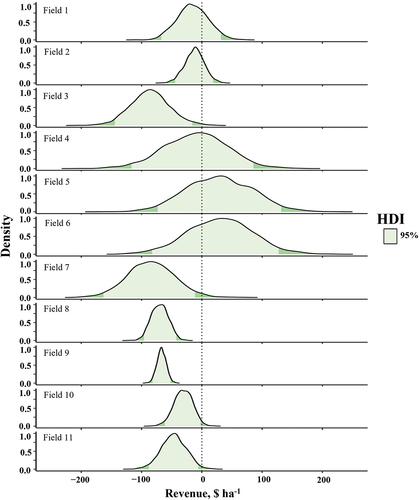
Revenue analysis
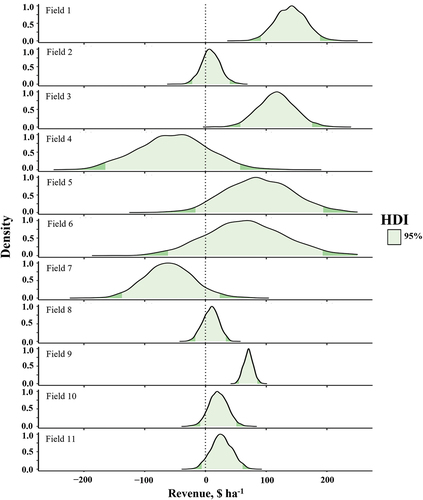
shows the estimated net revenues when utilizing lower fertilizer application rates than when using the conventional rate. The visual representation elucidates several key observations. Notably, Fields 1, 3, and 9 consistently exhibited positive net revenue, emphasizing the robust and reliable financial success associated with the implementation of a lower fertilizer application rate in these fields. Even in the absence of a significant yield change in Field 9 due to alterations in fertilizer application, the recurrence of positive revenue underscores the resilience and effectiveness of this approach. Fields 2, 5, 6, 8, 10, and 11 had mostly positive net revenue, suggesting the viability of employing a lower fertilizer rate in these fields for consistently favorable financial outcomes. However, Fields 4 and 7 presented a less uniform pattern, with positive revenue observed in only a few cases, suggesting a less consistent financial benefit from the lower fertilizer rates in these specific fields.
Figure 3. Density plots of net revenue as determined by using a lower fertilizer rate than the farmer rate. Light green areas represent the 95% HDI. Year-specific grain and fertilizer prices were used for the revenue evaluation.
The estimated net revenue when utilizing higher fertilizer application rates than when using conventional rates is shown in . Fields 8 and 9 consistently had negative net revenue, indicating a definite risk of losing profits by increasing fertilizer application rates. In fields 3, 7, 10, and 11, the probability of positive net revenue was less than 5%, further emphasizing the minimal success of employing a higher fertilizer rate for obtaining profits. Fields 1, 2, 4, and 5 showed that net revenue could be either positive or negative at the 50% HDI level. Only Field 6 had positive net revenue at more than 50%.
Figure 4. Density plots of net revenue obtained by using a higher fertilizer rate than the farmer rate. Light green areas represent the 95% HDI. Year-specific grain and fertilizer prices were used for the revenue evaluation.
Probability analysis for fertilizer recommendation
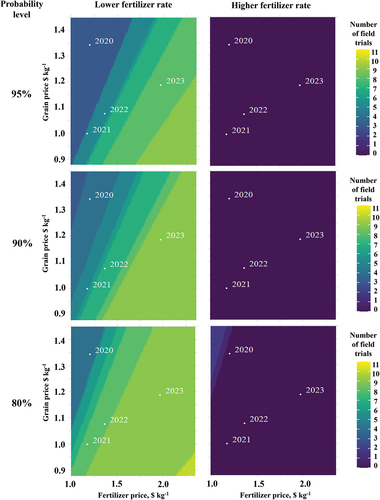
offers a comprehensive view of how different fertilizer application strategies can influence the probability of generating positive net revenue across field trials. In the case of the lower fertilizer rate at the 95% probability, three of eleven field trials showed positive net revenues when fertilizer price was the lowest and grain price was the highest setting. This number remained consistent even when grain price rose to the maximum value. Meanwhile, ten of eleven fields were profitable when fertilizer price was the highest and grain price was the lowest setting. Eight of eleven field trials remained profitable even when both prices were the highest settings. None of the field trials were profitable at the 95% probability with the higher fertilizer rates. At the 90 and 80% probabilities, the overall patterns of heatmaps closely resembled those at the 95% probability level. However, as the probabilities decreased, the number of field trials achieving positive net revenue increased. In 2023, fertilizer price was high and grain price was moderate, which resulted in eight of eleven field trials achieving positive net revenue at the 95% probability and nine of eleven field trials at the 90 and 80% probabilities. Intriguingly, when faced with a lower fertilizer price and higher grain price, lower fertilizer rates should be recommended consistently. Conversely, illustrates the challenges associated with higher fertilizer use. Throughout all years examined, no field trials demonstrated positive net revenue at the 95, 90, and 80% probabilities, underscoring the financial risks associated with higher fertilizer usage.
Figure 5. Heatmaps showing the number of field trials that achieved positive revenue gain at the 95, 90, and 80% probability levels in the case of lower fertilizer rates and higher fertilizer rates in comparison to the conventional rate used by farmers. The x-axis represents fertilizer price, while the y-axis represents grain price. Gradient color corresponds to the number of field trials. The points represent the actual fertilizer and grain prices for the corresponding years.
Discussion
The occurrence of spatial variation in crop yield posed a challenge in analyzing OFE data. A Gaussian process model was successfully applied to assess the treatment effect of fertilizer application rates for each trial while accounting for the inherent spatial yield variations in the experimental data, as evidenced by the fact that all the models converged (). A high spatial dependency of rice yield was also confirmed across the fields (), which suggested the necessity of a spatial modeling approach for analyzing strip trials even in rice production systems. This finding is consistent with previous OFE studies on other cereal crops (Marchant et al., Citation2019; Tanaka, Citation2021). Accordingly, the effect of fertilizer application rate on rice yield could be assessed more precisely via this type of approach than via traditional statistical analysis (i.e. ordinary least squares regression or analysis of variance) for each field trial. On the other hand, high uncertainty in yield variations derived from unquantified factors (e.g. soil, weather, farmer skill, and historical crop management practices) hinders holistic data analysis from multiple field trials, as each field might have different yield-limiting factors. To overcome this issue, the present study evaluated the number of fields achieving positive profits at the different probability levels (95, 90, and 80%) using the posterior distributions derived from each Gaussian process model (). This approach can provide valuable information on fertilization strategies while accounting for model uncertainty and variability in fertilizer and grain prices.
In this study, the results obtained with the Bayesian model enable the evaluation of net revenue associated with different fertilizer use scenarios in rice fields. These findings underscore the financial advantages of reduced fertilizer compared to conventional rates in the majority of cases (), emphasizing the economic benefits of optimizing fertilizer usage. However, two of the eleven cases (Fields 4 and 7) showed a substantial reduction in yield with decreasing fertilizer usage (), which led to unfavorable financial outcomes (). In contrast, in Fields 1 and 3, a lower fertilizer rate led to an increase in yield (), resulting in consistently positive net revenue across all iterations (). However, rarely does lower fertilizer rates contribute to increasing rice yield if there is no negative lodging impact (Basak et al., Citation1962) or potential risk of increased disease incidence (Long et al., Citation2000) due to high N application above the recommended rate; such situations did not occur in the trials. This discrepancy raises concerns about potential artifacts in collected yield data or limitations of the Gaussian process model in accommodating spatial yield variability, which in turn could impact the precision of the analytical outcomes (Besag & Higdon, Citation1999; Katzfuss et al., Citation2020; Marchant et al., Citation2019). The study generated yield maps by employing UAV-based yield prediction model, with a moderate level of prediction accuracy (R2 = 0.68). However, this way might create biases in yield data that was used for the Gaussian process models as the response variable. Provided that errors in the estimated yield are assumed to be independently and identically distributed, the noise term in EquationEquation (2)(2)
(2) could account for these errors. Thus, the analytical outcomes should depend on the degree of yield estimation errors and the distribution of random noise. This potential problem highlighted the necessity for continued research to enhance the accuracy and reliability of yield predictions. Furthermore, Tanaka (Citation2021) assessed the precision of various statistical approaches in detecting treatment effects from OFEs. They added assumed treatment effects and random noise to real yield map data. Similarly, further simulation research should investigate how spatial yield prediction errors could impact the precision of treatment estimates and subsequent revenue analysis.
Overall, the majority of field trials achieved positive revenue gain especially when fertilizer price was high and grain price was low (). The result indicated the potential financial advantage of applying lower fertilizer rates rather than higher fertilizer rates. Notably, a higher fertilizer rate was not a promising strategy for obtaining positive revenue within the expected range of fertilizer and grain prices. However, the increase and reduction rates of applied fertilizer for the treatments ranged from 10 to 14%. The results indicated that a greater reduction in fertilizer application might be economically feasible, as eight of eleven field trials showed positive revenue gain at the 95% probability when fertilizer price was high and grain price was low. Japan’s strategy for sustainable food systems (Strategy Midori) includes a 30% reduction in chemical fertilizer application rates by 2050 (Ministry of Agriculture Forestry and Fisheries, Citation2021). Due to the continuously increasing cost of chemical fertilizer (Hellegers, Citation2022; Rabbi et al., Citation2023; Randive et al., Citation2021), efficiently reducing fertilizer application rates has become a critical topic for farmers. Future OFEs can inform an agronomic understanding of whether farmers can further reduce the total amount of fertilizer applied. However, farmers are typically unwilling to reduce fertilizer application rates due to unpredictable yield losses and are skeptical about the applicability of analytical outcomes from strip trials for the rest of their fields (Tanaka et al., Citation2023). Accordingly, some farmers may be unwilling to conduct OFEs if the fertilizer application reduction rate is more than 30% for the experimental treatments. In response to these challenges, the Bayesian data analytical framework for multiple OFEs coupled with the revenue analysis proposed in this study may help encourage farmers’ active engagement in OFEs and therefore provide recommendations on the optimal fertilizer input rate without reducing farmers’ financial profits. More importantly, as the probabilities decreased, there was an increase in the number of field trials achieving positive net revenue (). Note that OFEs are not only for scientists but also for farmers to create and share the local knowledge (Lacoste et al., Citation2022). The detection of significant difference among treatments are not always be the primary focus for OFEs. Therefore, exploring how farmers respond to the outcomes based on different probability levels could be an intriguing research topic.
Conclusion
The OFE was conducted over three years in Gifu, Japan, and provided valuable insights into optimizing chemical fertilizer usage and its impact on profitability. The experimental design involved varying fertilizer rates through a strip trial approach and introduced spatial variation, challenging traditional statistical methods. The utilization of a Gaussian process model proved effective in addressing spatial intricacies and assessing treatment effects across diverse field conditions. The study highlighted the financial advantages of lower fertilizer rates than farmers’ conventional rates in the majority of cases. Furthermore, the study successfully assessed the frequency of revenue gain by counting the number of field trials achieving positive net revenue at the certain probability levels while accounting for the uncertainties in fertilizer and grain prices. The results also suggested that adopting reduced fertilizer rates could be a profitable strategy, offering valuable insights for farmers facing rising fertilizer costs. Moreover, adopting an increased fertilizer rate might not be profitable and could be equated to high-risk gambling. The graphical representations underscore the potential financial benefits of lower fertilizer rates in the face of market uncertainties. This study contributes to the ongoing debate on optimizing fertilizer usage in rice production and emphasizes the importance of integrating multiple OFE outcomes to inform decision-making in farming practices. Nevertheless, these findings relied on the UAV-based yield estimations, whose errors could potentially influence the analytical results. Further research should focus on exploring the impact of yield estimation errors on statistical robustness.
Acknowledgments
This study was supported by the JST FOREST Programme, Grant Number JPMJFR221C. We would like to thank the Japan Agricultural Cooperative Nishimino and the farmers for their permission for the field surveys.
Disclosure statement
No potential conflict of interest was reported by the author(s).
References
- Achim, A., Bezerianos, A., & Tsakalides, P. (2001). Novel Bayesian multiscale method for speckle removal in medical ultrasound images. IEEE Transactions on Medical Imaging, 20(8), 772–783. https://doi.org/10.1109/42.938245
- Alesso, C. A., Cipriotti, P. A., Bollero, G. A., & Martin, N. F. (2021). Design of on-farm precision experiments to estimate site-specific crop responses. Agronomy Journal, 113(2), 1366–1380. https://doi.org/10.1002/agj2.20572
- Basak, M. N., Sen, S. K., & Bhattacharjee, P. K. (1962). Effects of high nitrogen fertilization and lodging on rice yield 1. Agronomy Journal, 54(6), 477–480. https://doi.org/10.2134/agronj1962.00021962005400060003x
- Besag, J., & Higdon, D. (1999). Bayesian analysis of agricultural field experiments. Journal of the Royal Statistical Society Series B: Statistical Methodology, 61(4), 691–746. https://doi.org/10.1111/1467-9868.00201
- Bijay-Singh, & Craswell, E. (2021). Fertilizers and nitrate pollution of surface and ground water: An increasingly pervasive global problem. SN Applied Sciences, 3(4), 518. https://doi.org/10.1007/s42452-021-04521-8
- Carl, G., & Kühn, I. (2007). Analyzing spatial autocorrelation in species distributions using Gaussian and logit models. Ecological Modelling, 207(2–4), 159–170. https://doi.org/10.1016/j.ecolmodel.2007.04.024
- Choy, S. L., O’Leary, R., & Mengersen, K. (2009). Elicitation by design in ecology: Using expert opinion to inform priors for Bayesian statistical models. Ecology, 90(1), 265–277. https://doi.org/10.1890/07-1886.1
- Cook, S., Lacoste, M., Evans, F., Ridout, M., Gibberd, M., & Oberthür, T. (2018). An on-farm experimental philosophy for farmer-centric digital innovation. Proceedings of 14th International Conference on Precision Agriculture, International Society of Precision Agriculture, Montreal, CA.
- Dendoncker, N., Rounsevell, M., & Bogaert, P. (2007). Spatial analysis and modelling of land use distributions in Belgium. Computers, Environment and Urban Systems, 31(2), 188–205. https://doi.org/10.1016/j.compenvurbsys.2006.06.004
- Donald, M., Alston, C. L., Young, R. R., & Mengersen, K. L. (2011). A Bayesian analysis of an agricultural field trial with three spatial dimensions. Computational Statistics & Data Analysis, 55(12), 3320–3332. https://doi.org/10.1016/j.csda.2011.06.022
- Ellison, A. M. (1996). An introduction to bayesian inference for ecological research and environmental decision‐making. Ecological Applications, 6(4), 1036–1046. https://doi.org/10.2307/2269588
- Eltaib, S. M., Soom, M., Amin, M., Hanafi, M. M., Rashid, A., Shariff, M., & Wayayok, A. (2002). Spatial variability of N, P, and K in rice field in Sawah Sempadan, Malaysia. Songklanakarin Journal of Science and Technology, 24(2), 322–328.
- Evans, F. H., Salas, A. R., Rakshit, S., Scanlan, C. A., & Cook, S. E. (2020). Assessment of the use of geographically weighted regression for analysis of large on-farm experiments and implications for practical application. Agronomy, 10(11), 1720. https://doi.org/10.3390/agronomy10111720
- Gao, Y., Yu, G., Luo, C., Zhou, P., & Cannon, A. J. (2012). Groundwater nitrogen pollution and assessment of its health risks: A case study of a typical village in rural-urban continuum, China. Public Library of Science ONE, 7(4), e33982. https://doi.org/10.1371/journal.pone.0033982
- Gelman, A., Carlin, J. B., Stern, H. S., Dunson, D. B., Vehtari, A., & Rubin, D. B. (2013). Bayesian data analysis. Chapman and Hall/CRC. https://doi.org/10.1201/b16018
- Gelman, A., & Rubin, D. B. (1992). Inference from iterative simulation using multiple sequences. Statistical Science, 7(4), 457–472. https://doi.org/10.1214/ss/1177011136
- Hegedus, P. B., Maxwell, B., Sheppard, J., Loewen, S., Duff, H., Morales-Luna, G., & Peerlinck, A. (2023). Towards a low-cost comprehensive process for on-farm precision experimentation and analysis. Agriculture, 13(3), 524. https://doi.org/10.3390/agriculture13030524
- Hegedus, P. B., Maxwell, B. D., & Mieno, T. (2023). Assessing performance of empirical models for forecasting crop responses to variable fertilizer rates using on-farm precision experimentation. Precision Agriculture, 24(2), 677–704. https://doi.org/10.1007/s11119-022-09968-2
- Hellegers, P. (2022). Food security vulnerability due to trade dependencies on Russia and Ukraine. Food Security, 14(6), 1503–1510. https://doi.org/10.1007/s12571-022-01306-8
- Hooten, M. B., & Hobbs, N. T. (2015). A guide to Bayesian model selection for ecologists. Ecological Monographs, 85(1), 3–28. https://doi.org/10.1890/14-0661.1
- Istiak Md, A., Syeed, M. M. M., Hossain, M. S., Uddin, M. F., Hasan, M., Khan, R. H., & Azad, N. S. (2023). Adoption of unmanned aerial vehicle (UAV) imagery in agricultural management: A systematic literature review. Ecological Informatics, 78, 102305. https://doi.org/10.1016/j.ecoinf.2023.102305
- Javaid, M., Haleem, A., Khan, I. H., & Suman, R. (2023). Understanding the potential applications of artificial intelligence in agriculture sector. Advanced Agrochemical, 2(1), 15–30. https://doi.org/10.1016/j.aac.2022.10.001
- Ju, X. T., Kou, C. L., Zhang, F. S., & Christie, P. (2006). Nitrogen balance and groundwater nitrate contamination: Comparison among three intensive cropping systems on the North China plain. Environmental Pollution, 143(1), 117–125. https://doi.org/10.1016/j.envpol.2005.11.005
- Katzfuss, M., Guinness, J., Gong, W., & Zilber, D. (2020). Vecchia approximations of gaussian-process predictions. Journal of Agricultural, Biological and Environmental Statistics, 25(3), 383–414. https://doi.org/10.1007/s13253-020-00401-7
- Koneswaran, G., & Nierenberg, D. (2008). Global farm animal production and global warming: Impacting and mitigating climate change. Environmental Health Perspectives, 116(5), 578–582. https://doi.org/10.1289/ehp.11034
- Kyveryga, P. M., Mueller, T. A., & Mueller, D. S. (2018). On-farm replicated strip trials. In D. K. Shannon, D. E. Clay, & N. R. Kitchen (Eds.), Precision agriculture basics (pp. 189–208). American Society of Agronomy, Crop Science Society of America, and Soil Science Society of America. https://doi.org/10.2134/precisionagbasics.2016.0096
- Lacoste, M., Cook, S., McNee, M., Gale, D., Ingram, J., Bellon-Maurel, V., MacMillan, T., Sylvester-Bradley, R., Kindred, D., Bramley, R., Tremblay, N., Longchamps, L., Thompson, L., Ruiz, J., García, F. O., Maxwell, B., Griffin, T., Oberthür, T., Huyghe, C., & Hall, A. (2022). On-farm experimentation to transform global agriculture. Nature Food, 3(1), 11–18. https://doi.org/10.1038/s43016-021-00424-4
- Li, X., Mieno, T., & Bullock, D. S. (2023). The economic performances of different trial designs in on-farm precision experimentation: A monte carlo evaluation. Precision Agriculture, 24(6), 2500–2521. https://doi.org/10.1007/s11119-023-10050-8
- Long, D. H., Lee, F. N., & TeBeest, D. O. (2000). Effect of nitrogen fertilization on disease progress of rice blast on susceptible and resistant cultivars. Plant Disease, 84(4), 403–409. https://doi.org/10.1094/PDIS.2000.84.4.403
- Marchant, B., Rudolph, S., Roques, S., Kindred, D., Gillingham, V., Welham, S., Coleman, C., & Sylvester-Bradley, R. (2019). Establishing the precision and robustness of farmers’ crop experiments. Field Crops Research, 230, 31–45. https://doi.org/10.1016/j.fcr.2018.10.006
- McElreath, R. (2018). Statistical rethinking. Chapman and Hall/CRC. https://doi.org/10.1201/9781315372495
- Mia, M. S., Tanabe, R., Habibi, L. N., Hashimoto, N., Homma, K., Maki, M., Matsui, T., & Tanaka, T. S. T. (2023). Multimodal deep learning for rice yield prediction using UAV-Based multispectral imagery and weather data. Remote Sensing, 15(10), 2511. https://doi.org/10.3390/rs15102511
- Ministry of Agriculture, Forestry and Fisheries. (2021, May 12). Strategy for sustainable food systems, MIDORI. https://www.maff.go.jp/e/policies/env/env_policy/meadri.html
- Morrison, K. T., Nelson, T. A., Nathoo, F. S., & Ostry, A. S. (2012). Application of Bayesian spatial smoothing models to assess agricultural self-sufficiency. International Journal of Geographical Information Science, 26(7), 1213–1229. https://doi.org/10.1080/13658816.2011.633491
- Natanegara, F., Neuenschwander, B., Seaman, J. W., Kinnersley, N., Heilmann, C. R., Ohlssen, D., & Rochester, G. (2014). The current state of Bayesian methods in medical product development: Survey results and recommendations from the DIA Bayesian scientific working group. Pharmaceutical Statistics, 13(1), 3–12. https://doi.org/10.1002/pst.1595
- Paccioretti, P., Bruno, C., Gianinni Kurina, F., Córdoba, M., Bullock, D. S., & Balzarini, M. (2021). Statistical models of yield in on‐farm precision experimentation. Agronomy Journal, 113(6), 4916–4929. https://doi.org/10.1002/agj2.20833
- Piepho, H. P., Richter, C., Spilke, J., Hartung, K., Kunick, A., & Thöle, H. (2011). Statistical aspects of on-farm experimentation. Crop and Pasture Science, 62(9), 721–735. https://doi.org/10.1071/CP11175
- R Core Team. (2024, May 20). R: A language and environment for statistical computing. R Foundation for Statistical Computing. https://www.R-project.org/
- Rabbi, M. F., Ben Hassen, T., El Bilali, H., Raheem, D., & Raposo, A. (2023). Food security challenges in Europe in the context of the prolonged Russian–Ukrainian conflict. Sustainability, 15(6), 4745. https://doi.org/10.3390/su15064745
- Randive, K., Raut, T., & Jawadand, S. (2021). An overview of the global fertilizer trends and India’s position in 2020. Mineral Economics, 34(3), 371–384. https://doi.org/10.1007/s13563-020-00246-z
- Roques, S. E., Kindred, D. R., Berry, P., & Helliwell, J. (2022). Successful approaches for on-farm experimentation. Field Crops Research, 287, 108651. https://doi.org/10.1016/j.fcr.2022.108651
- Sadeghi, A., Graff, C. D., Starr, J., McCarty, G., Codling, E., & Sefton, K. (2006). Spatial variability of soil phosphorus levels before and after poultry litter application. Soil Science, 171(11), 850–857. https://doi.org/10.1097/01.ss.0000228060.46205.7b
- Shirley, R., Pope, E., Bartlett, M., Oliver, S., Quadrianto, N., Hurley, P., Duivenvoorden, S., Rooney, P., Barrett, A. B., Kent, C., & Bacon, J. (2020). An empirical, Bayesian approach to modelling crop yield: Maize in USA. Environmental Research Communications, 2(2), 025002. https://doi.org/10.1088/2515-7620/ab67f0
- Spiegelhalter, D. J., Myles, J. P., Jones, D. R., & Abrams, K. R. (1999). Methods in health service research: An introduction to bayesian methods in health technology assessment. BMJ: British Medical Journal, 319(7208), 508–512. https://doi.org/10.1136/bmj.319.7208.508
- Stan Development Team. (2022). Stan user’s guide (version 2.33). https://mc-stan.org/docs/2_33/stan-users-guide-2_33.pdf
- Stefanova, K. T., Brown, J., Grose, A., Cao, Z., Chen, K., Gibberd, M., & Rakshit, S. (2023). Statistical analysis of comparative experiments based on large strip on-farm trials. Field Crops Research, 297, 108945. https://doi.org/10.1016/j.fcr.2023.108945
- Sutton, A. J., & Abrams, K. R. (2001). Bayesian methods in meta-analysis and evidence synthesis. Statistical Methods in Medical Research, 10(4), 277–303. https://doi.org/10.1177/096228020101000404
- Tanaka, T. S. T. (2021). Assessment of design and analysis frameworks for on-farm experimentation through a simulation study of wheat yield in Japan. Precision Agriculture, 22(5), 1601–1616. https://doi.org/10.1007/s11119-021-09802-1
- Tanaka, T. S. T., Mieno, T., Tanabe, R., Matsui, T., & Bullock, D. S. (2023). Toward an effective approach for on-farm experimentation: Lessons learned from a case study of fertilizer application optimization in Japan. Precision Agriculture, 24(5), 2044–2060. https://doi.org/10.1007/s11119-023-10029-5
- Tian, H., Lu, C., Melillo, J., Ren, W., Huang, Y., Xu, X., Liu, M., Zhang, C., Chen, G., Pan, S., Liu, J., & Reilly, J. (2012). Food benefit and climate warming potential of nitrogen fertilizer uses in China. Environmental Research Letters, 7(4), 044020. https://doi.org/10.1088/1748-9326/7/4/044020
- Wang, J. C., Holan, S. H., Nandram, B., Barboza, W., Toto, C., & Anderson, E. (2012). A Bayesian approach to estimating agricultural yield based on multiple repeated surveys. Journal of Agricultural, Biological, and Environmental Statistics, 17(1), 84–106. https://doi.org/10.1007/s13253-011-0067-5
- Weerahewa, J., & Dayananda, D. (2023). Land use changes and economic effects of alternative fertilizer policies: A simulation analysis with a bio-economic model for a tank village of Sri Lanka. Agricultural Systems, 205, 103563. https://doi.org/10.1016/j.agsy.2022.103563
- Zhang, W. L., Tian, Z. X., Zhang, N., & Li, X. Q. (1996). Nitrate pollution of groundwater in northern China. Agriculture, Ecosystems & Environment, 59(3), 223–231. https://doi.org/10.1016/0167-8809(96)01052-3