
ABSTRACT
Objective
To estimate palatal bone thickness (PBT), inferior surface palatal bone density (ISPBD), superior surface palatal bone density (SSPBD), palatal soft tissue thickness (PST) and hard palate extension (HPE) in relation to maxillary dentition for maxillary skeletal expander (MSE) mini-implant insertion sites.
Materials and Methods
Computerized Tomography images of 40 subjects were selected (19 male, 21 female) with mean age 23.12 years. The measurements of PBT, ISPBD, SSPBD, and PST were made at 14 different levels from incisive foramen at 2 mm intervals using BlueSky software. HPE was measured in relation to the distal surface of the maxillary second molar tooth. Statistical analysis was used to compare and correlate variables.
Result
PBT, ISPBD, and SSPBD decrease from anterior to posterior region with a significant difference in PBT between anterior and posterior areas in the total sample and in males. PST showed no significant differences between anterior and posterior areas and between males and females. HPE located 4 mm anterior to the line tangent to the distal surface of the second molar. There was a positive relationship between PBT and PST in anterior regions of the palate and negative one in the posterior region.
Conclusion
PBT decreased in the posterior direction. Anatomical variables measured at sites 13–19 mm from incisive foramen support MSE insertion locations. A significant positive correlation between PBT and PST was found in the anterior region of the palate while a negative correlation between these parameters was documented posteriorly. However, no correlation was reported between PBT and ISPBD except at 5 mm, and no correlation was detected between PBT and PST.
1. Introduction
Many orthodontic cases such as class I and class III malocclusion may need an expansion [Citation1,Citation2]. In growing patients, this can be achieved by multiple types of appliances such as hyrax expander, Schwarz appliance, Quad helix appliance, etc [Citation3]. Whereas in non-growing patient, this is obtained by either orthognathic surgery [Citation4] or mini-implant assist rapid palatal expansion (MARPE) [Citation5,Citation6].
Maxillary skeletal expander (MSE) is an expansion screw supported by a mini-implant which can achieve a skeletal expansion in the non-growing patients [Citation7,Citation8]. In addition, MSE can also be used in the growing patients with the advantage of less dental tipping and more skeletal expansion compared to conventional expansion methods [Citation9–11]. This technique offers advantages over surgical expansion to be less invasive, more patient acceptance, lower cost, and with improved the ratio of skeletal/dental expansion result with less effect on buccal bone and root resorption of supporting teeth [Citation10,Citation12].
Bi-cortical engagement of hard palate with mini-implant is a crucial essential procedure for successful skeletal expansion [Citation11,Citation13,Citation14]. Generally, the success of mini-implant depends on several factors, among them, thickness, and density of bone [Citation15–17]. The thickness of the hard palate varies considerably [Citation18]. These variations will influence the proper selection of mini-implant length to support successful mini-implant placement [Citation11,Citation14]. As total engagement of full thickness of hard palate is requested in the skeletal expansion, over or under engagement of hard palate may affect the success of expansion or jeopardize the safe placement of MSE [Citation19]. The inferior surface of palatal bone forms the roof of the oral cavity, while the superior surface forms the floor of the nasal cavity. In addition, both inferior surface palatal bone density (ISPBD) and superior surface palatal bone density (SSPBD) are both important in supporting successful expansion, in which this expansion depends mainly on bi-cortical engagement protocol as the key factor for mini-implant stability [Citation13]. In fact, there was no study that assessed SSPBD at potential sites for MSE.
Different studies tried to assess palatal bone thickness (PBT) and palatal bone density for mini-implant insertion at different populations and among different age groups [Citation20–24]. In 2014, Nishii et al. led a study to measure PBT in subjects from four different ethnic groups, and they found differences in PBT among different ethnic groups and they stated that ethnic variation should be taken into consideration [Citation25]. Moreover, Poon et al. found that PBT was not associated with palatal morphology, crossbite in posterior teeth, or position of the tongue [Citation26].
Furthermore, post-insertion stability of palatal mini-implants relies on the quantity of palatal mucosa [Citation27,Citation28]. Extremely thick palatal mucosa could increase the risk of inflammation [Citation27,Citation28]. Therefore, for minimum inflammation and best retention, the preferable characteristics of placement site for mini-implants is thick palatal bone with decreased attached palatal soft tissue thickness (PST) [Citation27]. For instance, the increase in PST with decreased PBT requires insertion of mini-implants with long transmucosal parts and short serrated ones. This type of mini-screw will be subjected to unwanted moments, which may lead to loosening of the mini-implants and eventually failure [Citation28,Citation29]. Therefore, it is beneficial to investigate if all these parameters of bone and soft tissue are correlated with each other or not. In addition, knowledge of the actual thickness ratio (palatal mucosa thickness /palatal bone thickness) will provide the clinicians with valuable knowledge regarding the best site for MSE placement and selection of suitable mini-implant for its fixation.
On the other hand, constriction of the maxillary vault prevents proper positing of expansion screw. Moving screw posteriorly will offer more palatal width due to V shape configuration of the palate [Citation30,Citation31]. Moreover, the resistances against maxillary expansion are located at the mid-palatal suture, zygomatic buttress bone, and pterygopalatine suture [Citation32]. To maximize skeletal expansion, the force vector should pass through the centre of resistance located in the zygomatic buttress bone which is located between first and second molar [Citation33]. Therefore, the posterior position of MSE will be more favourable when adequate bone thickness is available. Yet, placing MSE in a more posterior position will be determined by hard palate extension (HPE). Determination of HPE is extremely important to enable clinicians to choose a safe and effective positions for MSE. Moreover, to best of our knowledge, there was no study that investigated the HPE in any population.
Thus, this study aimed to measure the PBT, ISPBD, SSPBD, and PST and offer a better understanding of their interrelationship in addition to determining the HPE. The null hypothesis assumed that there were no differences or correlation among, PBT, ISPBD, SSPBD, and PST between different potential sites of MSE.
2. Materials and methods
2.1 Study design
This is a retrospective cross-sectional study. The sample size was determined using power-based methodology using previous research mean and standard deviation of confidence error of 90% [Citation16]. The sample consisted of CT scans of 40 patients (19 male, 21 female) with mean age of 23.12 years (male 21.25 years, female 25 years) attended to the specialized radiology centre. The CT images were taken in the period between March 2019 and November 2019 for other medical reasons. Informed consent was obtained from all patients before CT scans were taken. Scans were collected using multi-slices CT (Brilliance 64 slice, Philips Company, Amsterdam, Holland). The CT machine was set to 120 Kv, 80 mAs, exposure time 30 s, 0.5-mm nominal slice thickness, zero gantry tilt, zero mm interval, and 1:1 pitch.
2.2 Inclusion criteria
Special selection criteria were set no missing teeth, full erupted dentition excluding third molars, no impacted teeth or incomplete erupted teeth, no metallic restorations, and no periodontal diseases. Absence of bony lesion, genetic syndrome, previous orthognathic surgery, facial deformity, or asymmetry. After applying selection criteria on 180 CT scans, forty patients (21 Males, 19 Females) were involved in this study.
2.2.1 Measurements
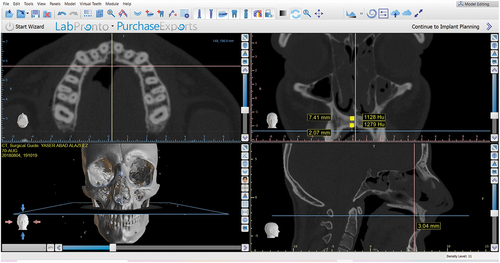
Expansion screw contains four holes prepared to receive four mini-implant, two located anteriorly and two located posteriorly. These holes should be situated at either side of the mid palatal suture. The horizontal distance between the hole and mid-line was (3 mm). Blue Sky Plan® software V4.7.5 (Blue Sky Plan® software, IL 60045, 800 Liberty Drive Libertyville, USA) was used to measure bone thickness, density, and soft tissue thickness. A surgical guide option was used to import CT images, which opened in digital imaging and communications in medicine format. View command was selected from the ribbon bar and the MPR option was chosen from the list. Four windows appeared on a screen including: Axial, Coronal, Sagittal, and 3D rendering the image []. The axial window was used to determine the midline of the palate; the sagittal window was used to measure the distance from the posterior border of incisive foramen to measurement location and the coronal window was used to measure PBT, ISPBD, SSPBD and PST. The incisive foramen and coronal section were adjusted using the sagittal section as reference. All measurements of PBT, ISPBD, SSPBD, and PST were measured in the ninety-degree coronal and para coronal sections at the intersection of the line drawn perpendicular to the reference line drawn from the posterior border of an incisive foramen in sagittal section [Citation34,Citation35]. The ruler icon from toolbar was used to measure PBT, which measured the distance from the cortical bone of the hard palate to the nasal floor at 3 mm from either side of the midline and parallel to it. The PST was measured parallel to the midline at the same location. The ISPBD and SSPBD were measured in Hounsfield units using the density tool in BlueSky software. The assessment was achieved by choosing 1 mm2 at centre of the superior and inferior surface of palatal bone []. All measurements were taken at 14 different levels starting from 3 mm from the posterior border of incisive foramen on 3 mm at the lateral side of midline with 2-mm interval distance 3, 5, 7, 9, 11, 13, 15, 17, 19, 21, 23, 25, 27 and 29 mm. These variable sets are divided equally into two groups, anterior and posterior sets.
Figure 1. BlueSky software with four windows was used to measure PBT, ISPBD, SSPBD, and PST.
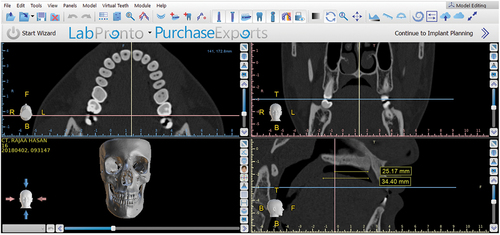
The relationship between HPE and second molar was measured using the axial window to determine the tangent to distal surfaces of the maxillary second molar. In the sagittal section, distance from the posterior border of incisive foramen to line tangent to the distal end of maxillary second molar was measured parallel to hard palate. Distance from the posterior border of incisive foramen to point of the beginning of soft palate in sagittal view was measured parallel to the hard palate which considers as HPE []. The relationship obtained from the subtraction of the first measurement from the HPE represents relationship between maxillary second molar and HPE.
Figure 2. BlueSky software with four windows was used to measure HPE.
2.3 Statistical analysis
Statistical analyses were calculated using SPSS software version 25 (SPSS Inc., Chicago, Illinois, USA). Statistical analysis included descriptive statistics, pair’s t-test, independent t-test, and Pearson’s correlation were conducted to determine differences and correlation between PBT, PST, ISPBD, and SSPBD. The level of significance was recorded to be at p < 0.05.
2.4 Reliability of study
Ten randomly selected scans were re-measured after four weeks by the same examiner (NNH). The error determined by intraclass correlation was around 0.9 for most of the measurable variables.
3. Results
Descriptive statistical analysis tables showed that PBT decreases from anterior-to-posterior region with a significant difference between anterior and posterior areas in total the sample and males []
Table 1. Mean value of palatal bone thickness, soft tissue thickness, inferior surface palatal bone density, superior surface palatalbone density of the total sample.
Table 2. Independent T-test of palatal bone thickness, Palatal soft tissue thickness, inferior surface palatal bone density, and superior surface palatal bone density between the anterior and posterior area of the palate.
Table 3. Pearson’s Correlation analysis between, palatal bone thickness and soft tissue thickness, palatal bone thickness and inferior surface palatal bone density, and finally, inferior surface palatal density and bone soft tissue thickness.
Table 4. Relation of posterior palatal limit in relation to tangent to distal surface of upper second molar.
Figure 3. Palatal bone thickness (PBT) was measured in millimetres from anterior to the posterior area. No significant differences between males and females.
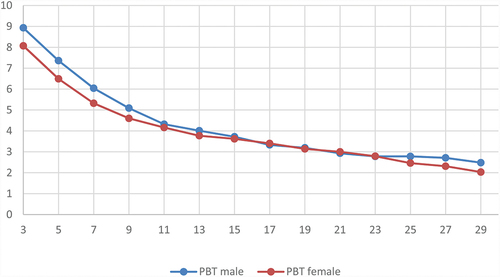
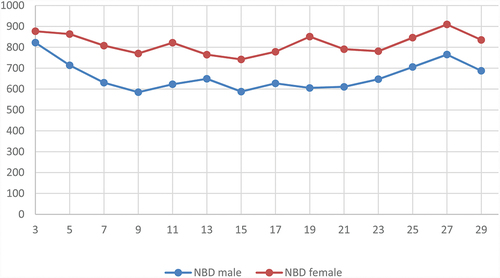
Figure 4. Palatal soft thickness (PST) was measured in millimetres from anterior to the posterior area with no significant differences between males and females.
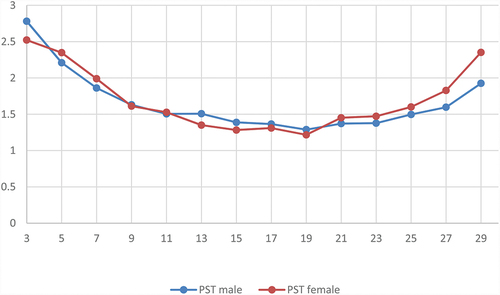
Figure 5. Inferior surface palatal bone density (ISPBD) was measured in the Hounsfield unit from anterior to the posterior area with no significant differences between males and females.
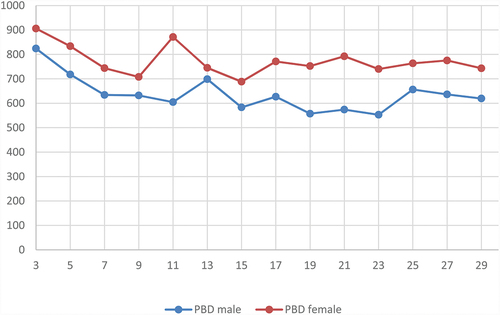
Figure 6. Superior surface palatal bone density (SSPBD) was measured in Hounsfield units from anterior to the posterior area with no significant difference between males and females.
4. Discussion
In this study, previously taken CT images were used to assess the quantity and quality of palatal bone and soft tissue. Although the Cone Beam Computerized Tomography (CBCT) produces less radiation yet, there is no standardization of grey value in CBCT. Therefore, the measurements of density in CBCT images are not accurate [Citation36,Citation37]. CT and CBCT images are considered non-invasive techniques to measure palatal mucosa. However, CBCT produces less radiation dose. Its disadvantages consist of lower contrast and higher image noise [Citation27]. Ueno et al. confirmed a high correlation between CT and validity of clinical measurements of the PST; however, the disadvantage of CT is higher radiation [Citation38]. In our study, the CT images were taken for other medical purposes. Therefore, no subjects in this study were subjected to unnecessary radiation.
Pre-knowledge of the total anatomical thickness of the palate is an important factor to successful expansion when planning treatment with MSE. Four mini-implants with bi-cortical engagement or at least two posterior mini-implants with bi-cortical engagement is demanded to achieve separation of two shelves of mid palatal suture [Citation13]. Our results showed that PBT decreased from anterior to the posterior area with significant differences between the anterior and posterior region in males and the total sample. These findings came in accordance with previous studies [Citation22,Citation23,Citation26]. Highest PBT and PST are located at 3 mm and 5 mm from incisive foramen, which is situated in area between the canine and the first premolar or near mid-width of first premolar in most cases, respectively. This result was comparable to the results of Chhatwani et al.,2019 who found that maximum PBT was located at 4 mm from incisive foramen [Citation23]. However, they did not measure the thickness of PST in this area.
Bone density is a factor related to the success rate of mini-implants [Citation15]. Previous research reported that lower bone density was associated with mini-implant loosening, dragging, or maybe failure [Citation39]. Primary stability of mini-implant is the key factor for stable and successful treatment especially when immediate loading of mini-implant is intended [Citation40]. Our result showed that ISPBD and SSPBD values located between D2 and D3 could support successful placement. This result came in accordance with that of other studies [Citation3,Citation21,Citation22]. Moreover, there was no significant difference in ISPBD and SSPBD values between anterior and posterior area although anterior area showed higher bone density values for both ISPBD and SSPBD. These findings were similar to the results of study conducted by Moon et al.,2010 which found that the values of ISPBD at areas located 2–4 mm from median palatal suture remained relatively steady from anterior to the posterior area [Citation20]. They attributed these findings to the proximity of this area to the incisive canal [Citation20]. While Hans et al reported that ISPBD decrease posteriorly, they stated that high-density palatal bone continued to 15 mm from incisive foramen, which located approximately near the second premolar region in most of the cases [Citation21]. Furthermore, we found no significant the correlation between PBT and ISPBD except at 5 mm from incisive foramen. Although, Yadav et al., studied correlation between PBT and ISPBD in sites which are different from that adopted in our study [Citation22]. They also reported no significant correlation between PBT and ISPBD in male between canine and first premolar and in female between first molar and second molar [Citation22]. This can be credited to the different factors that may affect the quantity and quality of the bone in these areas. Therefore, further researches are recommended to explore their relationships with these factors.
In this study, PST was decreased from locations 3 to 13 mm and maintained relatively same thickness at 15–19 mm from incisive foramen, and then increased gradually from 21 to 29 mm. These variations in PST would influence implant selection (length and design). The available mini-implant length is either 11 mm or 13 mm, with only a difference in transmucosal part length. Higher PST will certainly need implant with a longer transmucosal part [Citation41]. A positive correlation presents between PBT and PST at 3,5,9, and 11 mm means that although anterior sites of palate contained a thick and dense palatal bone, it is also associated with thick palatal mucosa. However, sites at 13–21 mm from incisive foramen contained an acceptable amount of palatal bone thickness and density with thin attached palatal mucosa, which made these sites favourable the of MSE. Contradictory, there was significant negative correlation between PBT and PST at 23,25,27 and 29 mm from incisive foramen; this can be explained by the anatomical nature of this area which represents the end of hard palate and beginning of soft palate. As the thickness of palatal bone decreased towards the posterior limit of the hard palate, the soft tissue thickness increased inversely. Therefore, the clinicians could anticipate a decrease in bone thickness whenever they noticed an increase in PST in the posterior area of the palate. Although this observation will not affect the total thickness of the mini-implant that supported MSE yet, it may change the length of the transmucosal part of the mini-implant to be compatible with the soft tissue thickness.
In a condition when we need a second expansion appliance to be placed when insufficient expansion or failure expansion. We have two options either to place the expansion screw more anteriorly or to put it in a more posterior position with consideration to anatomical limitation. So careful selection of mini-implant length may be required. It seems to be that anterior region anatomical variables possess factors related to the success of both mini-implant and expansion process. This is true to some extent, i.e., in many cases, transverse dimension of the palatal vault prevents close placement of the expansion screw in the anterior region to the palatal soft tissue surface. To solve this issue, either choose the smallest expansion screw range of 8 mm, which possesses lowest transverse dimensions compared to 10 and 12 mm, or put the expansion screw in a more posterior position. So, posterior placement will be more convenient for the narrow palate. On the other hand, posterior placement is also jeopardized by the extent of the soft palate. In our study, the HPE was located nearly 4 mm anterior to the tangent line pass through distal surface maxillary second molars. Therefore, anatomical parameters and palatal morphology should be considered when planning a treatment plan with MSE [Citation31].
5. Conclusion
Within the limitations of our study, sites at 13–19 mm from incisive foramen contained suitable amounts of PBT, ISPBD, SSPBD, and PST for MSE insertion. The HPE is located on an average 4 mm anterior to the distal surface of second molar. A significant positive correlation between PBT and PST was found in the anterior region of the palate, while a negative correlation between these parameters was documented posteriorly. However, no correlation was reported between PBT and ISPBD or between PBT and PST.
Author contribution
Author 1 contributed conception, design, supervision, data acquisition, and interpretation, drafted, critically revised the manuscript, writing – review and editing.
Author 2 contributed to conception, design, data acquisition, performed all statistical analyses and writing and editing.
Author 3 contributed to writing, editing, supervision, and methodology planning.
Ethical approval
Research Ethics Committee (University of Mosul, College of dentistry) with reference no. UoM.Dent/H.23/20 approved this work.
Study limitation
The slice thickness of the CT scan in this study was not the minimal thickness available. On the other hand, CT scans were utilized in this study were previously taken for other purposes therefore, no patients were subjected to unnecessary radiation.
Acknowledgments
The authors are very grateful to Dr. Nikolaos Gkantidis for his scientific revision of this article.
Disclosure statement
No potential conflict of interest was reported by the author(s).
Additional information
Funding
References
- Lione R, Brunelli V, Franchi L, et al. Mandibular response after rapid maxillary expansion in class II growing patients: a pilot randomized controlled trial. Prog Orthod. 2017;18(1):36.
- Ngan P, Moon W. Evolution of Class III treatment in orthodontics. Am J Orthod Dentofacial Orthop. 2015;148(1):22–36.
- Liu S, Xu T, Zou W. Effects of rapid maxillary expansion on the midpalatal suture: a systematic review. Eur J Orthod. 2015;37(6):651–655.
- Carvalho PHA, Moura LB, Trento GS, et al. Surgically assisted rapid maxillary expansion: a systematic review of complications. Int J Oral Maxillofac Surg. 2020;49(3):325–332.
- Khosravi M, Ugolini A, Miresmaeili A, et al. Tooth-borne versus bone-borne rapid maxillary expansion for transverse maxillary deficiency: a systematic review. Int Orthod. 2019;17(3):425–436.
- Lombardo L, Carlucci A, Maino BG, et al. Class III malocclusion and bilateral cross-bite in an adult patient treated with miniscrew-assisted rapid palatal expander and aligners. Angle Orthod. 2018;88(5):649–664.
- Abedini S, Elkenawy I, Kim E, et al. Three-dimensional soft tissue analysis of the face following micro-implant-supported maxillary skeletal expansion. Prog Orthod. 2018;19(1):46.
- Park JJ, Park YC, Lee KJ, et al. Skeletal and dentoalveolar changes after miniscrew-assisted rapid palatal expansion in young adults: a cone-beam computed tomography study. Korean J Orthod. 2017;47(2):77–86.
- Moon HW, Kim MJ, Ahn HW, et al. Molar inclination and surrounding alveolar bone change relative to the design of bone-borne maxillary expanders: a CBCT study. Angle Orthod. 2020;90(1):13–22.
- Jia H, Zhuang L, Zhang N, et al. Comparison of skeletal maxillary transverse deficiency treated by microimplant-assisted rapid palatal expansion and tooth-borne expansion during the post-pubertal growth spurt stage. Angle Orthod. 2021;91(1):36–45.
- Celenk-Koca T, Erdinc AE, Hazar S, et al. Evaluation of miniscrew-supported rapid maxillary expansion in adolescents: a prospective randomized clinical trial. Angle Orthod. 2018;88(6):702–709.
- Reyneke JP, Conley RS. Surgical/Orthodontic Correction of Transverse Maxillary Discrepancies. Oral Maxillofac Surg Clin North Am. 2020;32(1):53–69.
- Li N, Sun W, Li Q, et al. Skeletal effects of monocortical and bicortical mini-implant Anchorage on maxillary expansion using cone-beam computed tomography in young adults. Am J Orthod Dentofacial Orthop. 2020;157(5):651–661.
- Nojima LI, Nojima MDCG, Cunha ACD, et al. Mini-implant selection protocol applied to MARPE. Dental Press J Orthod. 2018;23(5):93–101.
- Park HS, Jeong SH, Kwon OW. Factors affecting the clinical success of screw implants used as orthodontic Anchorage. Am J Orthod Dentofacial Orthop. 2006;130(1):18–25.
- Al-Hafidh NN, Al-Khatib AR, Al-Hafidh NN. Assessment of the cortical bone thickness by CT-scan and its association with orthodontic implant position in a young adult Eastern Mediterranean population: a cross sectional study. Int Orthod. 2020;18(2):246–257.
- Leo M, Cerroni L, Pasquantonio G, et al. Temporary Anchorage devices (TADs) in orthodontics: review of the factors that influence the clinical success rate of the mini-implants. Clin Ter. 2016;167(3):e70–7.
- Poorsattar-Bejeh Mir A, Haghanifar S, Poorsattar-Bejeh Mir M, et al. Individual scoring and mapping of hard and soft tissues of the anterior hard palate for orthodontic miniscrew insertion. J Investig Clin Dent. 2017;8:1.
- AlSamak S, Gkantidis N, Bitsanis E, et al. Assessment of potential orthodontic mini-implant insertion sites based on anatomical hard tissue parameters: a systematic review. Int J Oral Maxillofac Implants. 2012;27(4):875–887.
- Moon SH, Park SH, Lim WH, et al. Palatal bone density in adult subjects: implications for mini-implant placement. Angle Orthod. 2010;80(1):137–144.
- Han S, Bayome M, Lee J, et al. Evaluation of palatal bone density in adults and adolescents for application of skeletal Anchorage devices. Angle Orthod. 2012;82(4):625–631.
- Yadav S, Sachs E, Vishwanath M, et al. Gender and growth variation in palatal bone thickness and density for mini-implant placement. Prog Orthod. 2018;19(1):43.
- Chhatwani S, Rose-Zierau V, Haddad B, et al. Three-dimensional quantitative assessment of palatal bone height for insertion of orthodontic implants - a retrospective CBCT study. Head Face Med. 2019;15(1):9.
- Chen W, Zhang K, Liu D. Palatal Bone Thickness of MSE Implantation area in Adult Patients with Skeletal Class III Malocclusion: a Cone-beam Computed Tomographic Study. BMC Oral Health. 2021;21(1):144.
- Nishii Y, Sameshima GT, Mah JK, et al. Hard palate thickness for temporary Anchorage devices placement: differences in sex and ethnicity. Orthodontic Waves. 2014;73(4):121–129.
- Poon YC, Chang HP, Tseng YC, et al. Palatal bone thickness and associated factors in adult miniscrew placements: a cone-beam computed tomography study. Kaohsiung J Med Sci. 2015;31(5):265–270.
- Vu T, Bayome M, Kook YA, et al. Evaluation of the palatal soft tissue thickness by cone-beam computed tomography. Korean J Orthod. 2012;42(6):291–296.
- Cha BK, Lee YH, Lee NK, et al. Soft tissue thickness for placement of an orthodontic miniscrew using an ultrasonic device. Angle Orthod. 2008;78(3):403–408.
- Lin TS, Tsai FD, Chen CH, et al. Factorial analysis of variables affecting bone stress adjacent to the orthodontic Anchorage mini-implant with finite element analysis. Am J Orthod Dentofacial Orthop. 2013;143(2):182–189.
- Lyu CX, Yang L, Chen LL, et al. [Advance and review: miniscrew-assisted rapid palatal expansion]. Zhonghua Kou Qiang Yi Xue Za Zhi. 2019;54(11):778–782.
- Angelieri F, Franchi L, Cevidanes LHS, et al. Cone beam computed tomography evaluation of midpalatal suture maturation in adults. Int J Oral Maxillofac Surg. 2017;46(12):1557–1561.
- Colak O, Paredes NA, Elkenawy I, et al. Tomographic assessment of palatal suture opening pattern and pterygopalatine suture disarticulation in the axial plane after midfacial skeletal expansion. Prog Orthod. 2020;21(1):21.
- Cantarella D, Dominguez-Mompell R, Moschik C, et al. Zygomaticomaxillary modifications in the horizontal plane induced by micro-implant-supported skeletal expander, analyzed with CBCT images. Prog Orthod. 2018;19(1):41.
- Sumer AP, Caliskan A, Uzun C, et al. The evaluation of palatal bone thickness for implant insertion with cone beam computed tomography. Int J Oral Maxillofac Surg. 2016;45(2):216–220.
- Gracco A, Lombardo L, Cozzani M, et al. Quantitative cone-beam computed tomography evaluation of palatal bone thickness for orthodontic miniscrew placement. Am J Orthod Dentofacial Orthop. 2008;134(3):361–369.
- Pauwels R, Stamatakis H, Bosmans H, et al. Quantification of metal artifacts on cone beam computed tomography images. Clin Oral Implants Res. 2013;24(SupplA100):94–99.
- Kim DG. Can dental cone beam computed tomography assess bone mineral density? J Bone Metab. 2014;21(2):117–126.
- Ueno D, Sato J, Igarashi C, et al. Accuracy of oral mucosal thickness measurements using spiral computed tomography. J Periodontol. 2011;82:829–836.
- Consolaro A, Romano FL. Reasons for mini-implants failure: choosing installation site should be valued. Dental Press J Orthod. 2014;19(2):18–24.
- Romano FL, Consolaro A. Why are mini-implants lost: the value of the implantation technique! Dental Press J Orthod. 2015;20(1):23–29.
- Prabhu J, Cousley RR. Current products and practice: bone Anchorage devices in orthodontics. J Orthod. 2006;33(4):288–307.