
 ?Mathematical formulae have been encoded as MathML and are displayed in this HTML version using MathJax in order to improve their display. Uncheck the box to turn MathJax off. This feature requires Javascript. Click on a formula to zoom.
ABSTRACT
In this study, a point focused concentrating photovoltaic (CPV/T) system is built and tested for building integration applications. The main focus of this research is to evaluate the economic viability of a CPV/T system as a replacement of electricity and natural gas for building heating. The performance of a CPV/T system for the top floor apartment heating was analyzed under very cold winter condition of South Korea. The apartment heating load was calculated via the EnergPlus® simulation software. The results show that for some months the CPV/T system can solely meet apartment heating requirements with zero auxiliary energy consumption. By utilizing a CPV/T system for apartment heating instead of using electricity and natural gas, the life cycle savings (LCS) were 2891 $ and 2370 $, respectively. It is also found that by considering 25 years of expected service life of the CPV/T system, its discounted payback period (DPP) based on electricity and natural gas were 12 and 15 years, respectively. It is concluded that the CPV/T system yield the best higher-energy saving efficiency and building heating performance.
1. Introduction
Solar energy is one of the clean and emission-free renewable energy sources, and is also available in abundance over the whole globe (Imtiaz Hussain and Lee Citation2015). Traditionally, energy from the available solar radiation has been extracted into two forms: heat and electricity. Solar thermal and photovoltaic (PV) systems are concerned with the conversion of incident solar radiation to heat and electricity, respectively (Anderson et al. Citation2009). The installation of solar thermal collectors and the conversion of sun rays into thermal energy is relatively easy, therefore, its percentage has reached nearly 75% of the world-installed capacity, most of which belong to water heating on domestic and commercial scale (Valenzuela, López-Martín, and Zarza Citation2014). On the contrary, although the PV systems have shorter history than solar thermal systems, but over the years, the PV market has been superseded the conventional solar system in terms of better technology. A fusion of solar thermal and PV devices is called Photovoltaic thermal (PV/T) system which can viably extract heat and electricity from sun rays, simultaneously (Imtiaz Hussain, Ali, and Lee Citation2016).
Figure 1. Experimental setup of the CPV/T system.
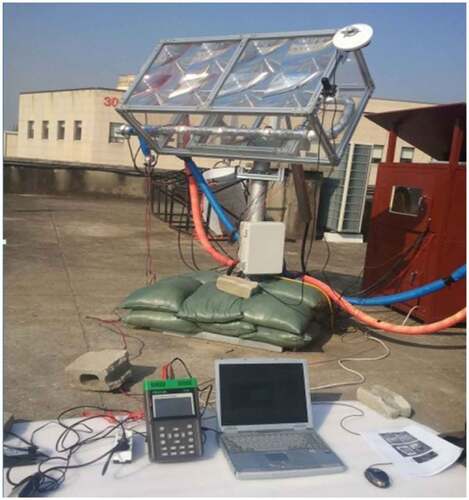
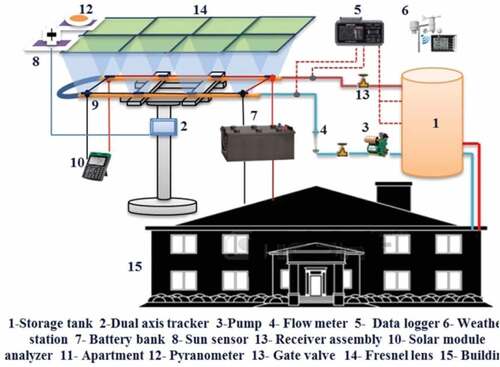
Figure 2. Schematic of the CPV/T system operation.
An extensive study of the building integrated Photovoltaic thermal (BiPV/T) systems on the optimization techniques to get maximum thermal and electrical powers has been conducted by various researchers. Chow et al. (Chow, Hand, and Strachan Citation2003) developed a BiPV/T system for subtropical hotel building, for purpose of reducing air-conditioning loads of building. The air gaps at the top and bottom of PV panel behave as a solar chimney to heat air stream. Huang et al. (Huang, Eames, and Norton Citation2004) proposed a PV façade design coupling with a phase change material at its bottom surface to improve operational efficiency. This formation can achieve moderate building integrated PV temperature even under high irradiance and ambient temperature. Fung and Yang (Fung and Yang Citation2008) developed a one dimensional transient model of a semi-transparent PV module heat gain and validated using experimental data. The model can also estimate annual total heat gain from the semi-transparent PV module for building integration applications. Furthermore, for building integration, the concentrated Photovoltaic (CPV) collectors can also offer advantages over the non-concentrated PV collectors, for having high solar to electro-thermal efficiency and better use of space. The only concern is that the economic viability of CPV systems in comparison with the flat panel PV systems (Chemisana Citation2011).
The previous studies indicate that various researchers have presented comparative analyses for PV and PV/T systems suitability for building integration. To our best knowledge, no studies evaluating the economic feasibility of a point focused CPV/T system for building integration applications have been proposed. This paper presents energy and economic potential of a point focused CPV/T system for an apartment heating requirements. For performance analysis under maximum load, top floor of the residential building is considered. The heating load of an apartment is estimated for winter from November to March, using EnergyPlus® software.
2. Analysis
2.1. Thermal and electrical performance
The efficiency of the CPV/T system is estimated under steady state conditions. According to ASHRAE standards (Ansi/Ashrae, S. Citation1977), the most appropriate time to calculate steady state efficiency of a collector is between 11 am and 2 pm, when the variations in ambient temperature and irradiance are under acceptable limit. Under steady state conditions the useful thermal energy and collector efficiency can be expressed by the following equations [10]:
where, collector inlet temperature () and storage tank fluid temperature (
) are considered to be the same.
is the outlet fluid temperature from collector.
and
are the useful thermal energy and heat loss coefficient from collector to ambient air, respectively.
is the thermal efficiency of the collector.
is the solar collector area.
and
are heat removal factor and absorptivity of the solar cells. The product of these two factors denoted the optical properties of collector. Under ideal condition, the plot of
versus
will result in a straight line.
and
are the direct solar radiation and ambient air temperature, respectively.
The total energy balance for water in the storage tank considering well mixed tank can be expressed as follows (Duffie and Beckman Citation2013):
where, is the specific heat of the circulating fluid.
and
are the mass flow rates of the fluid between collector and tank and between load (heat exchanger) and tank, respectively.
is the outlet fluid temperatures load.
is the overall heat loss coefficient from the storage tank to ambient air and
is the surface area of the storage tank.
The rate of heat exchange between circulating from tank and ambient air in the heat exchanger is given by (Duffie and Beckman Citation2013):
where, and
are the mass flow rate and specific heat of the ambient air, respectively.
and
are the inlet and outlet air temperatures in the heat exchanger. Since either the cold or hot fluid has the minimum heat capacity rate, therefore,
can also be expressed as (Duffie and Beckman Citation2013):
The heat exchanger effectiveness () for a counter flow is given by:
Correlation for number of transfer units (NTU) is expressed as:
where, is a product of the heat exchanger’s surface area and overall heat transfer coefficient. The heat capacity rate (
) is given by:
where, and
are the cold- and hot-side capacitance rates.
The electrical power () produced by solar cells is presented in Equations (11).
where, ,
, and FF are the short circuit current, open circuit voltage, and fill factor respectively. The electrical efficiency of the solar cells is presented in Equation (12), and the total power output from the CPV/T system is expressed in Equations (13) and (14), respectively.
where, is the electrical efficiency of the solar cells.
and
are the CPV/T total power output and efficiency, respectively.
2.2. Apartment heating load
Top floor apartment of a 4-storey residential building located in Chuncheon city is considered for this research. No matter what weathers, the top floor apartment always subjected to extreme weather conditions. The dimensions of the apartment are 8 m × 4 m × 3.5 m with facing south-east directions. The EnergPlus® simulation software is used to predict the apartment heating load based on local climatic conditions. For the apartment heating load calculation, a basic Heating, ventilation and air conditioning (HVAC) system also called Ideal Loads Air System is used instead of a full HVAC system. An Ideal Load Air System (ILAS) HVAC was modeled to calculate space heating loads. This component is an ideal unit that mixes air at the zone exhaust condition with a specified amount of outdoor air and then adds or removes heat and moisture in order to produce a supply air stream at the specified conditions.
3. Experimental setup
A series of experiments were performed to assess the thermal and electrical performances of a CPV/T system. The Chuncheon city is located in northern side of Korea having the coordinates 36° 18ʹ N and 126° 24ʹ E. The diurnal ambient air temperature variations range is −2.9 to 7.6 °C, in winter (December).
Unlike many of the flat panel PV/T systems that have been studied before, this system is installed only on flat surface rooftops but not pitched roofs. The given point focused CPV/T system mainly consisted of series connected CPV solar cells, copper pipes to carry thermal fluid, battery bank to store electricity, and thermal fluid storage tanks as shown in and . The characteristics of the whole CPV/T system are presented in . Eight CPV cells are pasted on black painted copper pipes with adhesive (thermal glue) at equally spaced points. To get concentrating solar flux, eight solar cells are aligned against each Fresnel lens at certain focal length. All collector components were clamped together using aluminum frames. The total area covered by eight Fresnel lenses is 0.98 m2. To remove the accumulated solar heat from CPV cell surface, a heat transfer fluid (water) was circulated through the absorber pipes using pump. A mixture of Antifreeze (ethylene glycol) and Water was used as a heat transfer fluid because often in winter in South Korea temperature drops to below zero.
Table 1. CPV/T system characteristics.
To track the sun position all day long, the whole collector assembly was mounted on two axis solar tracking system. A weather station was installed near the experimental rig for recording local climate parameters. The incident solar radiation was recorded using first class pyranometer (SMP6 by KIPP & ZONEN). The ambient temperature and heat transfer fluid temperature along the closed loop of a CPV/T system was measured using K-type thermocouples (range: −250 to 250 °C) and PT 100 (range: −50 to 400 °C) temperature sensors. A data logger (model: GL820 by GRAPHTEC) was used to record experimental data at a 10-minute interval. The errors in this study are mainly related to instrument precision and measurement inaccuracy (), as presented by Imtiaz Hussain and Lee (Imtiaz Hussain and Lee Citation2017).
Table 2. Errors and instrument measurement ranges.
4. Results and discussions
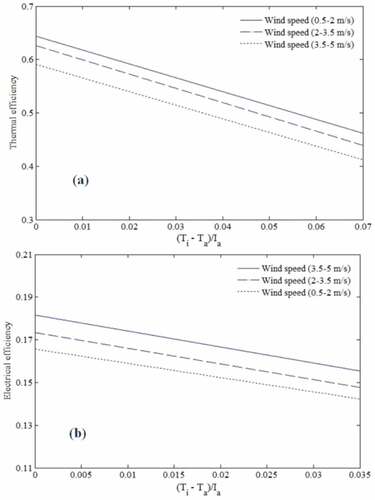
The heat transfer to the circulating fluid from absorber surface and the wind induced heat losses to ambient air are controlled by the pipe fluid flow rate and the wind speed, respectively. This is because the Reynolds number and convection heat losses varied directly in function of fluid flow rate and wind speed. and depict the variations of thermal and electrical efficiencies of CPV/T system for various fluid flow rates and wind speeds. The results shown in indicate that the thermal and electrical efficiencies increased with the increased in fluid flow rate at zero reduced temperature. It is noted that the increase in flow rate has marginally effect on the thermal efficiency, however, due to reduction in solar cells temperature at high Reynolds numbers the electrical efficiency increases notably. Under high wind speed the convection heat losses overshadow the collector performance. shows the effect of wind speed variations on the collector performance at zero reduced temperature. It can be seen that by increasing the wind speed the thermal efficiency decreases and electrical efficiency increases. In fact this effect becomes more pronounced as the wind speed increased. This can be explained by the fact that increasing fluid flow rate increases heat removal factor and heat transfer coefficient between absorber surface and circulating fluid, which leads to decrease in solar cells temperature and hence, enhance overall collector performance. Furthermore, lower thermal efficiency for the highest wind speeds was due to extra heat loss from the solar cells to the ambient air especially in a case without a glass cover.
Figure 3. Variations of thermal efficiency (a) and electrical efficiency (b) at different fluid flow rates.
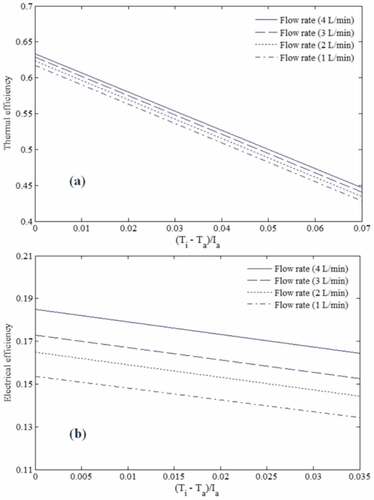
Figure 4. Variations of thermal efficiency (a) and electrical efficiency (b) at different wind speeds.
In order to assess the heating performance of a CPV/T system, a 112 m3 size apartment is considered for this study. The CPV/T system effectiveness can also be stated as a ratio of heat supplied to the heating load required by an apartment. The local climatic conditions have a significant effect on the CPV/T heating performance. Therefore, the CPV/T system is tested under very cold winter conditions of South Korea when ambient temperature drops often below zero. The amount of heat supplied by CPV/T system and the required heating load for an apartment during November to March is summarized in . To properly understand energy supply and demand across these months, the term solar fraction is used for data analysis. The solar fraction of a collector is a ratio of total solar energy (in form of thermal + electrical) delivered to the total heating requirements of an apartment in kWh. It can be seen that for the months of November and March the solar fraction values are equal to one, it means complete heating requirements for an apartment are solely fulfilled by the CPV/T system. Furthermore, it is observed that the heating costs for the coldest months of December and January have decreased significantly. The average reduction in heat costs for December and January were 34% and 30%, respectively.
Table 3. The heating load supplied by CPV/T and required apartment heating load.
The expected useful life of the CPV/T system components and main parameters for economic analysis are presented in . The unit cost of electricity and natural gas, and also statistical figures were taken from the utility companies (KEPCO Citation2017; Central city gas Citation2017) and Bank of Korea (The Bank of Korea Citation2017). The capital cost of the solar collector is estimated based on inquiries from the local suppliers. The discounted payback period (DPP) and life cycle savings (LCS) of the CPV/T system based on electricity and natural gas energy sources are given in . To consider the time value of money, a DPP method is used instead of simple payback period (Eschenbach Citation2011). The LCS estimated the heating cost savings over the expected service life of the CPV/T system when used as a replacement for auxiliary energy sources. The DPP of the CPV/T system based on electricity and natural gas are 12 and 15 years, respectively. In addition, it should be noted that LCS based on natural gas and electricity is almost 2 times the capital cost of CPV/T system, which is encouraging.
Table 4. Parameters for economic analysis.
Table 5. The LCS and DPP of the CPV/T system.
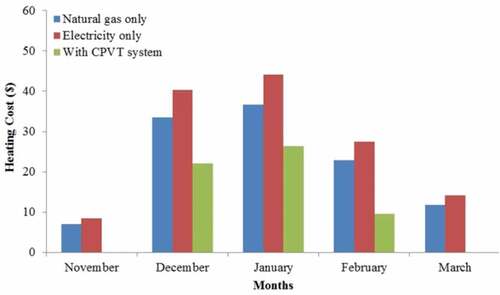
Monthly apartment heating costs based on the CPV/T system, natural gas and electricity energy sources are illustrated in . It is noticed that the heating costs using natural gas and electricity for December and January were way too high in comparison with other months. These higher heating values can be reduced to 22 $ (December) and 28 $ (January) by employing the CPV/T system. These results can be interpreted to mean that limited sunshine hours are more than the clear sky hours. It is worth mentioning that even under the limited sunshine and freezing ambient temperature of December and January the CPV/T system could provide considerable amount of energy to meet apartment requirements. In addition, for November and March the CPV/T system completely eliminated the natural gas and electricity consumptions. The savings for substituting the CPV/T system to electricity are more pronounced compared to natural gas, because the cost of electricity being quite high.
Figure 5. Heating costs using natural gas, electricity and CPV/T system.
5. Conclusion
Based on the findings it has been shown that there are various operational parameters that can be varied to control the performance of a point focused CPV/T system. The fact that the variations in thermal fluid flow rate made notable impact on the electrical efficiency and marginal effect on the thermal efficiency of the CPV/T collector. At reduced zero temperature, the maximum thermal and electrical efficiencies of the Collector were found to be 65.2% and 18.5%, respectively. Due to high rate of useful energy gain per unit area, the CPV/T system proved to be a best choice for building heating even in cold winter conditions of Korea. The proposed system eliminated the auxiliary energy consumption for November and March, and also minimized the average heating costs for December and January up to 34% and 30%, respectively. As a replacement for auxiliary energy sources such as electricity and natural gas, the LCS for the CPV/T system were found to be 2891 $ and 2370 $, respectively. Based on electricity the DPP of the CPV/T system was 12 years which is 3 years less than that based on natural gas. The initial cost and DPP of CPV/T system can be reduced remarkably by integrating this system with grid (for selling electricity throughout the whole year).
Acknowledgments
This work was supported by Korea Research Fellowship Program through the National Research Foundation of Korea (NRF) funded by the Ministry of Science and ICT (2016H1D3A1938222); Korea Institute of Energy Technology Evaluation and Planning (KETEP) and the Ministry of Trade, Industry & Energy (MOTIE) of the Republic of Korea (No. 20188550000480).
Disclosure statement
No potential conflict of interest was reported by the authors.
Additional information
Funding
Notes on contributors
M. Imtiaz Hussain
M. Imtiaz Hussain is a research professor of green energy technology research center at Kongju National University since November 15, 2016. He has more than eight years of working experiences in academia and multinational companies. His research interest includes modeling, development and application of solar energy systems for residential and industrial sectors.
Jun-Tae Kim
Jun-Tae Kim is a professor of architectural engineering and energy systems engineering at Kongju National University in Korea. Before joining the university in March 1998, he worked at Korea Institute of Energy Research. His research interests include solar energy applications in buildings and zero energy building technologies.
References
- Anderson, T. N., M. Duke, G. Morrison, and J. K. Carson. 2009. “Performance of a Building Integrated Photovoltaic/Thermal (BIPVT) Solar Collector.” Solar Energy 83 (4): 445–455. doi:10.1016/j.solener.2008.08.013.
- The Bank of Korea. Accessed 22 March 2017. http://www.bok.or.kr/eng/engMain.action
- Central city gas. Accessed 20 March 2017. https://www.jbcitygas.com/
- Chemisana, D. 2011. “Building Integrated Concentrating Photovoltaics: A Review.” Renewable and Sustainable Energy Reviews 15 (1): 603–611. doi:10.1016/j.rser.2010.07.017.
- Chow, T., J. Hand, and P. Strachan. 2003. “Building-Integrated Photovoltaic and Thermal Applications in a Subtropical Hotel Building.” Applied Thermal Engineering 23 (16): 2035–2049. doi:10.1016/S1359-4311(03)00183-2.
- Duffie, J. A., and W. A. Beckman. 2013. Solar Engineering of Thermal Processes. New York: John Wiley & Sons.
- Eschenbach, T. G. 2011. Engineering Economy: Applying Theory to Practice. 3rd ed. New York: Oxford University Press.
- Fung, T. Y., and H. Yang. 2008. “Study on Thermal Performance of Semi-Transparent Building-Integrated Photovoltaic Glazings.” Energy and Buildings 40 (3): 341–350. doi:10.1016/j.enbuild.2007.03.002.
- Huang, M., P. Eames, and B. Norton. 2004. “Thermal Regulation of Building-Integrated Photovoltaics Using Phase Change Materials.” International Journal of Heat and Mass Transfer 47 (12): 2715–2733. doi:10.1016/j.ijheatmasstransfer.2003.11.015.
- Imtiaz Hussain, M., A. Ali, and G. H. Lee. 2016. “Multi-Module Concentrated Photovoltaic Thermal System Feasibility for Greenhouse Heating: Model Validation and Techno-Economic Analysis.” Solar Energy 135: 719–730. doi:10.1016/j.solener.2016.06.053.
- Imtiaz Hussain, M., and G. H. Lee. 2015. “Utilization of Solar Energy in Agricultural Machinery Engineering: A Review.” Journal of Biosystems Engineering 40 (3): 186–192. doi:10.5307/JBE.2015.40.3.186.
- Imtiaz Hussain, M., and G. H. Lee. 2017. “Numerical and Experimental Heat Transfer Analyses of a Novel Concentric Tube Absorber under Non-Uniform Solar Flux Condition.” Renewable Energy 103: 49–57. doi:10.1016/j.renene.2016.10.079.
- KEPCO. Accessed 20 March 2017. https://home.kepco.co.kr/kepco/EN/F/htmlView/ENFBHP00103.do?menuCd=EN060201
- Standard, A.S.H.R.A.E., 1977. Methods of testing to determine the thermal performance of solar collectors. American Society of Heating: 93–77.
- Valenzuela, L., R. López-Martín, and E. Zarza. 2014. “Optical and Thermal Performance of Large-Size Parabolic-Trough Solar Collectors from Outdoor Experiments: A Test Method and A Case Study.” Energy 70: 456–464. doi:10.1016/j.energy.2014.04.016.