
ABSTRACT
The sales of the traditional markets have declined sharply since the 2000s. Therefore, the government has employed various measures including diverse policy and economic support programs. However, despite the continuing financial support for modernizing the facilities of the traditional markets, the effectiveness of each support has not been tested. Therefore, it is urgent to establish a clear direction for the support programs. This study analyzed the effectiveness (i.e., increase in sales) of the support for diverse market types in order to run the Traditional Market Financial Support Program efficiently. In order to achieve the study objective, this study collected annual sales data from 66 markets and statistically analyzed the data by market types and facility support type. The results of this study showed that the support increased the sales of markets and the increase in sales was different between support facility types and market characteristics. The results empirically proved the Traditional Market Facility Modernization Program increased the sales of traditional markets. The results of this study will be useful to manage the Traditional Market Facility Modernization Program efficiently.
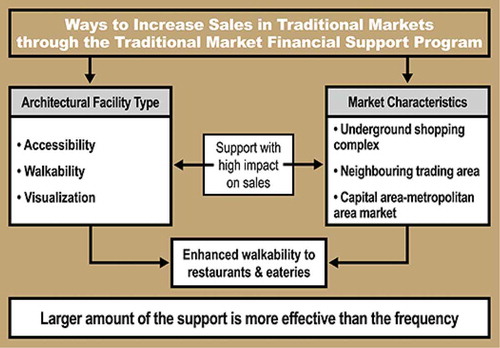
Graphical Abstract
1. Introduction
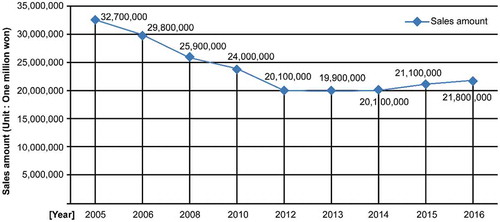
In South Korea, a traditional market is a place where tourists can enjoy history, culture, and tourist attractions of the area in addition to the exchange of goods and services. It is designated by a mayor, a municipal governor, or a mayor of the province to develop or promote it. The traditional market has been considered as a place of representing the life of the ordinary people as well as trading goods. The people working in the traditional market are small business owners and it is different from hypermarkets, discount department stores, and large supermarkets with modern faculties. As the national income increases and urbanization accelerates, the traditional markets are losing competitiveness against the modern markets. The sales of Korean traditional markets declined steadily from 32.7 trillion KRW in 2005 to 19.9 trillion KRW in 2013 (). Although it slightly increased to 21.8 trillion KRW in 2016, the increase was marginal. Therefore, the government operates a financial program to modernize the facilities of the traditional markets by investing in public resources. The government hopes that the program will enhance the competitiveness of the markets and promote the self-sufficiency of them, which are mainly run by small business owners.
Figure 1. Total sales amount in traditional markets (Exchange rate: USD 1 = KRW 1,050). Small Enterprise and Market Service (Citation2010, Citation2014, Citation2015, Citation2016).
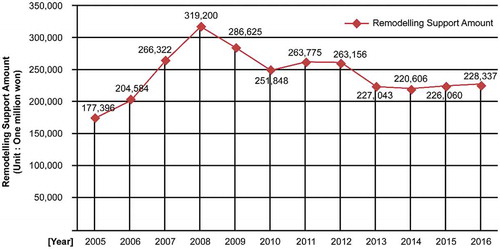
The financial program refers to the financial support of the government to improve user convenience, revitalize the market, and promote mutual benefits by modernizing inconvenient old facilities and expanding convenience facilities. However, although approximately 2.9 trillion KRW has been invested to the program from the central and local governments for the past twelve years (2005–2016) (), the sales of the traditional markets decreased by 33% during the same period (Ministry of SMEs and Startups Citation2017).
Figure 2. Total financial support amount for remodeling the traditional market (Exchange rate: USD 1 = KRW 1,050). Small Enterprise and Market Service (Citation2010, Citation2014, Citation2015, Citation2016).
Various studies have been conducted to understand why the sales of the traditional markets did not increase even though the huge financial resources have been invested in the program. These studies have tried to identify the causal factors from the viewpoints of business administration, marketing, and community development. For example, Lee, Kim, and Kim (Citation2015) reported that the program had little effects on actual market promotion although merchants and customers were highly satisfied with it. Song (Citation2015) pointed out that the projects were carried out uniformly without considering business types despite various supports had been made to modernize the facilities. Lee (Citation2016) argued that it would be necessary to differentiate the support to satisfy the unique needs of each traditional market instead of uniformed supports. He classified the traditional market into various types and emphasized the needs for establishing and implementing support policies meeting the needs of each market. However, he failed to provide clear conclusions because it was difficult to verify the effectiveness of each support item. Lee and Lee (Citation2015) evaluated the satisfaction regarding the facility support. They argued that it would be necessary to support the facility constructed according to the market characteristics, but it would be required to confirm the support type for facility modernization and the effects of investment. Kim and Chung (Citation2013) examined the effects of facility modernization on market revitalization and used the changes in the number of markets, the number of shops, and the number of merchants as the indices of vitalization. He concluded that, although the facility modernization program affected the market revitalization positively, it was not effective enough compared to the amount of investment. He also reported that it was impossible to accurately assess the market revitalization effects because he could not secure the sales data.
Numerous researchers have studied the same topic (). Most of them pointed out the problems of supporting institutions that support indiscriminately without conducting adequately assessment or testing the effects of supports in advance. However, no studies evaluated the actual changes in sales according to the market characteristics and facility types. It is believed that the success of the program depends on understanding how the program can be operated efficiently or identifying what kinds of supports are effective to increase the sales for each market. The objective of this study was to discover the optimal facility support plan by analyzing support methods, support size, facility construction types, market characteristics, and support effects (changes in sales) in terms of the Traditional Market Facility Modernization Program and project management.
Table 1. Previous studies on traditional markets.
The goals of this study were to derive the theoretical concepts and problems about the concept, procedure, and government policies of the traditional market facility modernization project financial support program, to verify the effects of the program statistically, and to draw the plans to operate and manage the program efficiently. The detailed methods of each step are as follows.
First, this study established the evaluation criteria and procedures of the facility modernization financing program in South Korea, evaluated the financial support cases, and classified the characteristics of the market and the types of support facilities based on the findings.
Second, the study model was set up and hypotheses were developed. Afterward, the necessary data was collected to test the hypotheses statistically. The target market was identified and the data of financial support time, support amount, and changes in sales were collected.
Third, the effects of financial supports were evaluated using t-test, ANOVA, and multiple regression analysis. Based on the analysis results, the study drew the plans to efficienate the business management of the Facility Modernization Financial Support program.
2. Introduction and problems of the traditional market facility modernization project financial support program
The financial support for the Traditional Market Facility Modernization Program is provided up to 8 billion KRW per market (up to 11 billion for the market holding more than 700 stores) for each type of facility according to Special Act on the Development of Traditional Markets (Citation2017) and Shopping District. The support amount consists of national expense (60%), local government expense (30%), and self-payment expense (10%). This program can support various facilities including arcade, customer service center, access road, customer facilities, shared use facility, electrical, gas and fire fighting system, and CCTV. The merchant association of each market decides the facility to be supported when it submits the application for support. An evaluation committee (composed of one member from Ministry of SMEs and Startups, one member from a local government, and two external committee members) selects the market to be supported by the Facility Modernization Project considering the various items (). The committee visits the market in person and evaluates the actual condition.
Table 2. Evaluation item and score criteria for Facility Modernization Project.
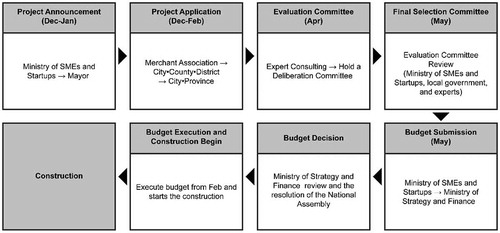
The application procedure of the traditional market is basically a bottom-up procedure. A market merchant organization (e.g., merchant association) submits an application to a local government and an evaluation committee (composed of the Ministry of SMEs and Startups, a local government, and civilian experts) decides the market to support at the final selection meeting. Afterward, Ministry of SMEs and Startups submits the budget to the Ministry of Strategy and Finance to confirm the budget and exercise it next year (). Although the deadline for application and selection date can vary, the Ministry of SMEs and Startups always holds a briefing session to the merchant organizations every year.
Figure 3. Flowchart of financial support for the Facility Modernization Project.
In this process, it becomes hard to manage the outcome of financial support, which is a major problem. First, the merchant association decides the type of facility modernization construction by themselves and merchants prefer to conduct expensive constructions. However, they do not consider how this facility improvement affects the increase in sales specifically in this decision-making process. Secondly, it is necessary to evaluate whether the project is required at the current condition of a facility, whether the project will be cost-effective, and whether the applied project will increase the sales of the market. However, these factors are not considered in the application process and the evaluation of the committee is also very subjective. Therefore, the effects of this financial support for modernizing the facilities have not been tested through the post-evaluation process.
In order to maximize the effects of the Traditional Market Facility Modernization Program’s financial support, it is necessary to reflect the results of the financial support analysis in the policy establishment step and the facility evaluation step for selecting a facility to support. Therefore, it is urgent to prioritize facility types to support and establish a plan to efficienate financial support.
3. Data acquisition and analysis methodology
It will be necessary to compare the sales of the market received financial support and those of the market not received financial support in order to identify if the financial support used for modernizing the traditional markets in South Korea led to sales growth. Moreover, it will be required to analyze the market characteristic, the support status by facility type, and the dynamics of sales.
This study collected data from 66 markets. Fifty-two markets among them received in some form of government support and the other 14 markets did not receive government support. The overall status data could be collected through Statistics Korea (Citation2016). The data related to support funds such as facility type, market characteristics, support timing, and amount of investment were collected from the Ministry of SMEs and Startups, Small Enterprise and Market Service, and local governments using the National Information Disclosure System. The sales data (the past 11 years) of the supported and unsupported markets were collected from each merchant association by visiting each association in person.
It is necessary to classify the targets of remodeling projects and the purposes of the support fund to know when the support fund was more effectively used. Therefore, this study identified five categories of markets (i.e., market type, market size, the size of a trading area, main handling items, and region) and classified each category into detailed types (). The usage details of the support fund were analyzed in order to recognize what kinds of facilities were remodeled using the support fund and 38 items could be extracted from the analysis. However, since it is hard to draw meaningful results by analyzing too many items, this study grouped them into five facility types (i.e., convenience, walkability, accessibility, visualization, and facility maintenance) considering the characteristics of facilities (). The effectiveness analysis analyzed these five types.
Table 3. Classification of market characteristics.
Table 4. Classification of facility type.
The obtained data is summarized as the facility support cases () and 52 markets among 66 survey target markets were supported by this program. The data of these 52 markets included the type of facilities supported by this program and the amount of support for the past 11 years (2005–2015). The rates of changes in sales were estimated based on the obtained data for further analysis.
Table 5. Cases of supporting facility remodeling.
A cost-effectiveness analysis was conducted on the data by establishing various hypotheses () and diverse statistical analyses were used to test them. These analyses used received support (i.e., yes or no), the number of support, and the amount of support as independent variables. Dummy variable analysis was used because each independent variable had a different number of data when 153 support facilities were classified by facility type and market type. The rate of change in sales was used as a dependent variable because it was the factor representing the management performance of the market.
Table 6. Testable hypotheses and statistical analyses used for each hypothesis.
4. Analysis results
Hypothesis 1: There will be a difference in the rate of change in sales between the markets with facility support and those without facility support.
This hypothesis intended to verify whether the financial support program increased sales or not. This study collected the annual sales data for the past eleven years for all 66 markets. Using the data, this study analyzed the rate of changes in the annual sale for three years for 153 support cases of 52 markets and 14 markets without receiving supports using t-test. The results of the analysis revealed that the rate of change in sales of the supported markets and that of not supported markets were significantly (p < 0.05) different and H1A was accepted. Specifically, the rate of change in sales of not supported 14 markets decreased in all the years while that of supported 52 markets increased in all the years. The results clearly indicated that the financial support for the facility remodeling had positive effects on the rate of change in sales. Particularly, the difference between the mean rate of change in sales of the market with support and that of the market without support was the largest (6.98%) at 1 year after support. The hypothesis and statistical method for this study are as stated in .
Hypothesis 2: In the case of the markets with facility support, there is a difference in the rate of change in sales between the year immediately after receiving the support and the year without receiving the support.
Table 7. Descriptive statistics and the results of t-test on the rate of change in sales of markets with support and markets without support.
It was confirmed from the hypothesis 1 that the support made a difference in the overall changes in sales. However, the increase in sales can be a result of selection criteria because one of the selection criteria is the potential of the market. (Therefore, the increase in sales of the supported market may be an obvious result.) Therefore, the study compared the yearly rate of change in sales of supported markets.
Specifically, the study compared the rate of change in sales within a year after receiving a support with that of other years without receiving a support in the same market. This test was conducted because the increase in sales could be a result of better efforts of merchants instead of the financial support for remodeling.
In the case of 52 supported markets, they received 153 supports during the eleven years. The rates of annual change in sales immediately after receiving the support were compared with those of years without receiving the support using t-test. The analysis results showed that they were significantly (p < 0.05) different. In other words, H2A was accepted. The result indicated that the facility support increased the sales regardless of market characteristics and basic conditions. In summary, the sales increased by 2.59% on average one year after receiving a support and it decreased by 2.74% on average when no support was received ().
Hypothesis 3: In the case of the markets with facility support, the total amount of support and the number of support affect the rate of change in sales differently.
Table 8. Descriptive statistics and the results of t-test on the immediate effects of support on the rate of change in annual sales.
The traditional market remodeling project may provide a different amount of fund per support and markets may receive support for a different number of times. Therefore, this hypothesis is to evaluate the effects of the total amount of support and the number of supports on the rate of change in sales. A multiple regression analysis was conducted with using the total amount of support (x1) and the number of supports (x2) as independent variables and the sum of the rates of changes in sales (y) as a dependent variable. The results of the analysis showed that the total amount of support (x1) significantly (p < 0.05) affected the dependent variable while the number of supports did not significantly (p ≥ 0.05) affect the dependent variable (). The results implied that, in Facility Modernization Project, the amount of support was more important than the number of supports to increase the sales.
Hypothesis 4: The type of remodeled facility affects the rate of change in sales of the market.
Table 9. The effects of the total amount of support per market and the total number of support per market on the sum of the rates of changes in sales.
The facility support for traditional markets can be categorized into five types (i.e., convenience walkability, accessibility, visualization, and facility maintenance) (). Therefore, the success of a financial support program depends on how to prioritize the facility types to be supported. This hypothesis aimed to test this aspect and this study conducted one-way ANOVA to evaluate the differences in the rates of changes in sales within three years from receiving a support.
Table 10. Mean rate of change in sales by facility type.
The rates of changes in annual sales indicated the sales increased the most immediately after receiving a support and the increment decreased with time. Moreover, it is noteworthy that the support for accessibility and walkability facility types changed the sales noticeably (). The results of the one-way ANOVA test indicated that the support significantly (p < 0.05) affected the rate of change in sales only at one year after the support (). Moreover, Tukey HSD post-hoc analysis was also conducted for evaluating which facility type affected the rate of change in sales more (). The results of this analysis showed that the effect of accessibility was significantly (p < 0.05) larger than that of facility maintenance. The difference between the effects of the two variables was 4.75%. The results clearly indicated that support for accessibility was more effective than that for facility maintenance.
Hypothesis 5: The characteristics of a market receiving the support affect the rate of change in sales of the market.
Table 11. Difference in the rate of change in sales by facility type (ANOVA).
Table 12. Tukey HSD post-hock analysis for evaluating the rate of change in sales by facility type.
Another factor determining the success of a financial support program is to identify which market should be supported in advance. Therefore, it is critical to understand the effects of the market characteristics on the rate of change in sales. The market characteristics can be categorized into market type, market size, the size of a trading area, main handling items, and region (). Each category has several sub-categories. To test this hypothesis, ANOVA was conducted to test the effects of market characteristics’ sub-categories on the rate of change in sales.
Table 13. Mean rate of change in sales by market characteristics.
The results of ANOVA indicated that the effects of market type, market size, the size of a trading area, main handling items, and region on the rate of change in sales were significantly different. Moreover, the mean rate of change in sales showed that it increased the most in the first year after receiving a support and decreased afterward, which was a similar pattern with the facility type. At one year after receiving a support, building type (3.05%) in market size, large (4.70%) in market size, neighborhood commercial area (5.41%) in the size of a trading area, restaurants and eateries (5.19%) in main handling items, and metropolitan area (3.86%) in region was the major factors affecting the mean rate of increase in sales ().
When the sub-categories of the market type were compared, the rate of increase in sales was significantly different for the size of a trading area after three years (p = 0.048) and the region after one year (p = 0.002). There was no difference among sub-categories of market size and major handling items (). Tukey HSD post-hoc analysis was conducted for market type, market size, and region, which showed a significant difference, in order to find out which sub-category affected the rate of change in sales more.
Table 14. Differences in the rate of change in sales by market characteristics (ANOVA).
The results showed that the underground shopping complex type had a higher rate of change in sales at three years after receiving a support than multipurpose building type (p = 0.048). Moreover, the neighboring trading area had a higher rate of change in sales at one year after receiving a support than metropolitan (p = 0.007) and local (p = 0.006) trading areas. At one year after receiving a support, capital area – metropolitan area showed a higher rate of increase in sales than local small and medium cities (p = 0.010). In summary, the underground shopping complex type had a 2.45% higher sales increase than the multipurpose building type. In the aspect of the trading area size, the neighboring trading area had a 4.52% higher increase and a 4.25% higher sales increase than metropolitan and local trading areas, respectively. In terms of region, capital area – metropolitan area market showed a 3.07% higher sales increase than local small and medium cities market (–).
Hypothesis 6: There is an interaction effect between facility type and market characteristics on the rate of change in sales.
Table 15. Post-hoc analysis (Tukey HSD) of the sub-categories of market type.
Table 16. Post-hoc analysis (Tukey HSD) of the sub-categories of the size of a trading area.
Table 17. Post-hoc analysis (Tukey HSD) of the sub-categories of region.
4.1. Interaction effect between facility type and market characteristics (MANOVA)
Hypotheses 4 and 5 tested if the market type and market characteristics influenced the increase in sales. However, it is possible that the effect of market type on the increase in sales depends on the level of market characteristics. In other words, market type and market characteristics may interact. Since market characteristic variables can regulate the effects of a facility support type on the change in sales, their interaction was tested using MANOVA.
The results of the analysis showed that only the main handling items among market characteristics had a regulation effect on the changes in sales of facility type. Particularly, facility type and main handling item showed significant interaction on the rate of change in sales at one year after receiving support (p = 0.003). It means that the item mainly sold in the market can influence the effects of facility type on the sales. shows the interaction terms between facility type and the entire market characteristics.
Table 18. Between-subjects effect test of support facility type and market characteristics (Multivariate ANOVA).
4.2. Multiple regression analysis of facility type
Multiple regression analysis was carried out to find the variables significantly affecting the sales based on the results of MANOVA (4.6.1). The rate of change in sales was a dependent variable, and investment (yes/no) and the amount of support for each facility type were independent variables.
The results of the analysis indicated that the amount of support (p = 0.010), walkability (p = 0.010), accessibility (p = 0.036), and visualization (p = 0.034) significantly affected the rate of change in sales. Facility maintenance was excluded from the analysis due to multicollinearity issue. The beta values of these significant variables were all positive and the standardized regression coefficient (beta) was 0.240, 0.200, and 0.186 for walkability, accessibility, and visualization, respectively, indicating the order of the magnitude of impact. The results clearly showed that the support to walkability, accessibility, and visualization improved the sales, or management performance ().
Table 19. Multiple regression analysis of support facility type and the amount of support (Multiple Regression Analysis).
4.3. Analyzing the regulation effects of facility type (two-way ANOVA)
The regulation effects of walkability, accessibility, and visualization, which were found significant in the previous multiple regression analysis, were analyzed further for each market characteristic. Two-way ANOVA was performed and the results showed that there was a significant interaction effect between the main handling item and walkability ().
Table 20. Test of interaction terms.
It is possible to identify what kinds of item and walkability have the largest interaction effect using Tukey HSD post-hoc analysis. However, the main handling items were not significantly (p < 0.05) different. “Restaurant and eatery market” had 3.13 and 2.86% higher sales on average than “clothing goods and necessities” and “agro-fishery products and food products”, respectively. The results of the analysis revealed that the support to walkability at “restaurants and eateries market” had the largest effect ().
Table 21. Tukey HSD post-hoc analysis of main handling items.
5. Summary and conclusions
This study evaluated the support cases of the Facility Modernization Project and analyzed the rates of change in sales depending on the support. This study also analyzed the rates of change in sales by the amount of support and the number of support. Moreover, the construction type of supported facility was categorized into 5 facility types. Additionally, the market characteristics were classified into market type, market size, the size of a trading area, main handling item, and region. Lastly, it was statistically evaluated if the rate of change in sales varied by facility type and market characteristics.
Specifically, this study aimed to identify an efficient management plan of the financial support program by examining the effects of the program by facility type and market characteristics. In terms of facility type, the results showed that accessibility increased sales significantly more than facility maintenance. In terms of market characteristics, the support increased the sales greatly in underground shopping complex type, neighboring trading area, and capital area – metropolitan area market. The results of this study also showed that enhanced walkability, accessibility, and visualization greatly increased sales. In terms of the interaction between facility type and market characteristics, the support to walkability among facility types increased the sales in restaurants and eateries market. Based on the analysis results, proposed ways to efficienate the project are summarized in .
Table 22. Summary of analysis results.
The objective of this study was to propose a way to efficienate the Facility Modernization Financial Support for Traditional Market program by identifying and analyzing the factors affecting the rate of change in sales according to the facility type and market characteristics. Although the government has continued to support the Facility Modernization Financial Support for Traditional Market program, the effects of it on the sales increase have not been tested. Moreover, merchant associations have applied for construction support for a facility requiring higher cost without considering the effects of facility improvement. The applied projects have been evaluated by the evaluation committee and committee members are required to examine the effectiveness of the support objectively. However, the decisions and evaluations mostly rely on subjective criteria. In order to set the clear direction of Facility Modernization Financial Support program and maximize the effects of the support, this study analyzed the data of 66 markets, classified the facility construction type and market characteristics, and analyzed the changes in sales to draw the following conclusions.
H1 and H2 tested whether the facility support is effective in the sales increase. The results of analyses on empirical data showed that markets with receiving the facility support had a higher impact on sales increase than those without receiving the facility support. Moreover, when analyzing the markets receiving the facility support, the year receiving the support showed a higher increase in sales than the year without receiving the support. The results are meaningful because the effects of the support on sales were proven empirically. H3 intended to test which had a higher impact on sales between the amount of support and the number of support. The results of the analysis indicated that the amount of support affected the sales more. Moreover, the results implied that a large amount of support was more effective than frequent support.
H4 analyzed the changes in sales in order to identify the support to which facility type had the highest effect on sales. The analysis confirmed that the support for accessibility was more effective than the support for facility maintenance.
H5 analyzed the changes in sales in order to identify the effects of market characteristics on them. The analysis results indicated that the support for the underground shopping complex has a higher impact on sales than that to multipurpose building. Moreover, it was found that, in terms of market type, the support to the neighboring trading area was more effective to increase sales than that to metropolitan and local trading areas. In terms of region, the support to the capital area-metropolitan area increased sales more effectively than that to local small and medium cities.
H6 intended to find out the interactions among facility support, facility type, and facility characteristics on the changes in sales in order to identify what kind of support to which facility type was the most effective in which market characteristic. The analysis results showed that walkability, accessibility, and visualization had positive effects on sales. There was the largest interaction between the support to walkability and restaurants and eateries market. No other interaction effect was observed.
This study analyzed the effects of facility type and market characteristics on the relationship between financial support and the changes in sales. This study drew some meaningful analysis results. In short, Facility Modernization Financial Support had positive effects on the management achievements of markets and the support had different effects on sales depending on the facility type and market characteristics.
The important practical implication of this study is that the sales of the market can be increased when market characteristics and facility types are considered in selecting markets to support, unlike the current selection criteria. Since the goal of the program is to maximize the performance through financial support, we believe that the results of this study have made a great contribution to identifying the direction. We also believe that the presented analysis method will contribute to changing the concept of policymakers in establishing and operating similar policies and enhancing the effectiveness of policies in the future.
The followings are the suggestions to improve the efficiency of financial support based on the results of this study.
The amount of financial support is a more important determinant of the effects of financial support than the number of financial support.
When reviewing the financial support applications, the accessibility type should be prioritized over the facility maintenance type.
It is recommended to support the underground shopping complex type over the multipurpose building type in the aspect of market characteristics. Moreover, the neighboring trading area should be prioritized over the metropolitan trading area and the local trading area. Moreover, capital area-metropolitan area market should be supported first over local small and medium city market. However, the local government must decide which market to support according to the management efficiency along with the preservation and value of the market.
When determining the facility type to be supported without considering the market characteristics, the priority should be given in the order of walkability, accessibility, and visualization.
When determining the facility type to be supported with considering the market characteristics, the walkability facility of a restaurants and eateries type market should be supported first.
Therefore, it will be possible to prioritize the facility type to be supported by considering the facility type in managing the financial support remodeling program. Moreover, the results of this study can be used as an objective index to select a target market in consideration of the effects of market characteristics.
This study proposed a way to efficienate the financial support of the Traditional Market Facility Modernization Program. It is expected that the sales of markets will increase more if the government considers the market characteristics and facility types, like the analysis results of this study, while selecting markets for financial support according to the financial support policy. Since the objective of this policy is to revitalize the market through the financial support of the Facility Modernization Program, it is believed that the results of this study will contribute to proposing the direction of facility support programs to hands-on staffs operating policies and increase actual benefits for store owners.
Although this study directly collected vast amounts of data, there were a limited number of collectible data types. In other words, we admit that there may be very complex interactions among the amount of government support, the purpose of the support, and the sales trend, but only a few data analysis were possible due to limited data availability. We believe that future studies will need to obtain more various datasets and analyze them using more sophisticated techniques.
Data availability
The datasets used and/or analysed during the current study are available in the article.
Disclosure statement
No potential conflict of interest was reported by the authors.
Additional information
Funding
Notes on contributors
Chul Jong Yoo
Chul Jong Yoo finished his Ph.D. at Sungkyunkwan University, and is the CEO of Haemil CM Corporation. He has extensive research and practical experience in supervision and construction management.
Yea Sang Kim
Yea Sang Kim is a professor at the Department of Architectural Engineering and Landscape Architecture, Sungkyunkwan University, and teaching construction management. He majored in architectural engineering and design for his undergraduate and MS and completed them in Yonsei University, Korea. He also earned his MS and Ph.D. at the University of Texas at Austin, the U.S.A. in construction engineering and project management. His main research theme is the application of management theories to the construction project and industry. He has rich experience in improving construction laws and regulations in Korea as well.
References
- Jung, W. G. 2011. “A Study on Status of Facilities Modernization at Traditional Market” Master’s Thesis, Kyungsung University.
- Kang, G. S. 2016. “A Study on The Improvement Plan Of Supporting Traditional Market” Master’s Thesis, Pusan National University
- Kim, B. S., J. W. Roh, T. Y. Kim, and K. H. Kim. 2006. “The Indoor Environment Easurement Anslysis of Arcade-Type Markets in Korea.” Journal of Asian Architecture and Building Engineering 5 (1): 191–198. doi:10.3130/jaabe.5.191.
- Kim, Y. H., and C. M. Chung. 2013. “A Study on the Effects of the Traditional Market Modernization Project on Commercial Supremacy Vitalization.” Journal of the Korean Society of Housing Environment 11 (3): 277–290. ISSN: 1738-0316. http://www.reik.or.kr/
- Lee, D. H., and Y. S. Lee 2013. “A Study on the Effect of Governments’traditional Retailand Periodic Market Policies on Revitalization of Market : Focused on Traditional Retail and Periodic Markets in the Urban Areas of Daegu and Daejeon” Journal of Korean Industrial Economic Association 26 (5): 2337–2360. ISSN: 1229-201X, http://www.kiea.ne.kr/
- Lee, G. H. 2016. “An Empirical Research on the Improvement Plan and Problem of Government-led Traditional Market Revitalization Support Programs.” PhD Thesis, Korea Polytechnic University.
- Lee, J. H., Y. Kim, and S. M. Kim. 2015. “A Study on the Effective Analysis of Modernization Project and A Revitalization Plan of Traditional Markets.” Journal of Korea Planners Association 50 (3): 257–286. doi:10.17208/jkpa.2015.04.50.3.257.
- Lee, S. J., and J. S. Lee. 2015. “A Study of Effect Analysis about Traditional Market Activation Business.” AIK Branch Association 17 (6): 111–118. http://www.aikra.co.kr/
- Lee, S. K. 2017. “A Study on Traditional Market Decline and Revitalization in Korea (improving the Iksan Jungang Traditional Market).” Journal of Asian Architecture and Building Engineering 16 (3): 455–462. doi:10.3130/jaabe.16.455.
- Legistlative Office. 2017. “Special Act on the Development of Traditional Markets and Shopping Districts.” Accessed 1 June 2018. https://elaw.klri.re.kr/eng_service/lawView.do?hseq=40228&lang=ENG
- Ministry of SMEs and Startups Korea. 2017. Amended Notice of Traditional Markets and Shopping Districts Facility Modernization Program Operation Guideline. https://www.mss.go.kr/https://search.mss.go.kr/RSA/front_new/Search.jsp
- Ministry of SMEs and Startups Korea. 2018. Notice for 2018 Traditional Markets and Shopping Districts Revitalization Support Program. https://www.mss.go.kr/. https://search.mss.go.kr/RSA/front_new/Search.jsp.
- Park, C. H. 2013. “An Analyzing on the Factors of Affecting Physical and Non-physical Improvement Strategies for the Traditional Markets.” PhD thesis, Hanyang University.
- Park, C. H., and J. H. Koo. 2014. “An Analysis of the Influential Relationship between Cultural Promotion Activities and Social Capital in the Traditional Market: A Comparative View with Routine Merchant Activities.” Journal of Asian Architecture and Building Engineering 13 (1): 71–78. doi:10.3130/jaabe.13.71.
- Seo, J. S. 2012. “Effects of Perceived Benefits and Costs of Traditional Market Aid on Relationship Quality and Support of Marketeer” PhD Thesis, Sejong University.
- Small Enterprise and Market Service Public corporation. [2010] 2014–16. "Report on Traditional Market Shopping Districts and Store Management Factual Survey, Daejeon. https://www.semas.or.kr/. https://www.semas.or.kr/web/SUP01/SUP0111/SUP011104.kmdc.
- Small Enterprise and Market Service Public corporation. 2014. 2014 TraditionalMarkets and Shopping Districts Store Management Factual Survey.
- Song, M. G. 2015. “A Study on the Characteristics by Type of the Facility Modernization Project for the Traditional Market Activation.” Master of Engineering Degree Thesis, Kyungpook National University.
- Statistics Korea. 2016. “Statistics Information Report on Traditional Markets and Shopping Districts Store Management Factual Survey.” Accessed 1 June 2018. http://meta.narastat.kr/metasvc/svc/SvcMetaDcDtaPopup.do?orgId=309&confmNo=309002&kosisYn=Y