
ABSTRACT
The purpose of this study is to suggest a quantitative risk assessment approach for construction sites using risk indicators to predict economic damages. The frequency of damage in building construction has recently increased, and the associated costs have been increased as well. Although a request for a damage estimation model has been extended, the industry still lacks quantitative and comprehensive research that reveals the physical relationship between damage and risk indicators. To address that issue, we use an insurance company’s payouts from construction site claims in South Korea to reflect the real financial damage. We adopted a multiple regression method to define the risk indicators: geographic vulnerability, natural hazards, capability, and general project information. The results and findings of this research will be accepted as an essential guideline for developing a construction risk estimation model.
1. Introduction
The obvious recent trends in construction projects are a larger size and increasing process complexity. For example, the Korean Statistical Information Service reports that of the total construction contracts from 2006 to 2015, 92.8% were large projects, with a total cost of more than 10 billion KRW (Korea statistical yearbook (Citation[2005] 2014)).
As construction project sizes increase, the risk and uncertainty associated with construction projects rises as well. Insurance Statistics Information Services (INSIS) reports that the total amount of loss in the construction industry increased 37.6%, from 54.7 billion KRW in 2006 to 87.7 billion KRW (Insurance statistical monthbook (Citation[2006] 2015).
Moreover, the Korea Occupational Safety and Health Agency notes that although the accident rate across all industries declined by 29.7%, from 0.84% in 2004 to 0.59% in 2013, with a frequency rate for injury of 2.95% in 2013, the accident and frequency rates in the construction industry were 0.92% and 4.96%, respectively, in 2013, 1.6 and 1.7 times higher than the overall rate MOEL (Citation2015). Thus, the construction industry has a higher risk than the overall industrial sector.
However, the nature of construction, e.g., the longevity of the projects and the many variations of fieldwork, is an obstacle to accurate risk analysis and management because of its fluctuations and uncertainties Kim, Kang, and Park (Citation2010). Precautionary measures against disaster risk are likely to cost more than the damages caused by the accidents that do occur (Emmett and Therese Citation1995). Therefore, managers need risk assessment models to numerically analyze their risks.
In this study, we analyze the financial loss records from actual construction sites in South Korea and statistically examine the relationships between the damages and risk indicators. We use the insured claim payouts of an insurance company to reflect the real financial damages caused by accidents. We then develop the risk indicators and risk assessment model using a multiple regression analysis.
The results of this research will be acknowledged as an essential guideline for developing a construction risk estimation model in South Korea. Moreover, other developing countries similar to South Korea with respect to the construction environment and natural disasters can be adopted the framework and finding of research. We also expect our results to develop in the future through continuous feedback on the accumulated effects and data verification.
2. Methodologies of construction risk assessment
Even though much research has suggested risk indicators and risk assessment models for construction, quantitative and comprehensive studies are still required to estimate the financial risks of construction projects. (Kuo and Lu Citation2013) investigated a risk-assessment approach in accordance with numerous previous studies and interviews. They defined several risk factors, such as natural hazards and the ability of the constructor (Kuo and Lu Citation2013). Chan et al. (Citation2011) defined risk indicators and ranked them for construction projects using a questionnaire survey of various categories of examinees.
They recommended several risk factors, such as natural hazards, ability of the builder, and site environment Chan et al. (Citation2011). Hsueh et al. (Citation2007) tested a risk assessment practice on the cases studied and suggested a risk assessment model for construction projects using factors such as specific project information and inside and outside factors Hsueh et al. (Citation2007). (Akintoye and MacLeod Citation1997) proposed risk management and a risk analysis of methodologies based on a questionnaire survey of field managers and construction contractors. They used several risk indicators, including natural hazards, construction companies, and project information (Akintoye and MacLeod Citation1997). (Choi and Mahadevan Citation2008) offered a risk assessment approach for construction projects using a databank.
They chose critical factors to estimate the amount of risk in a construction project, such as natural disasters and construction-related risk factors (Choi and Mahadevan Citation2008). Bing et al. (Citation2005) used a questionnaire survey to identify risk indicators (constructor ability, site conditions, and so on) and suggested risk distribution methods in construction projects Bing et al. (Citation2005).
In conclusion, even when researchers have identified risk indicators and proposed methods for approaching risk assessment models, they did not test the relationship between the risk indicators and actual damage to determine whether the relationships are significant. Filling that gap requires a statistical investigation.
Moreover, it might be possible that risk indicators from other places are not significant for construction sites in other places. The difference in natural and construction environments among countries might change the sensitivity of the indicators. Hence, we adopt the various risk indicators from previous studies and statistically examine them against damage in this comprehensive study.
3. Research methodology and variables
We process four major phases to determine the risk indicators and identify the correlation between the risk indicators and damage.
First, we select the key risk indicators based on previous studies. Second, we collect the dependent variable, i.e., the claim payouts from construction sites, from an insurance company. Third, we gather each independent variable from the relevant construction sites. Fourth, we use a multiple regression method to classify the significant risk indicators and describe the relationship between the damage and each risk indicator.
3.1. Dependent variable
We used insurance claims from the construction site from 2000 to 2016. The total number of data was 430. The dependent variable is a percentage of damage, the damage ratio. Each damage ratio is estimated as the amount of damage (KRW) divided by the total cost of the construction project (KRW).
3.2. Independent variable
We use four categories of risk indicators in accordance with previous studies: geographical risk, natural hazards, construction ability, and project information, as shown in .
Table 1. Risk indicators.
Independent variables used in this study are essential data that must be input when joining an insurance company or indispensable for the evaluation of a subscription. Therefore, there was no missing information in the data used in this sample.
3.2.1. Geographical risk indicators
Even though, much research has suggested risk indicators and risk assessment models for construction, quantitative and comprehensive studies are still required to estimate the financial risk in a construction project. Kuo and Lu (Citation2013) conduct a study to investigate the risk assessment approach in accordance with the numerous previous studies and interviews. He defines several risk factors such as natural hazards, and ability of constructor, and so on (Kuo and Lu Citation2013).
Chan et al. (2010) define the risk indicators and its ranking for construction project basic of questionnaire survey from various categories of examinees. He recommends several risk factors such as natural hazards, the ability of builder, site environment, etc. (Chan et al. Citation2011).
Hsueh et al. (Citation2007) research a risk assessment practice is found on the cases studied and suggests a risk assessment model for construction projects utilizing several risk factors such as specific project information, inside and outside factors of a construction project (Hsueh et al. Citation2007).
Akintoye and MacLeod (Citation1997) propose risk management and risk analysis of methodologies based on a questionnaire survey from the field managers and construction contractors. He used several risk indicators such natural hazards, construction company, and project information (Akintoye and MacLeod Citation1997). Choi and Mahadevan (Citation2008) offer a risk assessment approach for construction project utilizing a databank. He choose critical risk factors to estimate the amount of risk in a construction project such as natural disasters, construction interrelated risk factors, and so on (Choi and Mahadevan Citation2008). Bing et al. (2004) identify the risk indicators, e.g., constructor ability, site conditions, and so on, suggest the risk distribution methods in construction projects using questionnaire survey (Bing et al. Citation2005)
In conclusion, even if the studies have identified the risk indicator and propose methods for approaching risk assessment models, there is a gap that the indicators would be need an statistical investigation to test the relationship with risks indicators and actual damage whether the relationships are significant or not.
Moreover, it might be possible that the risk indicators would not be significant for construction sites in other countries. The difference in natural and construction environment among the countries might change the sensitivity of indicators as well. Hence, this study adopts the various risk indicators found from the previous studies and statistically exam the indicators with damage as a comprehensive study.
3.2.2. Natural hazards indicators
Natural hazards play a main role in defining the risks in construction (Choi and Mahadevan Citation2008; Kuo and Lu Citation2013). Weather-related natural disasters directly cause construction delays, so floods, tropical cyclones, heavy snow, etc., are clear construction risks (Akintoye and MacLeod Citation1997; Carr and Tah Citation2001; Chan et al. Citation2011; El-Sayegh Citation2008).
To represent the risk of natural hazards, we use the Natural Hazards Assessment Network World Map of Natural Hazards from the Munich Reinsurance Company to assess the risk of floods and tropical cyclones. The worldwide natural hazard map represents the risk by grades. For example, the flood risk is scaled into five parts based on the occurrence of flooding: zone 0 is the area with an expected earthquake intensity of MM (Modified Mercalli scale) Ⅴ and lower, zone 1 is the area with an expected earthquake intensity of MM Ⅵ, zone 2 is the area with an expected earthquake intensity of MM Ⅶ, zone 3 is the area with an expected earthquake intensity of MM Ⅷ, and zone 4 is the area with an expected earthquake intensity of MM Ⅸ and higher.
The tropical cyclone risk is grouped into 6 sections in terms of the expected wind speed: zone 0 is the area with an expected wind speed of 76 to 141 km/h, zone 1 is the area with an expected wind speed of 142 to 184 km/h, zone 2 is the area with an expected wind speed of 185 to 212 km/h, zone 3 is the area with an expected wind speed of 213 to 251 km/h, zone 4 is the area with an expected wind speed of 252 to 299 km/h, and zone 5 is the area with an expected wind speed of more than 300 km/h.
3.2.3. Construction ability indicators
Many studies have found construction ability to be a key indicator of construction risk (Carr and Tah Citation2001; Chan et al. Citation2011; Choi and Mahadevan Citation2008; Kuo and Lu Citation2013). The productivity and quality of construction work and safety in construction sites are significantly related to the design, engineering, and skill levels of management (Akintoye and MacLeod Citation1997).
For example, a team experienced in engineering and design can conduct a well-managed procurement plan and respond quickly to sudden changes in design. An experienced management team can elicit increased productivity from site workers and ultimately reduce the project price and period. In addition, highly experienced managers on a construction site can prevent poor construction work. They can thus ensure a high-quality product and prevent reworking to correct faults. Furthermore, polished construction plans drawn by a highly skilled contractor can promote good communication and control between subcontractors and the customer, thereby preventing unexpected delays and the occurrence of excess costs (Kuo and Lu Citation2013).
In this research, we adopt the Engineering News Record (ENR) ranking to reflect construction ability. ENR is a weekly magazine that covers various areas of the construction industry and delivers information, analysis, etc. ENR also provides an annual ranking based on its yearly survey of gross revenue for international and US companies.
3.2.4. Project information indicators
The key features of a construction project can describe the amount of risk, which is computable based on the difficulty, complexity, and size of the construction project NDOT(Citation2012). The structure type delineates the difficulty of construction. For instance, reinforced concrete construction faces more hazards and accidental events than other construction types (Gurcanli, Bilir, and Sevim Citation2015).
Moreover, a project’s complexity can predict the progress rate. NDOT reports a relationship between the progress rate and risk amount because the amortizable and acknowledged risk increases as the project progresses (NDOT Citation2012). In addition, a project’s size can also reveal the amount of risk.
For example, Kim et al. (Citation2015) statistically investigated the relationship between the financial loss caused by a natural disaster and the vulnerability of the built environment. They found a significant connection between the size of a property and loss, such that a larger property is less vulnerable than a smaller property (Kim et al. Citation2015; Chan et al. Citation2011; Kuo and Lu Citation2013). In this study, we use the following variables: the structure type is a dummy variable, reinforced concrete and others; the total month indicates the total time for the construction project in months; the progress rate is the percentage complete at the time of the incident; and the number of floors and underground levels reflect the difficulty, complexity, and size of the construction project.
4. Data analysis
shows the descriptive statistics for the independent variables and the dependent variable. We use the backward elimination method to obtain the ideal-fit regression model. presents the summary of the regression model.
Table 2. Descriptive statistics.
Table 3. Summary of the model.
We transform the damage ratios by the natural log. The P-value of 0.000 is less than 0.05, which reveals that the model is statistically significant. The adjusted R-square value of 0.457 signifies that this relationship describes 45.7% of the variance.
The coefficients of the regression model are listed in . Six significant indicators, including field location, tropical cyclone, structure type, total month, floor, and underground, are identified against the damage ratio.
Table 4. Coefficients of the model.
We exclude the other indicators because the P-values are larger than 0.10. The weights of the variance inflation factor (VIF) are from 1.071 to 1.691, which indicates that none of the significant indicators have severe multicollinearity.
4.1. Inquiry of the model
The residual plot investigates homoscedasticity . The disorderly spread shapes of the residuals prove that they are randomly distributed. This verifies that the residuals’ variance is continuous.
Moreover, the histogram of the residuals and the Q–Q plot confirm that the model residuals are normally spread (). Furthermore, we use the Kolmogorov-Smirnov value to check the normality of the residuals and find that the residuals are ordinarily dispersed: the P-value of 0.200 is larger than 0.05, as seen in .
Figure 1. Residuals plot for the model.
Figure 2. Histogram of residuals and Q–Q plot.
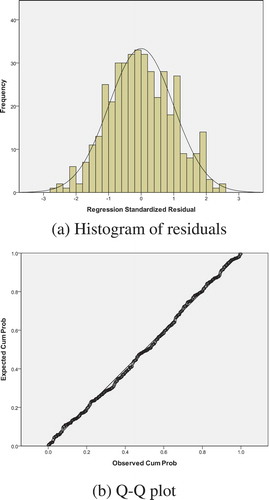
Table 5. Test of model normality.
4.2. Model validation
. represents a scatter plot of the predicted log-transformed damage ratio and the actual log-transformed damage ratio. The adjusted R-square of the model is 0.457, which indicates that the significant indicators can explain 45.7% of the variability in the damage ratio, the dependent variable. It also indicates that the remainder of the variability is explainable using currently unidentified variables.
Figure 3. Plot of predicted vs. actual damage ratio.
5. Discussion
In this research, we found a statistically significant model that can elucidate 45.7% of the variability in the relationship between the damage and the risk indicators. The significant indicators are field location, the risk level of tropical cyclone, structure type, total months of the construction period, number of total floors, and number of total underground levels.
Among the geographical vulnerability indicators, the field location has a positive association with damage, which denotes that a construction site in a large and crowded city is exposed to more risks than a construction site in a rural area. This outcome confirms the found the field location to be a significant indicator of damage and a valuable factor in estimating the damage at construction sites (Chan et al. Citation2011; Kuo and Lu Citation2013).
Among the natural hazard indicators, the risk level for a tropical cyclone is significantly related with damage. Thus, if the risk level increases, the damage and the importance of loss-prevention activities also increase. This result also supports studies (Akintoye and MacLeod Citation1997; Carr and Tah Citation2001; Chan et al. Citation2011; El-Sayegh Citation2008).
Among the project information factors, the structure type, which is a dummy variable, is statistically significant, and the positive relationship indicates that reinforced concrete construction sustains more damage than other construction types. This result supports the finding of a previous study that found that reinforced concrete construction has more latent exposure to hazards and accidents than other construction types (Gurcanli, Bilir, and Sevim Citation2015). The other indicators, i.e., total months of the construction period, number of total floors, and number of total underground levels, all have negative relationships with damage, which indicates that the size of a construction project affects the risk of damage. This result corroborates former research (Kim et al. Citation2015).
The represent that the summary of comparison results with previous studies. The results of this study were similar to those of previous studies, and the sign was the same.
Table 6. Comparison of results with previous studies.
This study used an insurance company’s payouts from construction site claims in South Korea to identify risk indicators and the correlation between risk indicators and economic damages was analyzed.
In this respect, this study provides a quantitative risk assessment method that predicts economic damage. As a result, this study can provide practically the important criteria for proper decision-making in order to manage and reduce losses in the assessment of economic risks of the construction site.
For example, as shown in , when project owners evaluate the risk of a construction site, risk indicators can be used to predict economic damage to a construction site. If these economic damages are within acceptable limits, then the project will proceed. If not, alternatives that can reduce or minimize economic damages should be established.
Figure 4. Economic risk assessment method.
In the future, it is required that the establishment of the database for reliable risk indicators and construction risk prediction models through continuous feedback of accumulated effects and data verification and development of a computerized system.
6. Conclusion
The frequency of damage at construction sites has recently increased, and the amount of damage has grown as well. Even though the demand for a damage estimation model has increased, quantitative research that discloses the relationship between damage and risk indicators has remained limited.
To fill that gap, we use an insurance company’s claim payouts from construction sites in South Korea to identify risk indicators and test their correlations with actual financial damage as an initial stage toward developing a construction damage assessment model. In our statistical analysis, we found six significant indicators that explain the damage ratio: field location, tropical cyclone risk, structure type, total months, number of floors, and number of underground levels. Those results will offer construction companies, project owners, and insurance companies a critical standard to manage and diminish losses when they assess the financial risks at construction sites. For example, companies that need to measure the potential economic loss risk in a particular building or group of buildings, such as insurance and reinsurance companies, could use this model. To measure potential risks, they will be able to reconstruct or create in-house models using the methodology used in this paper. They can certainly assess risk, make quick decisions, and use the resulting loss ratio as the default loss rate. They can also use the model to test and adjust the vendor models. It can be used as an imperative material to compare and judge the results based on their portfolio, business preference, and risk appetite.
Furthermore, utilizing the risk indicators and established the method in this research would be able to apply other countries which have a similar geographical vulnerability, natural hazards, and architectural environment with South Korea. Nevertheless, the data set used in this research is the damage data of one insurer in South Korea. Using different data from different countries may have different consequences due to the nature of the construction project being affected by various external factors. Hence, in order to support the results of this study, further studies are needed through the extraction of data from different countries and other data sets. Furthermore, the adjusted R2 value was 0.457 which means that the residual variability of the damage is clarified by some hidden indicators. Future research will need to define other potential indicators and add to the model to enhance the explanatory power of the model.
Correction Statement
This article has been republished with minor changes. These changes do not impact the academic content of the article.
Disclosure statement
No potential conflict of interest was reported by the authors.
Additional information
Funding
Notes on contributors
Ji-Myong Kim
Ji-Myong Kim got the Ph.D from Texas A&M University then he is working as a professor in Mokpo National University, Republic of Korea. His major area is construction management.
Taehui Kim
Taehui Kim got the Ph.D from Kyung-hee University, Republic of Korea. Then he is working as a professor in Mokpo National University, Republic of Korea. His major area is construction management.
Kiyoung Son
Kiyoung Son got the Ph.D from Texas A&M University then he is working as a professor in University of Ulsan, Republic of Korea. His major area is construction management.
Junseo Bae
Junseo Bae earned his Ph.D. from Texas A&M University. He is currently working as a lecturer (i.e., assistant professor) at the University of the West of Scotland, UK. His major area is construction management.
Seunghyun Son
Seunghyun Son is a Ph.D. student at Kyung Hee University in Korea, Republic of Korea. His major area is construction management.
Related Research Data
References
- Akintoye, A. S., and M. J. MacLeod. 1997. “Risk Analysis and Management in Construction.” International Journal of Project Management 15 (1): 31–38. doi:10.1016/S0263-7863(96)00035-X.
- Bing, L., A. Akintoye, P. J. Edwards, and C. Hardcastle. 2005. “The Allocation of Risk in PPP/PFI Construction Projects in the UK.” International Journal of Project Management 23 (1): 25–35. doi:10.1016/j.ijproman.2004.04.006.
- Carr, V., and J. Tah. 2001. “A Fuzzy Approach to Construction Project Risk Assessment and Analysis: Construction Project Risk Management System.” Advances in Engineering Software 32 (10): 847–857. doi:10.1016/S0965-9978(01)00036-9.
- Chan, D. W., A. P. Chan, P. T. Lam, J. F. Yeung, and J. H. Chan. 2011. “Risk Ranking and Analysis in Target Cost Contracts: Empirical Evidence from the Construction Industry.” International Journal of Project Management 29 (6): 751–763. doi:10.1016/j.ijproman.2010.08.003.
- Choi, -H.-H., and S. Mahadevan. 2008. “Construction Project Risk Assessment Using Existing Database and Project-specific Information.” Journal of Construction Engineering and Management 134 (11): 894–903. doi:10.1061/(ASCE)0733-9364(2008)134:11(894).
- Cutter, S. L., B. J. Boruff, and W. L. Shirley. 2003. “Social Vulnerability to Environmental Hazards.” Social Science Quarterly 84 (2): 242–261. doi:10.1111/ssqu.2003.84.issue-2.
- El-Sayegh, S. M. 2008. “Risk Assessment and Allocation in the UAE Construction Industry.” International Journal of Project Management 26 (4): 431–438. doi:10.1016/j.ijproman.2007.07.004.
- Emmett, J. V., and M. V. Therese. 1995. Essential of Insurance: A Risk Management Perspective, 43–78. NewYork: John Wiley & Sons.
- Gurcanli, G. E., S. Bilir, and M. Sevim. 2015. “Activity Based Risk Assessment and Safety Cost Estimation for Residential Building Construction Projects.” Safety Science 80: 1–12. doi:10.1016/j.ssci.2015.07.002.
- Highfield, W. E., W. G. Peacock, and S. Van Zandt. 2010. “Determinants & Characteristics of Damage in Single-Family Island Households from Hurricane Ike1.” The Association of Collegiate Schools of Planning Conference, Minneapolis.
- Hsueh, S.-L., Y.-H. Perng, M.-R. Yan, and J.-R. Lee. 2007. “On-line Multi-criterion Risk Assessment Model for Construction Joint Ventures in China.” Automation in Construction 16 (5): 607–619. doi:10.1016/j.autcon.2007.01.001.
- Insurance Statistical Monthbook [Internet]. ([2006] 2015). “Korea insurance development institute.” Accessed 27 july 2016. http://www.insis.or.kr
- Kim, C. H., L. S. Kang, and H. T. Park. 2010. “Development of a Risk Management Procedure Model for the Construction Project Using Construction Risk Management System.” Journal of Korean Society of Civil Engineers 30 (4): 423–432. July.
- Kim, J.-M., P. K. Woods, Y. J. Park, T. Kim, and K. Son. 2015. “Predicting Hurricane Wind Damage by Claim Payout Based on Hurricane Ike in Texas”, Geomatics, Natural Hazards and Risk, 7 (5):1513-1525. doi:10.1080/19475705.2015.1084540
- Korea Statistical Yearbook. ([2005] 2014) “Statistics Korea.” Accessed 17 july 2016. http://www.kostat.go.kr/
- Kuo, Y.-C., and S.-T. Lu. 2013. “Using Fuzzy Multiple Criteria Decision Making Approach to Enhance Risk Assessment for Metropolitan Construction Projects.” International Journal of Project Management 31 (4): 602–614. doi:10.1016/j.ijproman.2012.10.003.
- Ministry of Employment and Labor. 2015. 2006–2015year Analysis of State Industrial Accidents, 9–32. Sejong, Korea: Munjung. November. Chapter 2, Total of state industrial accidents.
- Nevada DOT. 2012. “Risk Management and Risk-based Cost Estimation Guidelines.” Nevada Department of Transport.