
 ?Mathematical formulae have been encoded as MathML and are displayed in this HTML version using MathJax in order to improve their display. Uncheck the box to turn MathJax off. This feature requires Javascript. Click on a formula to zoom.
ABSTRACT
There are many risks and uncertainties in plant construction projects, because of their complexity, difficulty in loss prediction and size of construction being large. The risk management of plant construction projects should not be relied solely on experiences and intuition of the contractors or the construction managers as it has been in the past. Therefore, a new quantitative and empirical risk analysis is required, in order for the development of a risk assessment using risk indicators for the plant construction projects. This research used the insurance payout record from a global insurance company to reflect the actual quantitative loss in the risk assessment model for plant construction project. The researchers adopted the geographic information as well as construction information (construction phase and commissioning phase, schedule rate, total duration), as the independent variables, which found to be statistically significant in the analysis in this study. It was found that the relationship between damage ratio and the valid variables was statistically significant, and thus, the damage model is also statistically significant. This research suggests that the regression model containing such valid independent variables could be beneficial in terms of providing foundational guidelines for the plant construction project risk analysis.
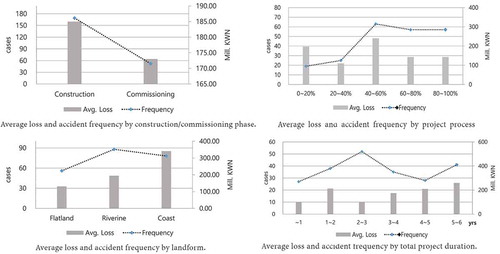
Graphical Abstract
1. Introduction
1.1. Background and objectives
The global low oil prices, which have continued in recent years, are on the reduction trend and plant orders have risen. According to the K-indicator index that provides Korean national statistical indicators, the domestic plant industry in 2017 was worth US $ 26.7 billion, and had increased 27.6% from the previous year. The plant construction industry holds much in common with general construction, in the sense that 1) production methods vary according to the project location and purpose, 2) it is difficult to judge the effective value of the investment, and 3) it demands high manpower. In addition, the plant construction industry also requires high-level designs and fabrication techniques as well as a variety of knowledge services. In addition, compared to general construction, brand-name reputation also has an impact on plant construction, and integrated management affects not only the construction schedule but also the success or failure of the business. Also, plant construction has any differences from the general construction; the equipment supplier interface directly or indirectly affects the design and construction, since the equipment is produced in special order according to the project, compared with the general construction using the standardized parts. Due to such distinctive features, the plant construction business holds a relatively high risk.
The purpose of the risk analysis is to improve understanding of the nature of the risk and to obtain more information on the outcome and feasibility. In the “Guidelines for Risk Analysis Method” of the Korea Occupational Safety and Health Administration, the decision on the risk priorities should be based on actual analysis of the information and data, rather analysis by speculation. Prioritizing the risks and their causes must be specified based on scientific methods, as opposed to the superficial causes of problems, in order to establish the appropriate and practical countermeasures. The International Organization for Standardization has redefined ISO 31000 (Risk Management – Principles and Guidelines, Citation2009) the concept of risk and risk analysis, i.e., risk was commented as the effect of uncertainty on its objectives, and risk analysis as materializing the uncertainties about future goals into predictions in a scientific way as precisely as possible. Although many companies have individually established and applied their own risk assessment methods and countermeasures to meet their specific need, the evaluation methods that can be applied practically are still not sufficient. Hence, the risk analysis based on quantitative grounds are necessary.
This study aims to 1) analyze the cause of accidents as per the specific aspects of different plant construction projects (construction/commissioning, schedule, landform and total duration) based on the actual plant construction damage compensation insurance data, and to 2) develop a loss predictive regression model in order to understand the quantified management factors of plant construction risks.
1.2. Research scope and methodology
This research studies the risk management factors and loss prediction model in the plant constructions by analyzing the causes and results of the accidents, and quantitative loss data. The scope of risk management was limited to the construction/commissioning phase in the entire plant project process, which includes the phases of bidding and contracting, design, procurement, construction and commissioning, as the construction/commissioning phase is the only phase that pertains to the risk management of actual, physical accidents. To identify the objective loss index of the risk, the researchers adopted the data of the insurance payout for the accidents happening in the plant construction projects, limiting the payout data as more than 50 billion KWN, and from 2001 to 2016. More specifically, the authors used the information on the collected accidents and their corresponding loss insurance payout to classify the causes of accidents according to the construction/pre-commissioning, process rate, landform and total duration of the plant construction project. This information was also used to measure the severity of the risk by using the frequency and amount of payout of each accident. Also, a loss prediction model with above plant project information factors as independent variables was suggested through a regression analysis.
2. Literature review
The purpose of risks analysis is to identify appropriate and effective strategies to manage the risk by confronting, avoiding or reducing them. However, even though cost and schedule in construction projects have received much attention, risk analysis has rather lagged behind in the literature. Especially, for long, the traditional risk analysis methodology in construction projects has remained in the realm of qualitative analysis, while quantitative risk analysis methodologies can provide more sophisticated techniques and accurate measurement to examine and analyze the risks, mathematically as well as statistically. Applying quantitative risk analysis methodologies enables modelling construction projects by quantifying the risk factors, their actual occurrence and the impact. In spite that many preceding studies involving risk analyses has mainly been conducted from the qualitative perspective, many recent studies adopted quantitative methodology in their analyses.
The construction industry is often considered highly risky, because of its complexity and nature, as it involves lots of stakeholders, a long period of time, and huge cost scale. Such technological and strategic complexity causes the risks based on the uncertainty (Zou, Zhang, and Wang Citation2007). Although all aspects of the risk management and analysis process have received much attention from many researchers, risk assessment still remains a controversial issue (Baloi and Price Citation2003). That is, the construction and plant industry has received a poor reputation for risk assessment despite being high-risk industries when compared with other industries, such as insurance or finance. (Laryea Citation2008). Baker, Ponniah, and Smith (Citation1998) surveyed construction and oil companies to analyze effective qualitative and quantitative risk assessment techniques. The researchers found that personal experiences and professional engineering judgement is the most frequently used qualitative techniques. Wood and Ellis (Citation2003) also show that personal experiences and judgement are the main risk assessment factors and risk management is commonly performed with simple means such as checklists and surveys. Similarly, Dikmen, Birgonul, and Erdem Arikan (Citation2004) found that personal experiences and judgement were prevailing quantitative risk analysis tools. Dikmen, Birgonul, and Han (Citation2007) found that the qualitative methods for risk assessment were used more frequently than quantitative methods in construction risk assessment research and subsequently asserted that the subjective assessment factors, such as personal experiences, knowledge and intuitive decision should be systemized to apply quantitative risk assessment.
The quantitative analysis provides realistic and numerical values and these offer a better understanding and decision-making. (Khan, Rathnayaka, and Ahmed Citation2015). Warszawski and Sacks (Citation2004) found that the sensitivity analysis was the most frequently used technique for risk analysis in construction projects. They argued that advanced and refined methods ware not generally adopted, owing to the fact that the construction projects are mostly one-off enterprises and required input information are not sufficient. Risk cost has been considered the most common scale in risk analysis and various studies used the risk cost as a risk impact measurement scale (Ben-David and Raz Citation2001; Fan and Yuan-Chang Citation2004; Molenaar Citation2005; Cagno, Caron, and Mancini Citation2007; Cioffi and Khamooshi Citation2009). Despite the fact that many researchers have conducted the risk analysis for different project goals, they rarely used actual risk cost. Therefore, the use of risk cost as an assessment scale would seem to improve the accuracy and validity of the risk analysis. Fuzzy Set Theory (FST) has been proposed by Tah and Carr (Citation2001) and Hsiau and Chun Wei (Citation2009) to analyze construction risk management. Tah and Carr (Citation2001) focused on quantitative risk analysis while using data based on objective probabilities in the construction industry. They used the Fuzzy set theory analysing risk and suggesting project risk rating. Hsiu and Lin (Citation2009) have proposed an extended fuzzy PERT (Project Evaluation and Review Technique) approach to determine the earliest start time of plant construction project and developed a Project Scheduling Risk Index (PSRI) to assess the project scheduling risk for the decision-makers. These fuzzy sets are derived from the opinion by the agreement of several experts. Heravi and Gholami (Citation2018) used sensitivity analysis to measure the impact of organizational learning and risk management maturity in plant construction projects. However, These Fussy set and sensitivity analysis still depends on expert opinions which could also be rather conceptual or abstract than concrete and generalizable. Jun and Haiyan (Citation2010) utilized value mining theory in evaluating potential revenues and risks for construction projects in the phases of feasibility research. The study proposed an optimization among many schemes for construction project feasibility studies, which incorporates multi-target fuzzy decision-making principles and satisfaction degree of value mining. Rezakhani (Citation2011) described a fuzzy risk analysis model development in order to assess the risks in construction projects and concluded that the model indicated a systematic and effective way for risk analysis. However, the researchers of this study did admit, the model included some disadvantages. That is, the computations in fuzzy risk analysis model could be rather tedious, if performed manually. Thaheem, De Marco, and Barlish (Citation2012) presented a review of 16 quantitative risk analysis techniques for construction project risk analysis and asserted that there is need for simplifying the techniques and that three techniques including interviewing, probability distributions and EMV techniques are intermediary for their possible complexity or construction management professionals’ lack of knowledge of techniques. This paper also highlighted the need for creating the new techniques, by improving the understanding and usability of various quantitative analysis methods. More recently, An quantitative risk assessment methodology for construction project suggested a risk quantification methodology for construction project and presented how it should be applied to an industrial construction project (Gupta and Thakkar Citation2018). In this research, a case study was conducted integrating an approach to hierarchize the risks using Group Technique for Order Preference by Similarity to Ideal Solution (GTOPSIS) and to quantify the risks in relation to the construction project delays using Judgemental Risk Analysis Process (JRAP), and Monte Carlo Simulation (MCS). This study concluded that JRAP and MCS are more effective in managing and controlling project risks and that the risks are heavily determined by the project schedule; thus concluded that the suggested methodology provides a better risk priority list as it quantifies the risks. Keshk, Maarouf, and Annany (Citation2018) dealt with a variety of risks that should be taken into consideration in management of construction project in quantitative and qualitative analysis. Among their findings, more pertinent is that strategies of responding to the risks depend on quantification of their types and sizes, and that the no strategy can be suitable to confront all the risks.
As shown above, even though various studies have used different analytical methods to derive the factors of plant construction risk management and quantitatively interpret qualitative data, it is difficult to exclude subjective probabilities from the underlying qualitative data such as opinions of experts. Therefore, quantitative assessment for plant construction risk assessment is needed to validate risk factors and predictive models through quantified databases such as risk cost.
3. Insurance payout data
3.1. Data collection
In this study, a total of 221 cases including accidents and insurance compensation information about the loss at the actual plant construction project site were collected from an “A” insurance company for quantitative analysis.
The construction insurance covers mainly material damage, human accident and third-party damage. The scope of data is limited to insurance payout for material damage at the site from 2001 to 2016.
3.2. Causes of damage
The types of the accident that cause the damage and loss in the plant construction project were selected from the liquidated damage clauses in contracts and divided into management factors and natural disaster factors.
As shown in , the management factors are 1) worker’s carelessness, 2) construction defect, 3) mechanical defect 4) fire and explosion, 5) electrical accident, 6) stolen and natural disaster factors involve 7) Typhoon 8) flood, 9) heavy rain, 10) heavy snow, 11) cold wave and 12) et cetera. shows the frequency of accidents and the sum of claim payments for the causes of accidents in domestic and overseas plant construction projects.
Table 1. Causes of loss in plant construction projects.
Table 2. Frequency of accidents and the claim payments.
In the case of accident frequency, mechanical defect, worker’s carelessness, construction defect, fire & explosion were the most frequent causes of damage in the plant construction sites. The average of claim payments was highest in order of flood, fire and explosion, mechanical defect. Based on the total amount of payment, the amount of payment was highest in the order of mechanical defect, fire and explosion and construction defect.
4. Plant construction risk
4.1. Construction/commissioning
The plant construction process can be divided into the construction phases required by the drawing and specification for the structures and the mechanical equipment, and the commissioning phases to test whether the equipment and facilities are operating normally. “Commissioning” refers to a series of verification processes in plant construction projects carried out in order to confirm whether a facility has been designed, procured, fabricated, installed, tested and prepared for normal operation in accordance with the design drawings and specifications. Compared to general construction work, plant construction cost is low in the construction phase, but it is very risky in the commissioning phases. Due to the various defects and mistakes made during commissioning, additional equipment expenses and compensation by payments are often required.
Figure 1. Average loss and accident frequency by construction/commissioning phase.
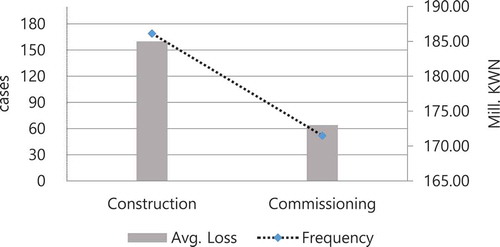
Using the data collected in this study, the frequency of accidents during construction and commissioning phases was 77.0% in construction and 23.0% in commissioning, and the total payouts and average payouts from insurance company in the construction phase was higher than the commissioning phase ().
In the construction phase, 46 cases (20.8%) out of 221 cases were mechanical defects and 36 (16.2%) construction defects, and 32 (14.4%) worker’s carelessness. In terms of insurance payout, mechanical defects amounted to 22.8% (9,187 Mill. KNW) out of a total amount of collected insurance payout data set (40,309 Mill. KWN), fire & explosion 13.7% and construction defects 11.3%, respectively. The frequency of damage caused by natural disaster, Typhoon, was 5.9% (13 cases) and insurance payments was 5.9% (3,044 Mill. KWN) based on the total amount of insurance payments.
In the commissioning phase, the accident frequency was estimated in the order of 15 worker’s carelessness (6.8%), 13 mechanical defects (5.9%) and 10 construction defects (4.5%) out of 221 cases. Insurance payouts broke down to 8.4% (3,388 Mill. KWN) mechanical defects, 4.4% (1,757Mill. KWN) worker’s carelessness, and 3.7% (1,486 Mill. KWN) construction defects. In the commissioning process, losses due to natural disasters were less than 1.0%.
4.2. Process rate
The collected data were classified into five sections with a process rate of 20%, which was compared with the frequency of accidents and the average compensation amount.
Figure 2. Average loss and accident frequency by project process rate.
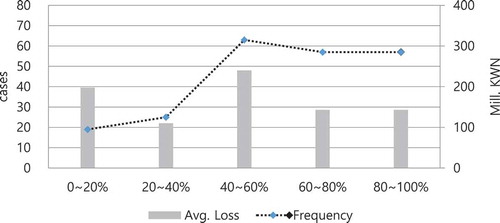
As shown in , the order of accident frequency was reckon to be as following: 40 ~ 60% section (63 cases, 28.5%), 60-80% section (57 cases, 25.8%), 80–100 (7 cases, 25.8%). Each accumulated process rate sections are described in below;
In the section between 40-60%, mechanical defects had the highest frequency (21cases, 9.5%) followed by worker’s carelessness (11 cases, 5.0%), and construction defects (10 cases, 4.5%). Insurance payouts broke down to 16.7% (6,728 Mill. KWN) mechanical defects and 6.1% (2,473 Mill. KWN), fire & explosion. Loss frequency by natural disasters were heavy rain (6casses, 4.1%) and flood (5cases, 2.3%). Among the insurance payout, there were 4.3% (1,731 Mill. KWN) of flood and 4.0% (1,604 Mill. KWN) of Typhoon.
In the section between 60-80%, same as the above section, worker’s carelessness had the highest frequency (15cases, 6.8%) followed by mechanical defects (14 cases, 6.3%), and construction defects (12 cases, 5.4%). Insurance payouts broke down to 7.1% (2,845 Mill. KWN), 4.7% (1,887 Mill. KWN) and 4.1% (1,648 Mill. KWN) respectively.
In the section between 80-100%, the order of accident frequency was determined to be as follows: 15 worker’s carelessness (6.8%) 14 construction defects (6.3%) and 12 mechanical defects (5.4%). In terms of insurance payouts, mechanical defects amounted to 7.4% (2,966 Mill. KWN), worker’s carelessness 4.0% (1,621 Mill. KWN), and construction defects 3.5% (1,425 Mill. KWN), respectively. As the rate of process increases, compared to the initial stage of the process rate, frequency and average insurance payments by the management factors such as mechanical defects, construction defects was high. The frequency of natural disasters such as typhoons, floods and heavy rainfall were very low compared with management factors of accident causes throughout the whole process.
4.3. Site location
The project site location of collected data was classified into three areas; flat area, riverine area and coastal area.
Figure 3. Average loss and accident frequency by landform.
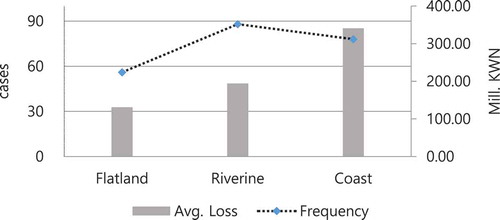
Based on site location criteria, the order of accident frequency was determined to be as following: coastal area, riverine area and flat area ().
In the coastal area, the most frequent case was mechanical defects, as well as construction defects, each of which took up 21 cases (9.5%) out of 221 cases, followed by 11 cases (4.9%) worker’s carelessness. The insurance payouts broke down to 43.9% (17,728 Mill. KWN) mechanical defects, 6.9% (2,453 Mill. KWN) fire & explosion and 5.3% (2,115 Mill. KWN) construction defects.
In the riverine area, the accident frequency was estimated in the order of 25 mechanical defects (11.3%), 21 worker’s carelessness (9.5%) and 19 construction defects (8.6%). Among the insurance payouts, there were 9.9% (3,998 Mill. KWN) of worker’s carelessness, 8.5% (3,416 Mill. KWN) of fire & explosion and 7.4% (2,986 Mill. KWN) of construction defects
In the flat area, worker’s carelessness had the highest frequency (15 cases, 6.8%) followed by mechanical defects (13 cases, 5.9%) and electrical accidents (7 cases, 3.2%). In terms of insurance payouts, mechanical defects amounted to 6.9% (2,794 Mill. KWN), Typhoon 4.7% (1,896 Mill. KWN) and construction defects 2.4% (967 Mill. KWN), respectively.
4.4. Total duration
Total period of plant construction project is divided into six categories by the year.
Figure 4. Average loss and accident frequency by total project duration.
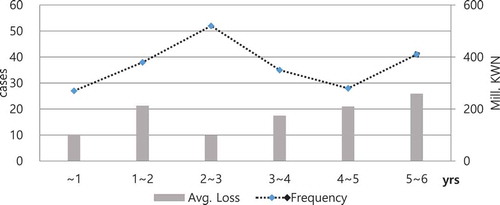
The main causes of accidents in 3 ~ 4, 4 ~ 5, 5 ~ 6 years project sections which have a high amount of insurance payments was mechanical defect as 3.1% (7cases), 5.0% (11cases), 8.1% (18 cases), respectively ().
In the section between 3 and 4 years, construction defects had the highest frequency (11 cases, 5.0%) followed by mechanical defects (6cases, 3.1%) and worker’s carelessness (5 cases, 2.2%). Insurance payouts broke down to 11.6% (4,669 Mill. KWN) mechanical defects, 6.1% (2,459 Mill. KWN), fire & explosion and 3.1% (1,259 Mill. KWN) construction defects.
In the section between 4 and 5 years, mechanical defects had the highest frequency (11 cases, 5.0%) followed by worker’s carelessness (6 cases, 3.1%). Among the insurance payouts, there were 3.0% (1,210 Mill. KWN) of mechanical defects and 1.14% (457 Mill. KWN) of construction defects
In the section between 5 and 6 years, mechanical defects had the highest frequency (18 cases, 8.1%) followed by worker’s carelessness (9 cases, 4.1%), and construction defects (7 cases, 3.2%). Insurance payouts broke down to 11.82% (4,766 Mill. KWN) mechanical defects, 6.0% (2,407 Mill. KWN) typhoon and 4.2% (1,704 Mill. KWN) flood.
5. Regression analysis
The regression model proposed in this study is to present quantitative grounds through the model for predicting the appropriate insurance payment for the objective damage compensation of the plant construction project. The regression model equation to be tested in this study is as follows.
5.1. Regression model and dependent variable
where, LR: Loss Ratio
CC: Construction/Commissioning
PR: Process Rate
LF: Landform
TD: Total Duration
The dependent variable representing the quantitative loss in the regression model is expressed as the ratio of the compensation amount to the total construction as shown in equation (2), which is referred to as the loss ratio.
5.2. Normality
As this study focuses on providing statistical evidence, the normality was tested by a histogram, Q-Q plot (), Shapiro–Wilk test (). The dependent variable, loss ratio values, is biased to the left. Hence, the log transformation was used to make data conform to normality as in Equation (3).
Table 3. Normality test of dependent value.
Log transformed loss ratio’s normal distribution is checked whether the distribution has a bell shape, lies on a straight diagonal line (). SW normality test also offers a clear evidence of normal distribution (). If p-value is higher than 0.05, the null hypothesis that the data is a distributed normally fails to be rejected. That is, the result can be interpreted that the data is normally distributed.
Figure 5. Normal Q-Q plot and histogram for dependent value.
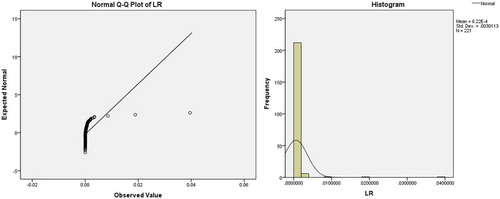
Figure 6. Normal Q-Q plot and histogram for transformed dependent value.
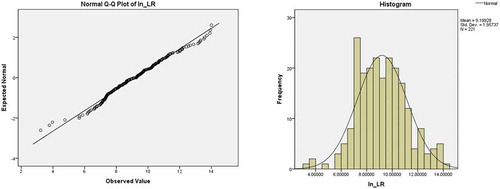
Table 4. Normality test of transformed-dependent value.
5.3. Independent variables
Plant construction projects require a higher risk management at the commissioning phase compared to general construction projects.
In this regard, existing studies have asserted that commissioning phases in plant construction projects are crucial, albeit its tendency to be somewhat temporary. In addition, the studies have indicated an urgent need for systemized risk management on commissioning phases. Existing studies on a risk-damage function have considered location as an element of analysis. Ryu, Son, and Kim (Citation2016), for example, included the site location such as suburban, urban, metropolitan, etc. This study also used the site location as an element of analysis and included a classification such as coastal, riverine and flat area; distance from coastal (Kim, Citation2019) and riverine are considered as key factors in the building vulnerability model due to natural disasters. In this study, to identify each land type, address zip code data, which was retrieved from the insurance record, was used. In risk analysis modeling, cost and duration risk have been considered as key influential factors in project risks and adopted in much of the research. In particular, studies on cost and duration risk highlighted the importance of the factors approaching the issue qualitatively, and yet advocated for quantitative approaches.
indicates the criteria of independent variables in detail. The regression model in this research identifies, as its independent variables, 1) geographical factor: landform and 2) project information (process rate, total duration, construction and commissioning phases). On the premise from the earlier chapter that as a unit of independent value, loss ratio increases based on analysis of accident frequency and claim payout, this research verifies that particular independent variables are influencing loss ratio.
Table 5. Criteria of independent variables.
5.4. Result
The regression model was analyzed by four independent variables using construction/commissioning phase, schedule rate, landform and total construction duration. and show the ANOVA test and coefficients of the regression model. The p-value of F test for the regression model was less than 0.05. Also, it could be seen that there is no problem of multicollinearity through the Variance Inflation Factor (VIF) values range from 1.096 to 1.314. The Adjusted R2 value is 0.266 and this regression model has an explanatory power of 26.6%. The R2 value could be increased by adding different valid factors such as the five independent variables suggested in this study.
Table 6. ANOVA and adjusted R square.
Table 7. Coefficients in the model.
The predicted loss model can be estimated from the regression coefficients derived from this regression analysis. The model is shown in the following equation (4).
where, LR: Loss ratio
CC: Construction/Commissioning
PR: Process Rate
LF: Landform
TD: Total Duration
According to the loss prediction model, when the independent variable construction/commissioning value is changed in units of ‘1ʹ, the variation rate of the dependent variable ‘0.705ʹ is obtained.
In other words, it can be predicted that the construction phase has a higher loss rate than the commissioning phase. When the cumulative process rate is changed by ‘1ʹ unit, it affects the loss ratio ‘0.260ʹ. The effect of ‘0.411ʹ on the loss rate of the dependent variable depending on the change of units of flat land (1), riverine area (2), and coastal area (3). The ‘1ʹ unit increase in the total construction period affects the negative value of ‘−0.164ʹ. That is, the longer the total project duration, the lower the loss rate can be interpreted. The effect of construction/commissioning is the most influential independent variable on the dependent variable through the standardized regression coefficient and followed by the landform, process rate and total construction duration.
6. Discussion and conclusion
As the demand for plant construction projects and the complexity of those projects increase, a quantitative risk assessment model is required to decrease financial damage on risks and unpredictable losses. In this study, authors collected actual insurance payment data of an insurance company for quantitative risk analysis. The insurance payouts by material damage were targeted for the damage loss of the plant construction projects from 2001 to 2016. The causes of the accident were classified into 12 categories according to the construction contract insurance policy and actual accident records. As a result of analysis of the cause of the accident, it was confirmed that the loss of the plant construction is focused on the worker’s carelessness, construction defects and mechanical defects which are more administrative factors than loss caused by natural disasters. For the quantitative risk analysis, multiple regression analysis was performed. The loss ratio was used as a dependent variable and the construction/commissioning phase, topography, process rate and total construction period were used as independent variables to develop the plant construction risk assessment model.
Regression analysis showed a loss prediction model with explanatory power of 26.6% and suggested independent variables are statistically significant. Through this study, it is possible to establish an appropriate risk countermeasure reflecting the distinctive characteristics of project. This study could be used as a fundamental guideline for decision-making and prediction of financial loss in plant construction project.
This research adopted a record of insurance claim payouts and project information aiming to analyze the plant construction risks and to assess the losses caused by the risks. The relationship between loss ratio and the valid variables has been verified as statistically significant; therefore, this research concludes that the loss assessment model is in turn statistically significant. Such findings have contributions to many relevant sectors, including construction companies, insurance/reinsurance companies, other risk assessment agencies alike. The risk assessment model suggested in this study can be adopted in predicting potential economic loss in insurance and reinsurance companies. In other words, the loss assessment model can provide insurance/reinsurance companies with an alternative option in estimating the maximum loss of an individual plant construction project, setting an event limit, and more importantly, in estimating the appropriate premium. In insurance business dealing with plan constructions, premiums composed of specific risks, uncertain risks, administrative prices and plant construction risks. Deciding a proper premium depends on the estimation on the amount of loss by project characteristics or natural disasters, estimation of the maximum amount of loss incurred from the insurance policy currently in operation and for the accumulative risk management of the plant construction project. The loss assessment model suggested in this study contributes to arriving at a more informed and better considered decision. Plant construction companies can also benefit from the findings of this study, especially through the analysis of accident causes and of the loss based on project process stage, in terms of improving their design and management guidelines. If risks of plant construction projects are quantified and proportioned, it helps managing, responding to and ultimately reducing the potential loss. And thus, the framework and the findings of this study will be able to contribute to improving plan construction companies’ judgment in risk management. This study is novel as it provides an additional possibility in risk analysis, as it provides realistic and quantified values; these in turn can also contributes to more timely efficient and more informed decision-making. Risk cost is regarded as the most common scale in risk analysis; many studies have also used the risk cost. For this reason, the use of the actual record of the cost, such as insurance claim payout in the assessment will not only advance the accuracy and validity of the analysis and decision-making, but will also provide more insight in to the realm of plant construction as well as the insurance industry.
Although the trustworthiness was tried to obtain by utilizing the data collected for a long period of time, over a decade from a major insurance company, it is admissible that the data were collected from one single source and that it leaves a room for improvement. Therefore, if the data included more than one sources, for example, payout records from several insurance companies and records from not only insurance companies but also damage assessment agencies, the argument and its reliability of this paper could have been more robust. For this reason, in future studies, the results need to be verified with data obtained from more various sources.
Acknowledgments
This research was supported by a grant (NRF-2019R1A2C1009398) from the National Research Foundation of Korea by Ministry of Science, ICT and Future Planning.
Disclosure statement
No potential conflict of interest was reported by the authors.
Additional information
Funding
Notes on contributors
Ji-Myong Kim
Ji-Myong Kim is an assistant professor in the Department of Architectural Engineering, Mokpo National University. His research is focused on prevention of natural disasters, construction & insurance risk. He received his M.Sc in Civil Engineering from University of Florida in 2010 and PhD in construction science from Texas A&M University in 2013.
Taehui Kim
Taehui Kim is a professor in the Department of Architectural Engineering, Mokpo National University. He has been an associate editor for Journal of Korea Institute of Building Construction. His research interests include life cycle cost, maintenance performance evaluation, construction safety etc. Prof. Kim hold a number of patents for building life cycle cost’s estimate system and constructing on integrated database.
Junseo Bae
Junseo Bae is a Lecturer (Assistant Professor) in Construction Management at the University of the West of Scotland (UWS), UK. He is currently the Program Leader (Interim) for MSc Construction Management with Digital Engineering and a key member of Construction Innovation and Built Environment Research (CIBER) Group at UWS. His research is focused on big-data-driven decision-support modelling for streamlined construction planning, operation and management. His research attempts to address the unique spectrum of challenges and issues facing councils, local authorities, public sector, affected communities and business enterprises.
Kiyoung Son
Kiyoung Son is an assistant professor in the school of Architectural Engineering, University of Ulsan. His research is focused on prevention of disasters, sustainable construction and construction safety. He received his M.Sc in architectural engineering from Kyunghee University in 2007 and PhD in construction science from Texas A&M University in 2012.
Sungjin Ahn
Sungjin Ahn is a lecturer in in the Department of Architectural Engineering, Mokpo National University. His research focuses on Studies on Building Information Modeling, construction safety and construction risk management. He received Master of science and Ph.D in Civil Engineering from University of Florida in 2011 and 2016.
References
- Baker, S., D. Ponniah, and S. Smith. 1998. “Techniques for the Analysis of Risks in Major Projects.” Journal of the Operational Research Society 49 (6): 567–572. doi:10.1057/palgrave.jors.2600548.
- Baloi, D., and A. D. F. Price. 2003. “Modelling Global Risk Factors Affecting Construction Cost Performance.” International Journal of Project Management 21 (4): 261–269. doi:10.1016/S0263-7863(02)00017-0.
- Ben-David, I., and T. Raz. 2001. “An Integrated Approach for Risk Response Development in Project Planning.” Journal of the Operational Research Society 52 (1): 14–25. doi:10.1057/palgrave.jors.2601029.
- Cagno, E., F. Caron, and M. Mancini. 2007. “A Multi-dimensional Analysis of Major Risks in Complex Projects.” Risk Management 9 (1): 1–18. doi:10.1057/palgrave.rm.8250014.
- Cioffi, D. F., and H. Khamooshi. 2009. “A Practical Method of Determining Project Risk Contingency Budgets.” Journal of the Operational Research Society 60 (4): 565–571. doi:10.1057/palgrave.jors.2602586.
- Dikmen, I. M., T. Birgonul, and A. Erdem Arikan. 2004. “A Critical Review of Risk Management Support Tools.” In 20th annual conference of association of researchers in construction management (ARCOM), Heriot Watt Univ., Edinburgh, UK, 1145–1154. http://www.arcom.ac.uk/-docs/proceedings/ar2004-1145-1154_Dikmen_Birgonul_and_Arikan.pdf
- Dikmen, I. M., T. Birgonul, and S. Han. 2007. “Using Fuzzy Risk Assessment to Rate Cost Overrun Risk in International Construction Projects.” International Journal of Project Management 25 (5): 494–505. doi:10.1016/j.ijproman.2006.12.002.
- Fan, C.-F., and Y. Yuan-Chang. 2004. “BBN-based Software Project Risk Management.” Journal of Systems and Software 73 (2): 193–203. doi:10.1016/j.jss.2003.12.032.
- Gupta, V. K., and J. J. Thakkar. 2018. “A Quantitative Risk Assessment Methodology for Construction Project.” Sādhanā 43 (7): 116. doi:10.1007/s12046-018-0846-6.
- Heravi, G., and A. Gholami. 2018. “The Influence of Project Risk Management Maturity and Organizational Learning on the Success of Power Plant Construction Projects.” Project Management Journal 49 (5): 22–37. doi:10.1177/8756972818786661.
- Hsiau, H. J., and Lin,C, W, R. 2009. “A Fuzzy Pert Approach to Evaluate Plant Construction Project Scheduling Risk under Uncertain Resources Capacity.” Journal of Industrial Engineering and Management 2 (1): 31–47. doi:10.3926/jiem.v2n1.p31-47.
- ISO3100, 2009. Risk Management – Principles and Guidelines.Geneva: ISO. https://scholar.google.com/scholar?q=ISO3100,%202009.%20Risk%20Management%20%20Principles%20and%20Guidelines.%20Geneva:%20ISO.
- Jun, G., and W. Haiyan. 2010. “Quantitative Risk Analysis Approach on Construction Project Feasibility Research.” In 2010 international conference on E-Business and E-Government, 2749–2752. Guangzhou, China: IEEE.
- Keshk, A. M., I. Maarouf, and Y. Annany. 2018. “Special Studies in Management of Construction Project Risks, Risk Concept, Plan Building, Risk Quantitative and Qualitative Analysis, Risk Response Strategies.” Alexandria Engineering Journal 57 (4): 3179–3187. doi:10.1016/j.aej.2017.12.003.
- Khan, F., S. Rathnayaka, and S. Ahmed. 2015. “Methods and Models in Process Safety and Risk Management: Past, Present and Future.” Process Safety and Environmental Protection 98: 116–147. doi:10.1016/j.psep.2015.07.005.
- Kim, J. M., T. Kim, K. Son, S. G., Yum, and S. Ahn. 2019. “Measuring Vulnerability of Typhoon in Residential Facilities: Focusing on Typhoon Maemi in South Korea.” 11(10), 2768. doi:10.3390/su11102768.
- Laryea, S. 2008. “Risk Pricing Practices in Finance, Insurance and Construction.” Paper presented at the COBRA 2008 The construction and building research conference of the Royal Institution of Chartered Surveyors, Dublin Institute of Technology, September 4–5. http://centaur.reading.ac.uk/16292/
- Molenaar, K. R. 2005. “Programmatic Cost Risk Analysis for Highway Megaprojects.” Journal of Construction Engineering and Management 131 (3): 343–353. doi:10.1061/(ASCE)0733-9364(2005)131:3(343).
- Rezakhani, P. 2011. “Fuzzy Risk Analysis Model for Construction Projects.” International Journal of Civil & Structural Engineering 2 (2): 516–531. http://www.indianjournals.com/ijor.aspx?target=ijor:ijcse&volume=2&issue=2&article=010
- Ryu, H., K. Son, and J.-M. Kim. 2016. “Loss Prediction Model for Building Construction Projects Using Insurance Claim Payout.” Journal of Asian Architecture and Building Engineering 15 (3): 441–446. doi:10.3130/jaabe.15.441.
- Tah, J. H. M., and V. Carr. 2001. “Knowledge-based Approach to Construction Project Risk Management.” Journal of Computing in Civil Engineering 15 (3): 170–177. doi:10.1061/(ASCE)0887-3801(2001)15:3(170).
- Thaheem, M. J., A. De Marco, and K. Barlish. 2012. “A Review of Quantitative Analysis Techniques for Construction Project Risk Management.” In Proceedings of the creative construct conference, Budapest, Hungary, 656–667.
- Warszawski, A., and R. Sacks. 2004. “Practical Multifactor Approach to Evaluating Risk of Investment in Engineering Projects.” Journal of Construction Engineering and Management 130 (3): 357–367. doi:10.1061/(ASCE)0733-9364(2004)130:3(357).
- Wood, G. D., and R. C. T. Ellis. 2003. “Risk Management Practices of Leading UK Cost Consultants.” Engineering, Construction and Architectural Management 10 (4): 254–262. doi:10.1108/09699980310489960.
- Zou, P. X. W., G. Zhang, and J. Wang. 2007. “Understanding the Key Risks in Construction Projects in China.” International Journal of Project Management 25 (6): 601–614. doi:10.1016/j.ijproman.2007.03.001.