
ABSTRACT
Worker productivity is a major concern for the construction industry. Many studies assessed the effect of various factors, such as the work environment and worker health, on productivity. Nevertheless, the extent to which an automatic productive assessment can benefit from wearable electronic-based sensor technologies for physiological and psychological tracking purposes has not yet been fully investigated. This work assesses the ability of capturing the effect of construction workers’ happiness on their productivity using physiological signals collected via wearable sensors. Data from both a traditional tracking process (human annotators) and an automated worker physiological signal tracking process that was designed for the purposes of this study were compiled. By considering the traditional tracking process as the baseline for the comparison, this study evaluated the effectiveness of automating happiness tracking as a leading indicator of construction workers’ productivity. The physiological signal data collected included blood volume pulse (BVP), respiration rate (RR), heart rate (HR), galvanic skin response (GSR), and skin temperature (TEMP). These data were obtained from a 4-day field study conducted at a pre-fabricated stone construction factory. The study concluded that a moderate positive correlation exists between a worker’s emotional status and his productivity exists, with a p-value = 5.5 × 10⁻⁸ and a Pearson’s coefficient of 0.43.
1. Introduction
The financial development and strategic growth of many developed countries rely heavily on the construction industry. For illustration, in 2014, the construction sector accounted for 6.5% of Britain’s gross domestic product (GDP); specifically, this industry contributed £103 billion to the GDP (Infrastructure and Project Authority Citation2016). Additionally, the construction sector covered 11.4% of the UAE’s GDP in 2011 (Schilirò Citation2013). Labor and workers are the blood and veins of this business (Ailabouni, Painting, and Ashton Citation2009); therefore, workers’ productivity, expertise, and efficiency profoundly influence construction projects (Jang et al. Citation2011). The problem is that compared with other industries, the construction industry has one of the lowest labor productivities, and on top of that, it keeps steadily dropping (Jang et al. Citation2011). Thus, improving labor productivity should have a massive favorable effect on this sector. For instance, a 10% rise in construction worker productivity can return approximately £1 billion to Britain annually (Jarkas and Bitar Citation2012). Unfortunately, increasing construction labor productivity is a true challenge given the vast number of factors affecting it (Jarkas and Bitar Citation2012; Ministry of Economy Citation2016). The investigation and exploration of those factors and methods to boost construction labor productivity can definitely facilitate favorable outcomes regarding the construction industry in particular and the economic growth of countries in general (Ailabouni, Painting, and Ashton Citation2009). Therefore, many research studies have attempted to find the various factors that affect construction labor productivity (Jarkas and Bitar Citation2012; Abdul Kadir et al. Citation2005; Hickson and Ellis Citation2014). With a close inspection of these studies, we found that the majority (if not all) list the procedural aspects of the projects or the execution aspects, such as absenteeism, skills and experience, lack of finances, inspection delay, and incomplete drawings, as the main contributing factors (as described in Porntepkasemsant and Charoenpornpattana) (Porntepkasemsant and Charoenpornpattana Citation2015). Apart from these factors, the emotional health of the worker is an important contributor to the productivity of the worker (Hwang et al. Citation2018). Most of the influencing factors such as health of the worker, job satisfaction, motivation together characterizes the emotion of a person. These factors create a positive psychological and physiological environment which in turn improves the productivity of the worker (Martin Citation2008). Despite the importance of these factors, these authors argue that those studies unintentionally ignored the role of the worker’s emotional and psychological well-being in his efficiency and productivity.
Table 1. Subjects’ socio-demographic data.
Table 2. Informal break and work task ratios.
Table 3. Data collection method for variables used in this study.
Table 4. Sample of the data used for conducting the multilinear regression analysis.
Table 5. Regression Statistics.
Table 6. Summary of the ANOVA results.
Table 7. Regression coefficients.
This neglect can be attributed to several reasons. First, tracking the construction workers’ emotional status is not an easy task given the complexity of the workplace and the heterogeneity of the construction tasks. Second, tracking an emotion by itself is a tremendous scientific issue with diverse aspects and channels (Shalini and Vanitha Citation2013; Kim and André Citation2008). For instance, voice tone, facial expression, body posture all can be utilized to infer the person emotional status (Koelstra et al. Citation2012). The challenge with these emotional expression channels is that they are prone to social masking (Kim and André Citation2008). Another method for tracking human emotion is via physiological signals. Studies have shown that there are physiological changes associated with the emotional status of a person (Ragot et al. Citation2018; Picard, Vyzas, and Healey Citation2001). The physiological signals including heart rate, respiration rate, blood volume pulse and so on are not completely under the control of an individual and thus tracking these signals and extracting information related to emotion of a person from these signals generates more reliable results (Hwang et al. Citation2018). The popularity of physiological signal-based emotion detection stems from the fact that physiological signals as an activity of the autonomous nervous system (ANS) are not prone to social masking, i.e., they reflect the intrinsic emotional state of the person (Ailabouni, Painting, and Ashton Citation2009). Noteworthy that there might be cases where the positive emotion have a negative impact, but most of the previous studies shows that positive emotion as a result of happiness and satisfaction can improve the productivity and vice versa (Martin Citation2008).
From the previous studies, it is clear that workers’ emotional and psychological well being plays a major role in improving the productivity. Therefore, the main objective of this study is to assess the ability of capturing the effect of construction workers’ happiness on their productivity using physiological signals collected via wearable sensors. For that we examine two main issues: 1) the ability to detect labour real-time emotions from physiological signals collected through wearable sensors using machine learning classifiers, and 2) the significance of the detected emotions to be included as one of the variables for predicting productivity in a multi-variate regression model. A pilot study is conducted against construction workers at a pre-fabricated stone construction factory, for which we propose a data collection approach that blends manual entry from a human annotator and an automated worker’s physiological signal tracking process through a mobile application designed for the purpose of this study. We thereby propose a multi-staged machine-learning methodology and report on its accuracy for the workers emotion and productivity predictions. Finally, we outline the limitations of this study and outline recommendations for upscaling the approach examined in this study for a comprehensive investigation pertaining the effect of emotions on construction workers productivity.
2. Literature review
Factors affecting construction workers’ productivity have been studied rigorously in recent years. A group of Finnish researchers has conceived the notion of a “workability index”, mainly to convey the correlation between the potential productivity of a worker and the worker’s individual characteristics, lifestyle characteristics, health status, and work-related aspects. These factors are indirectly related to the emotional status of the worker. The index is based on a questionnaire that associates the worker’s perspective regarding the mental and physiological load of his job with information about his health status and sick leave (Ilmarinen et al. Citation1991). Recently, the “workability index” has been seen as a key solution to assess the mental, physical and physiological status of workers for occupational health programs (Alavinia, van Duivenbooden, and Burdorf Citation2007). The significance of the index stems from the fact that workers with similar diseases, injuries and health conditions but varying individual capability and work task requirements have different work abilities (Alavinia, van Duivenbooden, and Burdorf Citation2007).
Alavinia et al. have estimated the relative contribution of factors such as lifestyle, individual characteristics, health complications and work-related physical and psychosocial demand on the workability of construction laborers (Alavinia, van Duivenbooden, and Burdorf Citation2007). These authors conducted a cross-sectional survey with a sample population consisting of 19,507 Dutch construction workers. The workers took part in a voluntary periodic medical inspection in 2005. The medical inspection included a questionnaire and a physical examination. The questionnaire collected data such as smoking habits, alcohol drinking behavior, activity level during leisure time, age, height, weight, job type, and the worker’s perceived job demands and job control. The physical examination data included total blood cholesterol (TBC), high-density lipoprotein (HDL) cholesterol, forced expiratory volume in 1 second (FEV1), forced vital capacity (FVC), and systolic blood pressure (SBP). Using this data, these investigators measured the workability index and examined the influence of physical and psychosocial work-related factors, individual characteristics, lifestyle factors, and some objective health indicators on the workability index. Specifically, the authors utilized multiple linear and logistic regression models to approximate the effect of each factor on the workability of workers and found that work-related factors explained 22% of the variability in the workability index. On the other hand, age, leisure-time physical activity, lung obstruction, and cardiovascular risk profile contributed approximately 10% of the variability in the workability.
The previously mentioned factors are not the only factors affecting worker productivity. The work stress level, job satisfaction, and experience can also affect worker productivity to a great extent (Halkos and Bousinakis Citation2010). Moreover, the work experience, distance from work, education level and position have a considerable effect as well. George Halkos has studied the effect of stress and job satisfaction on worker productivity (Halkos and Bousinakis Citation2010). In his study, a sample consisting of 425 individuals was analyzed. The result included four logistic regression models quantifying the relationship between work productivity and the various factors affecting it. This author found that both the stress and job satisfaction factors were statistically significant with P-values equal to 0.000 and 0.006, respectively. Halkos also found that factors such as age, education level, experience, distance from work; employment sector and employee positions have a significant effect on worker productivity. All those factors were found to be statistically significant, with P-values less than 0.1, except for the position factor (P-value = 0.195).
Oswald et al. analyzed the relationship between productivity and employee emotional status (Oswald, Proto, and Sgroi Citation2015), and in their study, two groups were analyzed. The first group was exposed to a short comedy routine video clip to make them happier, and at the end of the session their happiness was confirmed by a short questionnaire given to the participants. The control group was exposed to a video clip with the same length as the first clip but showing randomly appearing colored lines in the screen. A short questioner given at the end of the experimental session also confirmed the lack of effect of the second video clip. Both the treated group and the control group were given numerical addition problems and a brief GMAT MATH-style test to measure their productivity. The subjects were informed that their payment was based on their performance on the tests. These investigators found that the treated subjects had a 12% greater productivity in a paid piece-rate Niederle-Vesterlund task. Furthermore, they found that real-life subjects who were exposed to unhappiness (grief and family sickness) were found to be less productive by 10%.
The direct utilization of the Oswald et al. conclusion in construction projects and manual laboring sites might raise some concern. One might argue that the work of Oswald et al., which determined a direct relationship between employee productivity and happiness, only applies to white-collar workers and is not applicable to blue-collar workers, such as construction site workers. Currently, based on the data utilized by Oswald et al. (numerical addition problems and brief GMAT MATH-style test), this argument might be valid. Nevertheless, studies have generally shown that our emotional status can greatly change our physiological signals (Kim and André Citation2008; Picard, Vyzas, and Healey Citation2001; Adolphs Citation2002).
It is well documented in the literature that immune systems change in response to different emotional states (Kalat Citation2016). Negative emotional states, mainly chronic and extreme stress, elicit a cascade of biological events that involve the hypothalamus-pituitary-adrenal (HPA) system (Michels et al. Citation2012) and compromise the immune system, which results in an increased inflammatory response and disturbs physiological homeostasis at different levels (D’Acquisto, Rattazzi, and Piras Citation2014). In contrast, positive emotions reduce the inflammatory response and promote good health by strengthening the immune system (Barak Citation2006). These biological changes are associated with other physiological parameters, which can be measured by cardiovascular responses such as increased heart rate (HR), blood pressure (BP), respiratory frequency and a change in skin conductance levels as a response to negative emotions or normal cardiovascular responses in response to positive or neutral emotional states (Barak Citation2006; Guo, Mrug, and Knight Citation2017). Wenzler et al. (2017) tested 41 patients with recurrent depressive disorder and assessed their heart rate variability (HRV), galvanic skin response (GSR), skin temperature (TEMP) and respiratory frequency (RF). The research data revealed an increased TEMP (because of an elevated GSR) and RF in depressed patients compared to those in the controls (Wenzler et al. Citation2017). In another recent study, Ironson et al. (2018) examined the association between positive emotional well-being and an inflammatory biomarker, C-reactive protein (CRP), which is associated with cardiovascular disorders, obesity, type II diabetes, depression and post-traumatic stress disorder. In this research, the sample included 1979 respondents to a USA nationwide, face-to-face survey that assessed life satisfaction, positive affect, depressive symptoms, chronic health conditions, health behavior variables, and demographic control variables. Additionally, a blood sample was taken for CRP analysis. Their results demonstrated a strong association between life satisfaction and CRP, where life satisfaction was significantly correlated with a lower CRP. The results also revealed that people with a low positive outlook have an increased risk of clinically increased CRP (Ironson et al. Citation2018).
Furthermore, facial expressions and eye gaze can assess emotions. Our facial expressions are an important element in social interaction and communication (Tarnowski et al. Citation2017). Broch-Due et al. (Broch-Due et al. Citation2018) demonstrated that remitted bipolar (BD) patients showed aberrant facial expressions in response to unpleasant pictures and stronger facial expressions to neutral pictures. These authors concluded that aberrant eye-movement and facial displays could be a better measure of emotional reactivity in BD patients than the typically used behavioral measures (Broch-Due et al. Citation2018). Researchers have also proven the correlation between HR and the physical demands associated with manual work (Hwang and Lee Citation2017). Nevertheless, the extent to which automatic productive assessment can benefit from wearable sensor technologies for physiological and emotional tracking purposes has not yet been fully examined. Furthermore, considerable research studies have proven the vital role that happiness plays in elevating employees and office workers’ performance and productivity levels (Oswald, Proto, and Sgroi Citation2015). However, the degree to which this conclusion can be deemed applicable to labor workers in general and construction workers in particular, has not been investigated. Therefore, in this study, we aim at filling this gap by studying the direct effect of the emotional status construction workers (or manual labor workers in general) on their productivity level.
3. Methods and setups
3.1. Productivity and emotions: definition
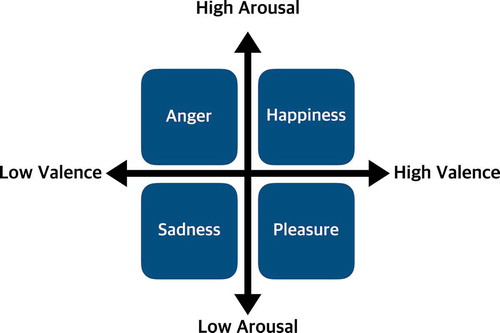
The first concept that requires a clear definition is productivity. Productivity can be interpreted as the amount of output in proportion to the magnitude of input (Jang et al. Citation2011). More specifically, labor productivity can be measured as the ratio of the measurable work achieved (output) to the number of work hours (input) (Jang et al. Citation2011). In this study, we measured productivity by the time spent executing a single task. Another concept that should be clarified is the sentiment and emotional status. There are mainly two emotional models used in emotion recognition research. The discrete emotion model where emotions are considered separate states, e.g., neutral, anger, hate, grief, joy, love, etc. (Picard, Vyzas, and Healey Citation2001). The second model represents the various emotions in a two-dimensional panel, where the x-axis represents the valence panel and the y-axis represents the arousal panel. This model assumes that all emotions can be represented in this two-dimensional panel, as shown in . In this study, the discrete model was utilized. Specifically, the worker’s emotions were labeled “Happy”, “Neutral” or “Sad,” where “Happy” indicates a positive emotion, such as the worker is smiling, laughing or joking. “Neutral” shows that there are no visible emotional clues conveyed by the worker facial expression or situation. “Sad” represents negative emotional states, such as anger, dislike, resentment, and fighting.
Figure 1. Dimensional model of emotions. The model shows how the different emotions can be represented based on valence and arousal.
3.2. Research approach
This study proposed a methodological basis for investigating the effect of emotions on construction labour productivity, where emotions are detected automatically from their physiological signals. This raises two queries, which we examine in this study: 1) the ability to detect labour real-time emotions from physiological signals collected through wearable sensors, and 2) the significance of the detected emotions to be included as one of the variables for predicting productivity.
Emotion recognition is done using Machine Learning classifiers, which is trained using the labels denoted subjectively by the data annotator (i.e. negative, neutral, and positive). In this study we test two classification methods: 1) a single three-way classification method for predicting negative, neutral, or positive emotions, and 2) a two-staged binary classification method, which consists of two classifiers: the first for predicting neutral and non-neutral emotions, and the second which uses the non-neutral instances to predict negative or positive emotions. The performance of the classification methods and the final model selection are reported in a forthcoming section. Furthermore, prediction of productivity in this study is made using a regression model consisting of two variables: the task type and the worker’s predicted emotion. The significance of emotion is also reported in a forthcoming section using statistical tests. Clearly, the accuracy of the regression model is very much reliant on the accuracy of the emotion classification model. The next sections outlines the data collection procedures and settings which we designed for the purpose of this pilot study.
3.3. Construction site setting
The pilot study was conducted in a pre-fabricated stone construction factory called LightStone in Al Ain city in the UAE (Light Stone Factory | Light Stone Factory Citation2018). The factory setting and process allowed an examination of the connection between productivity and emotion on a finer scale. Explicitly, in the factory tasks, execution time can be measured by seconds or minutes, unlike an actual construction site were task execution might take a tremendous number of hours or even days. Additionally, the same task was repeated multiple times through the day, which enables the comparison between two different emotional statuses for the worker while executing the same task. Notably, the study was conducted in the manual stone casting unit, which is a semi-closed area that limits the wind effect (See ). Finally, the study was conducted over four days in the middle of February 2018. This period of the year in UAE is well known for its cool temperature and pleasing weather (Adolphs Citation2002). Therefore, the weather effect on the worker emotional status can be ignored.
Figure 2. Manual stone casting unit in the LightStone Factory.

3.4. Subjects under study
Three workers participated in the study and were compensated for their participation. During the first day, the workers completed a socio-demographic survey regarding their basic biographical information, work experience, lifestyle, and training. In addition, data regarding the participants’ health status, perceived work stress scale, and job satisfaction were collected, and a summary of the data is presented in . The self-reported stress-level and job satisfaction level followed the following scale: 1 indicates extremely unsatisfied and 5 indicates extremely satisfied. On the first day, the subjects were introduced to the instruments that were used, the study procedure and primary readings that were collected from them. During the next three days, one worker was tracked from 8:00 am to 12 pm per day. In the manual stone casting unit, there are 11 different tasks. Each group of workers is responsible for executing certain tasks. Tasks can be physically demanding, such as “ready stone linings”, or easy, such as “oiling molds”. Purposefully, the three chosen workers performed tasks that are distinct in their nature and vary in the physical demand required by the executor.
A primarily analysis of the subjects are presented in , which clearly shows that the ratio of productive to nonproductive tasks executed increases as the job satisfaction level decreases. The same applies to the ratio of the nonproductive task duration to the productive task duration. The positive correlation between job satisfaction and employee productivity was studied and previously proven before (Halkos and Bousinakis Citation2010). Therefore, these observations represent an empirical support for the already proven relation.
3.5. Data collection
To collect the subjects’ physiological signals, two commercially available sensors were used. A Zephyr BioharnessTM from which the respiration rate (RR) and HR were collected. The second sensor was an E4 wristband from which the blood volume pulse (BVP), GSR and TEMP were collected. shows a subject wearing the two sensors. A mobile application was developed and installed on a tablet for the following three purposes.
The first purpose was to connect to the two sensors via Bluetooth to continuously acquire the physiological signals. The second purpose was to allow the human annotator to log the perceived emotional status of the subject (baseline). The third purpose was to measure the task duration by computing the elapsed time for both productive and nonproductive tasks, such as drinking water, demolding by hammer, and cleaning molds. Specifically, the application provides the annotator with a list of all possible work tasks. Automating the logging task facilitates the tracking process and renders more accurate data. By integrating the data from the real-time biosensors and human annotator, this study attempts to continuously measure construction workers’ productivity and relate it to their emotional reactions. The physiological data and the annotators logged data were then saved as a comma separated value (CSV) file in the mobile external storage. summarizes the data collection methods of all variables used for emotion recognition and productivity prediction in this study.
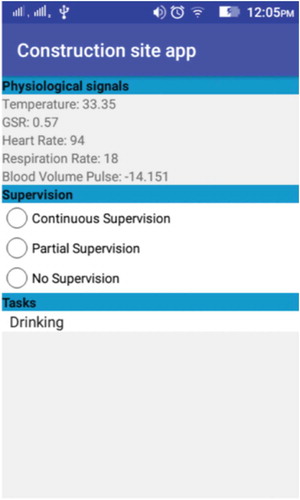
shows a screenshot from the application developed to semi-automate data collection, which consists of a single view of three sections. The first upper section displays the current real-time physiological readings from the Zephyr BioharnessTM and E4 wristband sensors. The other two sections exhibit an interface for the observer to manually log both: the nominal data about workers’ supervision status, and also the current task/activity. The supervision status is logged through three-choice radio-bottoms (Continuous Supervision, Partial Supervision, and No Supervision), which refers to the extent to which the workers’ direct supervisor is present to monitor his work. This variable was eventually not included in this study. The workers’ task/activity is logged through a dropdown list which includes all possible productive and non-productive activities a worker might do during a working day. The productive activities are those listed in (e.g. moving stone, opening moulds with an automatic screwdriver, moving mould), whereas the non-productive activities are namely Resting, Talking only, Standing with a supervisor, and Drinking water. Both are listed under the same dropdown menu. When the observer changes the dropdown selection from one to another, this means that a former activity has ended and a new activity has started. Because the cycles of productive activities investigated in this study are too short, it is unlikely that workers rest or remain idle in the middle of a production cycle. Therefore, when the activity changes from a productive to another non-productive one, this infers that the former has ended and that workers are taking a break before beginning another productive cycle.
Figure 3. A subject wearing the two sensors.
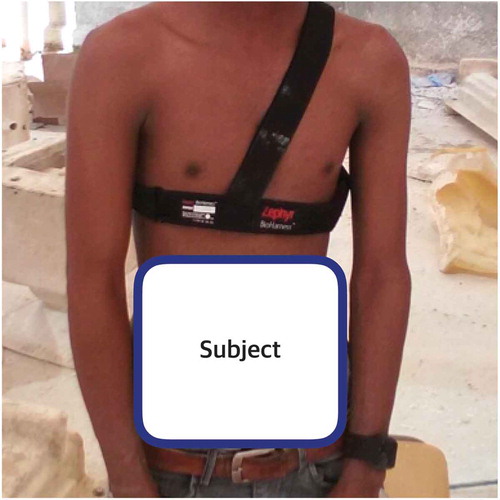
Figure 4. Android mobile application for data collection.
4. Results and discussion
The first goal of this study was to develop Machine Learning classifiers that uses physiological signals to recognize workers emotions. The models are trained using the labels denoted by the data logger (i.e. negative, neutral, and positive). As mentioned earlier, we asses two classification methods: 1) a single three-way classification method for predicting negative, neutral, or positive emotions, and 2) a two-staged binary classification method, which consists of two classifiers: a subjectivity classifier for predicting neutral and non-neutral emotions, and a preceding polarity classifier which uses the non-neutral instances to predict negative or positive emotions.
We used a Random Forest ML classifier, and reweighted the instances in the dataset so that each class had the same total weight (a mechanism used to balance the classes in the dataset). Furthermore, no feature selection algorithm was employed since the number of features was already small (5 features, namely, HR, RR, TEMP, BVP, and GSR). The three-way classification accuracy was 66.1117%, the mean absolute error (MAE) = 0.2926, the root mean squared error (RMSE) = 0.3887 and the Kappa statistic = 0.4916. Furthermore, The subjectivity classification accuracy was 94.3258%, the MAE = 0.1175, RMSE = 0.2122 and the Kappa statistic = 0.8865. The polarity classification accuracy was 98.0292%, the MAE = 0.0463, RMSE = 0.1274 and the Kappa statistic = 0.9606. Thereby, the 3-way classification accuracy was lower than two-stage classification (subjectivity classification followed by polarity classification). Overall, two conclusions can be drawn from these results. First, there is consistency between the human rater annotation and the workers’ physiological signals, and therefore, we can rely on the subjective annotation in the remaining experiments. Second, we can indeed recognize construction workers’ emotional status and track it automatically using their physiological signals.
Figure 5. Line fit plot showing the relationship between the worker’s emotional status and task execution duration.
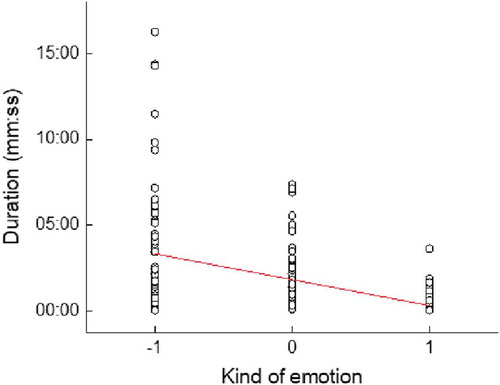
The second goad of this study was to evaluate the significance of emotions for predicting task productivity, which was analyzed using multiple linear regression analysis. Basic descriptive statistics and regression coefficients are shown in –. Analysis of variance (ANOVA) is a test that provides an appropriate procedure for testing the equality of the means of different levels of each single factor expected to affect the response variable. The literature review implies the importance of the emotional status of the worker on the productivity. The ANOVA results implies the validity of the hypothesis adopted, productivity is influenced by the emotions of the worker and task type. . Each of the predictor variables had a significant (p = 5.5 × 10⁻⁸) zero-order correlation with the task execution duration. The two predictor model was able to account for 18% of the variance in the task execution duration with p < .000. In addition, there is a moderately strong positive correlation (Multiple R = 0.43) between our variables (the worker’s emotional status and task type) and the task execution duration. The emotion factor alone was able to explain 12.5% of the variance in the task execution duration with p < 5.5 × 10⁻⁸. Additionally, the positive correlation between emotion and the task execution duration is shown in , where −1 indicates sad or negative emotions, 0 indicates a neutral emotion and 1 indicates happy or positive emotions. In this figure, each point represents a task. The duration is represented in minutes and seconds, and the emotion is represented in numbers, where −1 represents negative emotions, 0 represents neutral emotions and 1 represents positive emotions.
5. Conclusion
In this paper, we demonstrated the key role that emotion plays in construction labor productivity and examined this empirically. First, we utilized a set of biosensors to acquire the workers’ physiological signals and use the acquired data to detect the emotional status of the workers by using human annotation as a baseline. Using this data, an emotion detection method was developed using a Random Forest ML classifier, which is able to detect neutral vs. non-neutral emotions with an accuracy of 94%, and positive vs. negative emotions with an accuracy of 98%. Then, the existence of a statistically significate positive correlation was established between the worker productivity and his emotional status while knowing the task type. In fact, we determined that the task type and the worker’s emotional status explained 18% of the variance in the task execution duration. Based on this analysis, we suggest the inclusion of the workers’ emotional status as a contributing factor in construction worker productivity analyses. Although the sample size is small (170 tasks executed by the three workers during three different days), the result is noteworthy given the amount of variability in the productivity because of different emotions (12.5%). Naturally, this result cannot be generalized, but it is definitely significant and indicates the existence of a relationship that is worth further investigation. Overall, to the authors’ best knowledge, the emotional factor and its effect on construction labor productivity have not been studied in a similar manner.
The main limitation of this study was the small sample size, especially in terms of the number of workers tracked and number of days each worker was tracked. In the future, we plan to address this limitation by upscaling this study to include a larger sample. The advancement made in information systems and the wireless and wearable sensor technologies render the application of the proposed framework technically feasible and practical for large set-ups, given the benefits that we revealed from this pilot study. Furthermore, there is chances for the signals to be affected by certain external and internal factors. External factors include environmental noise, wiring noise etc. and the internal factors include noise from internal body changes like movement and blinking of eyes and even movement of facial muscles. It is possible to correct the signals from the external and internal artifacts by designing the sensor to extract only the nonartifactual signal from the raw signals. The sensors can be modified by inputting filters like band-pass filter or notch filter to remove the external noises. Another design modification for removing internal disturbances include the independent component analysis (ICA) method reported by Martin (Hwang et al. Citation2018). Future studies may further investigate the effect of signal noise on the accuracy of emotion and productivity prediction results.
Disclosure statement
No potential conflict of interest was reported by the authors.
Additional information
Funding
Notes on contributors
Hamad Al Jassmi
Hamad Al Jassmi is an Assistant Professor of Construction Engineering & Management at UAE University. Dr. Al Jassmi obtained his PhD in 2013 from the school of Civil & Environmental Engineering at the University of New South Wales in Australia. Before his PhD studies, Dr. Al Jassmi obtained his Bachelor’s and Master’s degrees from the United Kingdom at the University of Greenwich in 2007, and the University of Cardiff in 2008. His research interests include expert systems and machine learning for sustainable and lean building and infrastructure projects.
Soha Ahmed
Soha Ahmedholds both B.Sc. and M.Sc. degrees in computer science from American university of Sharjah. She is currently working as research assistant at United Arab Emirates University. Her research incorporates the development of new methods and algorithms for automation and biomedical application.
Babitha Philip
Babitha Philip is a PhD student in Civil and Environmental Engineering department at UAE University (UAEU). Her thesis is concerned with the prediction modelling of deterioration of infrastructures based on artificial intelligence techniques. She did her Bachelors in Civil Engineering and Masters in Construction Engineering and Management from India. In 2017, she joined as a Research Assistant at UAEU for two years and the work was focused on studies related to the productivity of labors at construction site.
Fadwa Al Mughairbi
Fadwa Al Mughairbihas a PhD degree in Biological Psychology from SUNY, Binghamton (2000). Currently, she runs the Behavioural Neuroscience lab, Department of Psychology and supervising three MSc. in Clinical Psychology students. Her main research focus is psychotherapy as an epigenetic factor, natural neuroprotective agents. Dr Al Mughairbi has an extensive experience in designing in vivo experimental paradigms that include behavioural testing, and brain analysis, which is very important in this research. She will be responsible for the biochemical and conventional analysis.
Mahmoud Al Ahmad
Mahmoud Al Ahmad (Senior IEEE Member) received his B.Sc. in electrical engineering from Birzeit University in Ramallah/West Bank in 1999. Both M.Sc. and the Dr.-Ing. Degrees in microwave engineering from Technische Universitaet Muenchen, Munich, Germany, in 2002 and 2006, respectively. Currently, he is a faculty member at the electrical department at the University of United Arab Emirates and his research interest is involved in the design and fabrication of self-powered low powered nano-based electronic devices and systems along with applied electromagnetic for biomedical applications.
References
- Abdul Kadir, M. W., M. S. Lee, S. M. Jaafar, A. A. A. Sapuan, M. Ali, A. Kadir, W. Lee, M. Jaafar, S. Sapuan, and A. Ali. 2005. “Structural Survey Factors Affecting Construction Labour Productivity for Malaysian Residential Projects.” Structural Survey Benchmarking an International Journal of Structural Survey 23 (5): 192–206.
- Adolphs, R. 2002. “Recognizing Emotion from Facial Expressions: Psychological and Neurological Mechanisms.” Behavioral and Cognitive Neuroscience Reviews 1 (1): 21–62. doi:10.1177/1534582302001001003.
- Ailabouni, N., N. Painting, and P. Ashton, “Factors Affecting Employee Productivity in the UAE Construction Industry,” in 25th Annual ARCOM Conference, Nottingham, UK, 7-9 September 2009, 2009, pp. 555–564. DOI:10.1177/1753193408102773.
- Alavinia, S. M., C. van Duivenbooden, and A. Burdorf. 2007. “Influence of Work-related Factors and Individual Characteristics on Work Ability among Dutch Construction Workers.” Scandinavian Journal of Work, Environment & Health 33 (5): 351–357. doi:10.5271/sjweh.1151.
- Barak, Y. 2006. “The Immune System and Happiness.” Autoimmunity Reviews 5: 523–527. doi:10.1016/j.autrev.2006.02.010.
- Broch-Due, I., H. L. Kjaerstad, L. V. Kessing, and K. Miskowiak. 2018. “Subtle Behavioural Responses during Negative Emotion Reactivity and Downregulation in Bipolar Disorer: A Facial Expression and Eye-tracking Study.” Psychiatry Research 266: 152–159. doi:10.1016/j.psychres.2018.04.054.
- D’Acquisto, F., L. Rattazzi, and G. Piras. 2014. “Smile-It’s in Your Blood.” Biochemical Pharmacology 91: 287–292. doi:10.1016/j.bcp.2014.07.016.
- Guo, J., S. Mrug, and D. C. Knight. 2017. “Emotion Socialization as a Predictor of Physiological and Psychological Responses to Stress.” Physiology & Behavior 175: 119–129. doi:10.1016/j.physbeh.2017.03.046.
- Halkos, G., and D. Bousinakis. 2010. “The Effect of Stress and Satisfaction on Productivity.” International Journal of Productivity and Performance Management 59 (5, Jun.): 415–431. doi:10.1108/17410401011052869.
- Hassani, S., I. Bafadel, A. Bekhatro, E. Al Blooshi, S. Ahmed, and M. Alahmad, “Physiological Signal-based Emotion Recognition System,” in 2017 4th IEEE International Conference on Engineering Technologies and Applied Sciences (ICETAS), 29 Nov - 01 Dec, AMA International University, Bahrain, 2017, pp. 1–5.
- Hickson, B. G., and L. A. Ellis. 2014. “Factors Affecting Construction Labour Productivity in Trinidad and Tobago.” Journal of Associate Professor Process Engineering Trinidad Tobago 42 (1): 4–11.
- Hwang, S., H. Jebelli, B. Choi, and M. Choi. 2018. “Measuring Worker’s Emotional State during Construction Tasks Using Wearable EEG.” Journal of Construction Engineering and Management 144. doi:10.1061/(ASCE)CO.1943-7862.0001506.
- Hwang, S., and S. H. Lee. 2017. “Wristband-type Wearable Health Devices to Measure Construction Workers’ Physical Demands.” Automation in Construction 83: 330–340. doi:10.1016/j.autcon.2017.06.003.
- Ilmarinen, J., K. Tuomi, L. Eskelinen, C. H. Nygard, P. Huuhtanen, and M. Klockars. 1991. “Background and Objectives of the Finnish Research Project on Aging Workers in Municipal Occupations.” Scandinavian Journal of Work, Environment & Health 17 (SUPPL. 1): 7–11.
- Infrastructure and Project Authority. 2016. Government Construction Strategy 2016-2020. London.
- Ironson, G., N. Banerjee, C. Fitch, and N. Krause. 2018. “Positive Emotional Well-being, Health Behaviors, and Inflammation Measured by C-Reactive Proten.” Social Science & Medicine 197: 235–243. doi:10.1016/j.socscimed.2017.06.020.
- Jang, H., K. Kim, J. Kim, and J. Kim. 2011. “Labour Productivity Model for Reinforced Concrete Construction Projects.” Construction Innovation 11 (1): 92–113. doi:10.1108/14714171111104655.
- Jarkas, A. M., and C. G. Bitar. 2012. “Factors Affecting Construction Labour Productivity in Kuwait.” Journal of Construction Engineering and Management 138 (July): 811–820. doi:10.1061/(ASCE)CO.1943-7862.0000501.
- Kalat, J. 2016. Biological Psychology. 12th ed. C.A.: Wadsworth.
- Kim, J., and E. André. 2008. “Emotion Recognition Based on Physiological Changes in Music Listening.” IEEE Transactions on Pattern Analysis and Machine Intelligence 30 (12): 2067–2083. doi:10.1109/TPAMI.2008.26.
- Koelstra, S., Lee, J., and Pun, T. 2012. “DEAP: A Database for Emotion Analysis; Using Physiological Signals.” IEEE Transactions on Affective Computing 3 (1): 18–31. DOI:10.1109/T-AFFC.2011.15.
- Light Stone Factory | Light Stone Factory.” [Online]. Accessed March 05 2018. http://lightstone.ae/eng/
- Martin, A. 2008. “The Role of Positive Psychology in Enhancing Satisfaction, Motivation and Productivity in the Workplace.” Journal of Organizational Behavior Management 24: 113–133. doi:10.1300/J075v24n01_07.
- Michels, N., I. Sioen, I. Huybrechts, K. Bammann, B. Vanaelst, T. De Vriendt, L. Iacoviello, K. Konstabel, W. Ahrens, and S. De Henauw. 2012. “Negative Life Events, Emotions and Psychological Difficulties as Determinants of Salivary Cortisol in Belgian Primary School Children.” Psychoneuroendocrinology 37: 1506–1515. doi:10.1016/j.psyneuen.2012.02.004.
- Ministry of Economy, “UAE Annual Economic Report 2016,” Abu Dhabi, 2016.
- Oswald, A. J., E. Proto, and D. Sgroi. 2015. “Happiness and Productivity.” Journal of Labor Economics 33 (4, Oct.): 789–822. doi:10.1086/681096.
- Picard, R. W., E. Vyzas, and J. Healey. 2001. “Toward Machine Emotional Intelligence: Analysis of Affective Physiological State.” IEEE Transactions on Pattern Analysis and Machine Intelligence 23 (10): 1175–1191. doi:10.1109/34.954607.
- Porntepkasemsant, P., and S. Charoenpornpattana, “Factor Affecting Construction Labor Productivity in Thailand,” in IEOM 2015 - 5th International Conference on Industrial Engineering and Operations Management, Proceeding, March 3–5, Dubai, UAE, 2015.
- Ragot, M., N. Martin, S. Em, N. Pallamin, and J.-M. Diverrez. 2018. Emotion Recognition Using Physiological Signals: Laboratory Vs. Wearable Sensors, 15–22. Cham: Springer.
- Schilirò, D., “Diversification and Development of the UAE’s Economy,” IDEAS Working Paper Series from RePEc. 2013.
- Shalini, B., and L. Vanitha. 2013. “Emotion Detection in Human Beings Using ECG Signals.” International Journal of Engineering Trends and Technology 4 (5): 1337–1342.
- Tarnowski, P., M. Kolodziej, A. Majkowski, and R. J. Rak. 2017. “Emotion Recognition Using Facial Expprssions.” Procedia Computer Science 10C: 1175–1185. doi:10.1016/j.procs.2017.05.025.
- Wenzler, S., M. Hagen, M. P. Tarvainen, M. Hilke, N. Ghirmai, A.-C. Huthmacher, M. Trettin, R. van Dick, A. Reif, and V. Oertel-Knochel. 2017. “Intensified Emotion Perception in Depression: Differences in Physiological Arousal and Subjective Perceptions.” Psychiatry Research 253: 303–310. doi:10.1016/j.psychres.2017.03.040.