
 ?Mathematical formulae have been encoded as MathML and are displayed in this HTML version using MathJax in order to improve their display. Uncheck the box to turn MathJax off. This feature requires Javascript. Click on a formula to zoom.
ABSTRACT
The purpose of this study was to propose a method for evaluating the seismic capacity of existing RC buildings in Korea by reviewing the applicability of the Japanese Standard. Based on the seismic capacity of Korean buildings evaluated by this standard, we modified the basic structural index, which is calculated in terms of the ultimate horizontal strength and ductility. We compared our experiment results to the values calculated using the strength equations for columns and walls from the Japanese Standard. The flexural strength equations could be applied without modification, while the shear strength equations required modification. We evaluated these modified strength equations and proposed unit average shear stresses of columns and walls based on statistical data relating to the structural characteristics of Korean buildings. The values of the ductility indices, which are primarily calculated based on the shear-to-flexural capacity ratio, of Korean buildings with hoop spacing wider than 300 mm, as computed by the proposed method, were more reasonable than those calculated by the Japanese Standard. We believe that the proposed method provides a useful strategy for identifying Korean buildings that are vulnerable to seismic activity, and recommend urgent earthquake preparedness measures.
1. Introduction
In Korea, countermeasures against earthquakes, such as seismic capacity evaluations and/or retrofitting schemes for buildings, especially existing low-rise reinforced concrete (RC) buildings, have not been implemented comprehensively because Korea had not experienced many destructive earthquakes. However, more than 1,200 low- or moderate-intensity earthquakes have occurred in the coastal and inland regions of Korea over the past 20 years. The recent occurrence of moderate earthquakes in Korea, such as the 2016 Gyeongju Earthquake, with M = 5.8, and the 2017 Pohang Earthquake, with M = 5.4, pointed to the importance of future earthquake preparedness measures becoming widely recognized in Korea.
It is very important to assess the seismic risk of existing Korean buildings to mitigate earthquake damage and provide effective earthquake preparedness measures against future earthquakes. For this purpose, it is essential to develop a methodology to estimate the seismic capacity of buildings and their vulnerability, and to predict potential losses due to earthquakes.
The main objective of this study was to propose a method to evaluate the seismic capacity of existing RC buildings in Korea by reviewing the applicability of the Japanese Standard for Evaluation of Seismic Capacity of Existing Reinforced Concrete Buildings (JBDPA Citation2017, Citation2005). To achieve this, the paper focused on the following three subjects:
The seismic capacity of Korean RC buildings according to the Japanese Standard
Evaluation of seismic capacity and estimated seismic vulnerability
Evaluation of the applicability of the Japanese Standard to Korean RC buildings
Proposal for a basic structural index suitable for evaluating existing RC buildings in Korea
Proposal of equations to determine the ultimate horizontal flexural and shear strength based on test results from Korean RC buildings
Proposal of average shear stresses of Korean buildings based on statistical data
Seismic capacity of Korean RC buildings based on the proposed basic strength index
Comparison of Korean RC buildings in terms of seismic capacity according to the proposed basic strength index and the Japanese Standard
Seismic vulnerability and probabilistic assessment of structural damage ratios of Korean RC buildings due to earthquakes
2. Investigated buildings
The Korean buildings investigated in this study are summarized in . These are 14 typical RC public buildings, with between three and five stories, which were constructed before the code revision in 1988. Seismic design provisions for Korean building structures were not introduced until 1988, so the buildings investigated in this paper were not designed to withstand seismic loads.
Table 1. Details of the Korean RC buildings investigated in this study.
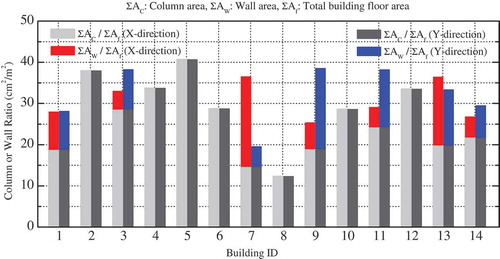
Most of the concrete used in the construction of these buildings has a design strength of 18 MPa (180 kgf/cm2) or 21 MPa (210 kgf/cm2), and the typical column cross section is 400 mm × 400 mm. The hoops are arranged with spacings of more than 300 mm. The structures are RC frames with few or no shear walls, either in the longitudinal or transverse direction (referred to subsequently as the X- and Y-direction, respectively), as shown in . It is judged from research results (JBDPA Citation2017, Citation2005) that the 14 RC typical buildings in Korea investigated in this study have a similar seismic capacity in both X- and Y-directions because Korean buildings have few walls in the X- and Y-directions.
Figure 1. Column and wall ratios in the first stories of the buildings investigated.
3. Seismic capacity of existing RC buildings in Korea based on the Japanese standard
The objective of this section is to provide basic information regarding the seismic capacity of Korean buildings, and to determine the applicability of the Japanese Standard to Korean RC buildings. This section focus on 1) seismic capacity evaluation of 14 existing RC public buildings in Korea based on the Japanese Standard, 2) the relationship between the seismic capacity of typical RC buildings in Korea and Japan and 3) the relationship between the seismic capacity of RC buildings in Korea and that of buildings damaged by severe earthquakes in Japan.
3.1. Basic concept of the Japanese standard
The Japanese Standard (JBDPA Citation2017, Citation2005) evaluates the seismic capacity of each story, and in each direction, of a building in terms of the following seismic capacity index IS:
where EO is the basic structural index calculated based on the ultimate horizontal strength, ductility, number of stories and current story; SD is the structural design index used to modify EO due to the irregularity of the shape of the building or the distribution of the stiffness along the height of the building; and T is the time index used to modify EO to reflect the deterioration of the strength and ductility of the building.
The standard value of the SD- and T-indices is 1.0. The EO of a single structural system can be expressed as the product of the ultimate horizontal strength index and is calculated based on the story shear coefficient (C), ductility index (F) and story index (φ). The φ-index of the first story is 1.0. The EO-index of the first story of a simple structure can therefore be defined as:
The standard specifies three procedure levels. In the first level procedure, the F-index of Equation (2) is 0.8 or 1.0 and the ductility is neglected. In the second and third level procedures, the F-index is 0.8 or 1.0 for brittle columns and 1.27 to 3.2 for ductile columns, depending on the shear span-to-depth ratio, shear-to-flexural strength ratio, etc.
Any phase of the screening procedure can be used to estimate the IS- index. However, in practice, applying higher-level procedures results in more reliable estimations. Each procedure is detailed as follows:
(1) First level procedure
The ultimate strength of the frames can be calculated based on the shear strength of the concrete and the cross-sectional areas of the columns and walls. The ductility of a frame is specified assuming the shear failure of the wall. The SD- or T-indices are estimated based on a simple model. This procedure can be applied in buildings with comparatively high numbers of walls. Estimating the seismic performance of a building based on the moment-resisting frame without taking into account shear walls may lead to underestimation of the seismic performance of the building.
(2) Second level procedure
The capacity and ductility of the columns and walls were calculated based on their theoretical ultimate strength, and the failure mechanisms of structural components should be assumed when estimating the EO-index. However, the beams of the frame are assumed to be rigid. In comparison to the first level procedure, a more complicated procedure is used to estimate the SD- or T-index. This procedure can be applied to buildings with features such as weak columns and strong beam structural systems. The resulting estimates are generally more reliable than those calculated using the first level procedure.
(3) Third level procedure
All possible failure mechanisms of the structure, including beams and rotation of walls due to deformation of the foundations, are taken into account when estimating the EO-index. The technique for estimating the SD- or T-index may be the same as in the second level procedure.
On the other hand, seismic safety of a building structure can be judged by Equation (3):
where IS is the seismic index calculated from Equation (1); ISO is the seismic demand index of structure. If Equation (3) is satisfied, the building may be assessed to be “Safe”; the building possess the seismic capacity required against the expected earthquake motions. Otherwise, the building should be assessed to be “Uncertain,” in seismic safety. The seismic demand index of structure, ISO, should be calculated by Equation (4) regardless of the story in the building.
where ES shows the basic seismic demand index of structure, standard values of which can be selected as follows regardless of the direction of the building:
ES = 0.8 for the first level procedure,
ES = 0.6 for the second level procedure,
ES = 0.6 for the third level procedure.
Z represents the seismic zone index; G is the ground index; U is the usage index. The basic seismic demand index of ES = 0.8 and 0.6 represent the critical value required to prevent moderate or greater earthquake damage in the presence of a ground motion acceleration of 0.23 g, which is based on empirical basis. Buildings with seismic demand indices greater than 0.6 did not suffer any moderate or greater damage in the 1968 Tokachi-oki or the 1978 Miyagiken-oki earthquakes. The maximum ground acceleration during these earthquakes was approximately 23% that of gravity (i.e., 0.23 g).
3.2. Assumptions in seismic evaluation
The seismic capacity of each building was evaluated based on the following assumptions:
The location of the yield hinge of each member is assumed to be in accordance with JBDPA (Citation2017, Citation2005), FEMA 310 (Citation1998), FEMA 356 (Citation2000) and AIJ (Citation2018).
The yield hinges of the columns without hanging and spandrel walls are assumed to be at the end of the beam. If the columns included hanging and spandrel walls, the hinge location was set to Dc/2 from the edge, where Dc is the column width.
The building weight per unit area is assumed to be 10 kN/m2 (1.0 tf/m2).
The dimensions of the structure are determined based on structural drawings.
The T-index, which represents deterioration after construction, is assumed to be 1.0.
Non-structural elements, such as brick walls, are neglected when evaluating seismic capacity.
Seismic capacity is evaluated by the first and the second level procedures detailed in the Japanese Standard for Evaluation of Seismic Capacity of Existing Reinforced Concrete Buildings (JBDPA Citation2017, Citation2005) using a computer program (SPRC Committee Citation1980) that was developed based on the Japanese Standard.
3.3. Seismic capacities in the X- and Y-directions
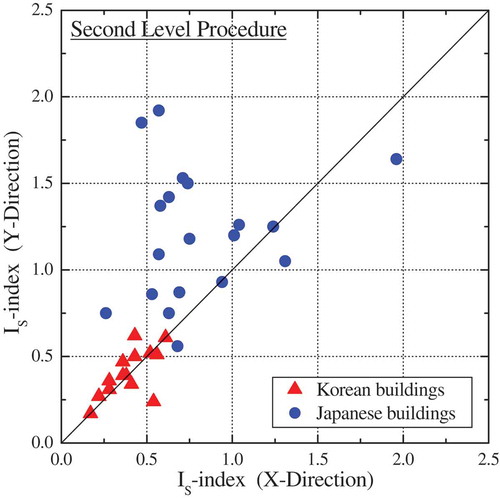
shows the evaluation results, i.e., the IS in the X- and Y-directions, with respect to the seismic capacity of the 14 existing low-rise Korean RC buildings detailed in . and show the relationship between IS in the X- and Y-directions, where the IS values of the first stories of Korean buildings calculated according to the first and the second level procedures are plotted, together with those of the Japanese RC buildings shown in .
Table 2. Seismic capacity indices (Is) of Japanese buildings (Lee et al. Citation1996a).
The IS values of RC Japanese buildings were investigated by Lee et al. (Citation1996a). These are 21 typical RC public buildings, with between one and six stories, which were constructed prior to the seismic code revision in 1971. Most of the concrete used in the construction of these Japanese buildings has a design strength of 18 MPa (180 kgf/cm2) or 21 MPa (210 kgf/cm2), and the typical floor plan has 3 spans having 7.0 m + 3.5 m + 7.0 m or 8.0 m + 3.0 m + 8.0 m in the Y-direction, while those in the X-direction are ranging from 8 to 12 spans with a length of 4.5 m, respectively. The typical column cross-sectional area is 500 mm × 500 mm or 500 mm × 600 mm, and the hoops are arranged with spacings of more than 250 mm. The structures are RC frames with shear walls, both in the X- and Y- directions, but more shear walls in the Y-direction.
As shown in the figures, Korean buildings have approximately equal IS in the X- and Y-directions, while Japanese buildings generally have higher IS in the Y-direction. This is because Korean buildings have few walls in the X- and Y-directions, as shown in , while Japanese buildings have more walls in the Y-direction than in the X-direction.
Figure 2. Seismic capacity indices (IS) in the X- and Y-directions of 14 existing low-rise RC Korean buildings.
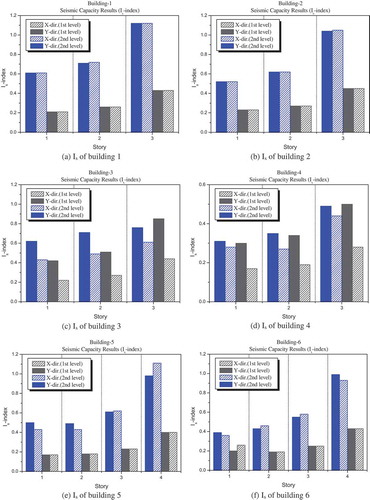
Figure 2. (Continued).
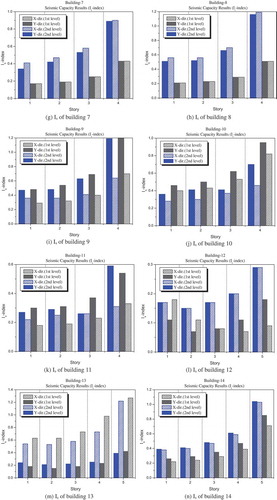
Figure 3. Seismic capacity calculated using the first level procedure of the Japanese Standard in the X- and Y-directions.
Figure 4. Seismic capacity calculated using the second level procedure of the Japanese Standard in the X- and Y-directions.
3.4. Seismic capacity according to first and second level procedures
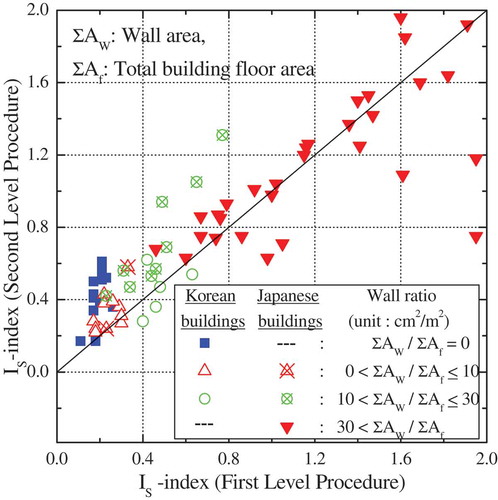
compares the IS values obtained using the first level procedure with those calculating using the second level procedure. When they have low wall ratios, both Korean and Japanese buildings have higher IS when estimated by the second level procedure rather than the first level procedure. In particular, seven Korean buildings without shear walls (14 data) have significantly higher IS when estimated using the second level procedure rather than the first level procedure.
These results are consistent with those reported in the references (JBDPA Citation2017, Citation2005; Etawa, Kubo, and Ueno Citation1998; Kubo et al. Citation1998; Kubo and Etawa Citation1999), which suggest that the first level procedure, which neglects the ductility of the components, may underestimate the IS of buildings with few shear walls.
Figure 5. Seismic capacity according to the first and second level procedures.
3.5. Distribution of seismic capacity values
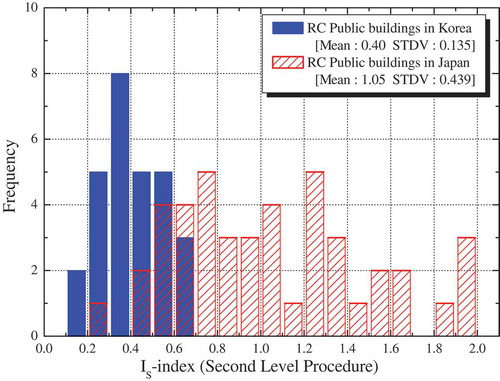
shows the distribution of IS values of the Korean buildings evaluated in this study and Japanese buildings reported in Lee et al. (Citation1996a). The IS of each building are estimated in both directions using the second level procedure. As shown in the figure, Korean buildings have a narrower distribution of IS, and the mean IS is 0.4 (STDV: 0.135). These values are lower than those of Japanese buildings, which have a mean IS of 1.05 (STDV: 0.439).
Figure 6. Distribution of seismic capacity indices.
3.6. Distribution of ductility indices
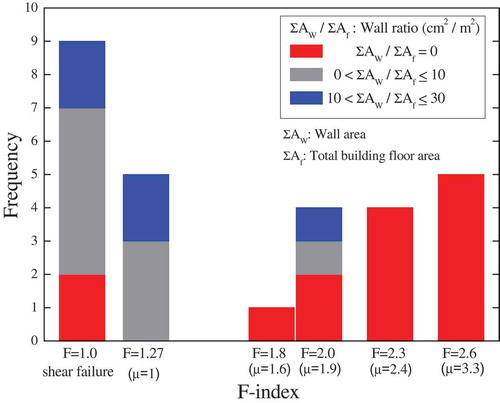
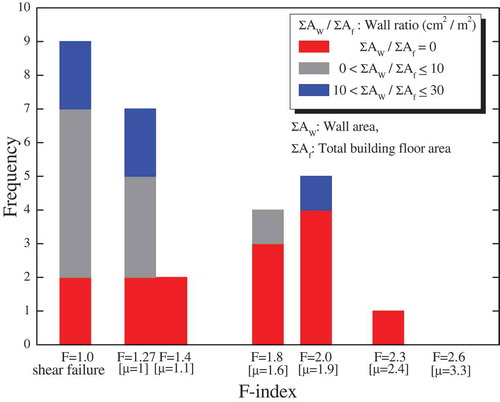
shows the distribution of the ductility indices (F) of 14 Korean buildings according to the second level procedure. As shown in the figure, the ductility indices of buildings with higher wall ratios are generally lower than those of buildings with lower wall ratios, because shear walls are expected to fail due to brittleness (F = 1.0), and the capacity of individual buildings contributes significantly to the overall IS.
The Japanese Standard defines the ductility index (F) of a building as the expected ductility, which is primarily based on the shear-to-flexural capacity ratio (VSu/VMu). The results shown in show that the F-indices of half of the buildings investigated in this study vary between 1.8 and 2.6, which corresponds to μ = 1.6 to 3.3.
It should be noted, however, that the expected ductility of these buildings may need to be re-examined, because most buildings investigated herein have hoop spacings wider than 30 cm. The high ductility values calculated by the Japanese Standard may be overestimates. This may mean that Korean buildings have lower IS and higher seismic vulnerability than indicated in this paper.
Figure 7. Ductility index distribution of Korean buildings.
3.7. Distribution of estimated seismic vulnerability
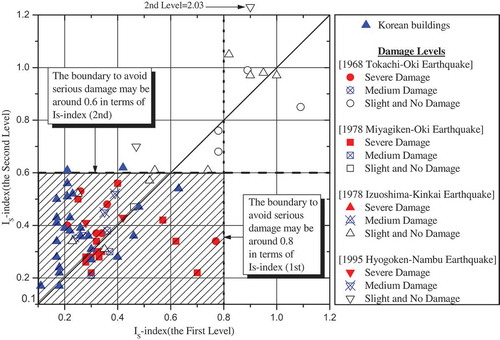
shows the relationship between the IS values of buildings in Korea and those in Japan that were damaged by the 1968 Tokachi-oki (AIJ Citation1968; Shiga, Shibata, and Takahashi Citation1968; JBDPA Citation2017, Citation2005), 1978 Miyakiken-oki (Shiga, Shibata, and Takahashi Citation1968; JBDPA Citation2017, Citation2005), 1978 Izuoshima-kinkai (Okada Citation1985; JBDPA Citation2017, Citation2005) and 1995 Hyogoken-Nambu (Lee et al. Citation1996b) earthquakes. Most of the buildings investigated are public RC buildings with two to four stories (most had three stories). The IS values estimated by the first and second level procedures are plotted in both directions for each building. The peak ground acceleration during the earthquakes experienced in Japan was approximately 0.23g.
As shown in the figure, most Japanese buildings have IS values of 0.8 or less according to the first level procedure, and 0.6 according to the second level procedure (shadowed area), which indicates a high possibility of severe damage. As previously stated, the values were assessed based on the Japanese standard for the critical value required to prevent large-scale earthquake damage to structures during a ground motion acceleration of 0.23 g (JBDPA Citation2017, Citation2005). Most of the Korean buildings investigated herein fall in the shaded area, and it is expected that they can be severely sustained by earthquakes of similar intensity to the Japanese earthquakes mentioned above.
Figure 8. Distribution of seismic capacity indices of RC buildings damaged by past earthquakes.
4. Proposal of basic structural index for evaluating existing Korean RC buildings
Half of 14 RC public buildings in Korea, as investigated in section 3, have F-indices between 1.8 (μ = 1.6) and 2.6 (μ = 3.3). Most buildings investigated herein have hoop spacings wider than 300 mm, so the high ductility values calculated using the Japanese Standard may be overestimates. In order to propose a method suitable for evaluating the seismic capacity of existing Korean buildings based on the Japanese Standard, therefore, it is necessary to modify the expected ductility index; particularly the ultimate shear strength, which is a basic factor used to estimate ductility, should be re-examined.
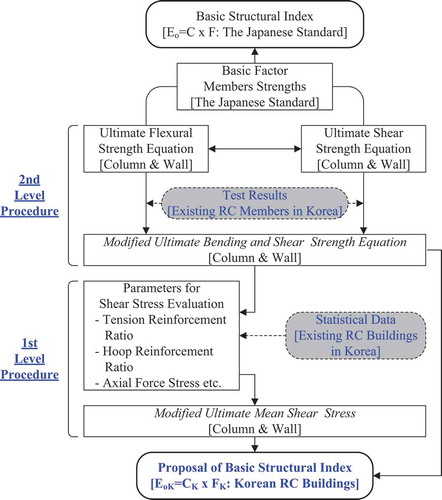
As shown in , in this section, the equations for the ultimate flexural and shear strength of the columns and walls are modified. These are basic components of the basic structural index that are used when applying the second level procedure of the Japanese Standard (JBDPA Citation2017, Citation2005). These modifications are proposed based on the results of tests of columns and walls in Korean buildings. The ultimate flexural and shear strength equations were proposed. The ultimate average shear stress of the columns and walls was evaluated using the first level procedure, based on statistical data on the structural characteristics of Korean RC buildings.
Figure 9. Flowchart of the proposed basic structural index, which is suitable for evaluating Korean RC buildings.
4.1. Ultimate strength equations for columns
4.1.1. Ultimate flexural strength of a rectangular column
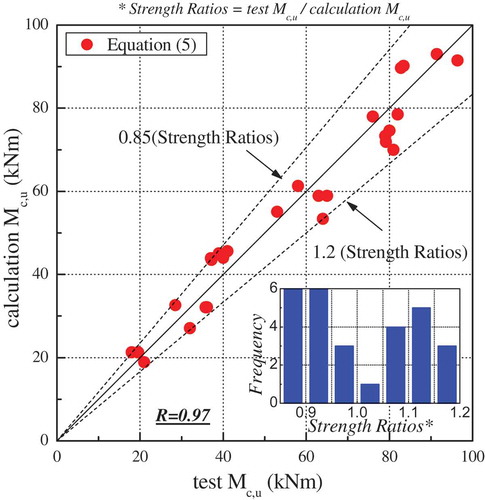
shows the relationship between the ultimate flexural strength of columns (subsequently referred to as Mc,u), obtained using experimental evaluations of the horizontal behavior of columns of Korean RC buildings (Yi et al. Citation2000), and Mc,u, calculated using Equation (5), which is quoted from the Japanese Standard.
For ;
For ;
For ;
Figure 10. Relationship between cMu values of columns obtained experimentally and computed using Equation (5).
where Nmax is the axial compressive strength of a column (, [N]); Nmin is the axial tensile strength of a column (
, [N]); N is the axial force on the section [N]; at is the tensile reinforcement area [mm2]; ag is the total longitudinal reinforcement area [mm2]; b is the width of compression face of a column [mm]; D is the cross-sectional depth of a column, [mm];
is the yield strength of the longitudinal reinforcements [MPa]; and fc is the compressive strength of the concrete [MPa].
As shown in the figure, the flexural strength ratios (testMc,u/calcMc,u) were approximately distributed between +10% and – 10%, and the linear correlation coefficient (R) between the experimental and theoretical values of Mc,u was 0.97. The value of Mc,u calculated using Equation (5) is in good agreement with the results of the experiments, in which Korean RC columns were tested. Thus, the values of Mc,u for existing Korean RC buildings calculated by Equation (5) may be assumed to be reliable.
4.1.2. Ultimate shear strength equation of rectangular column
The following is an empirical equation derived for beams (Arakawa Citation1960). It was subsequently modified to include the effect of the axial load and seismic safety of the shear strength, as follows:
where pt is the tension reinforcement ratio [%]; pw is the transverse shear reinforcement ratio; is the yield strength of the transverse shear reinforcement [MPa];
is N/bD [MPa]; d is the distance from the compressive face to the centroid of the tensile reinforcement [mm]; M/V is the shear span [mm], which may be taken as half of the clear height in the case of columns; and j is 7/8d.
According to the AIJ (Citation2018), the coefficient of Equation (6), 0.053, which is used to calculate the minimum ultimate shear strength of columns (subsequently referred to as Vc,Su), was derived from the product of the coefficient of Equation (7), i.e., 0.068 (which calculates the mean of Vc,Su) and the shear strength ratio (testVc,Su/calc Vc,Su-mean), i.e., 0.8, which corresponds to – 5% of the distribution of the shear strength ratios approximated by the normal probability density function. Thus, Equation (6) may provide safer estimates of Vc,Su because it uses a lower boundary than Equation (7).
shows a histogram of the shear strength ratios (testVc,Su/calcVc,Su-mean), where testVc,Su are experimental results from Korean RC columns and the values of calcVc,Su-mean were calculated using Equation (7). Although Equation (7) calculates the mean of Vc,Su, the mean of testVc,Su/calc Vc,Su-mean was approximately 1.2, as shown in . It should be noted that, according to the experimental results, the equation for Vc,Su according to the Japanese Standard generally provided an overestimate, and may require modification to provide reasonable estimates of the shear strength of Korean columns.
Figure 11. Distribution of shear strength ratios between the experimental and analytical values calculated using Equation (7) for Korean columns.
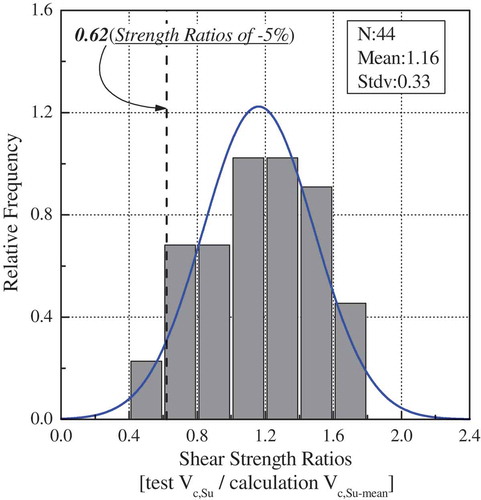
Based on the procedures presented in AIJ (Citation2018), Equation (8) to evaluate Vc,Su for Korean RC columns was modified. The coefficient in Equation (8), 0.042, was derived by multiplying the coefficient from Equation (7), 0.068, by the shear strength ratio, 0.62, which corresponds to – 5% of the distribution for the shear strength ratio, which was approximated by the normal probability density function, as shown in .
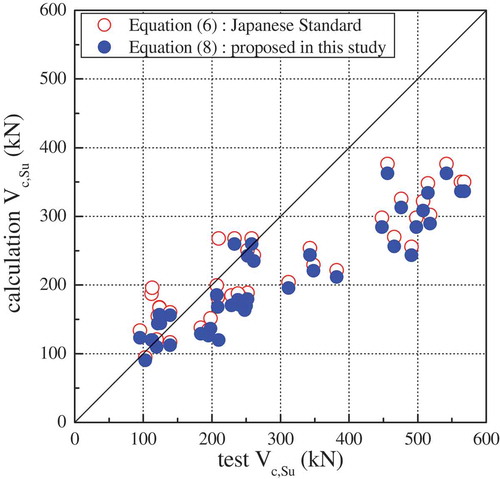
shows the relationship between the experimental values of Vc,Su and those calculated by the proposed equation, Equations (8) and (6), which is quoted from the Japanese Standard. As shown in the figure, Equation (8) estimates Vc,Su more reasonably by using a lower boundary than Equation (6).
Figure 12. Relationship between Vc,Su values according to the experiments for Korean columns and those calculated using Equations (6) and (8).
4.2. Ultimate strength equation for walls
4.2.1. Ultimate flexural strength equation for walls with boundary columns
The flexural strength of a wall with boundary columns, Mw,u, is defined by the Japanese Standard as follows:
where ag is the total area of longitudinal reinforcement in the boundary column on the tension side [mm2]; is the yield strength of the longitudinal reinforcement on the tension side [MPa]; lw is the distance between both centroids of the boundary columns [mm]; aw is the total area of the vertical reinforcements of the wall, excluding the reinforcement in the boundary columns [mm2];
is the yield strength of the vertical reinforcement of the wall [MPa]; and N is the total axial load of the boundary column, [N].
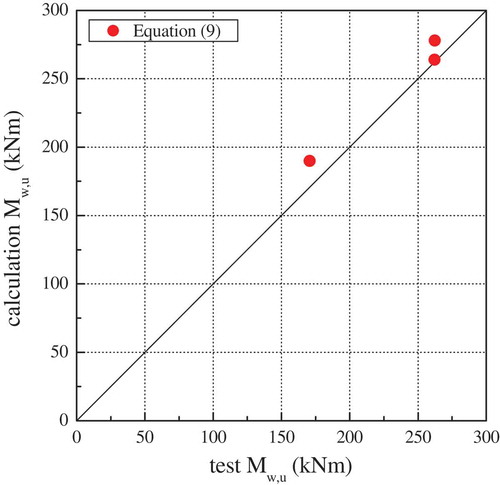
shows the relationship between Mw,u according to experiments, in which the horizontal behavior of walls in Korean RC buildings (Yi et al. Citation2000), and the values calculated using Equation (9), which is quoted from the Japanese Standard were evaluated. As it does not have sufficient experimental data to discuss the relationship between both values of Mw,u shown in , valid conclusions cannot be derived. More experimental data, for further research, should be obtained so that this study can propose a suitable value of Mw,u for Korean RC walls.
As the equation for Mw,u was derived theoretically, as shown in AIJ (Citation2018) and (JBDPA Citation2017, Citation2005), it can be assumed that the value of Mw,u calculated using Equation (9) is reliable. This assumption was verified by comparing the results from Equation (9) to the theoretical values calculated using Equation (5), from the Japanese Standard, and experimental values of Mw,u. Thus, this study calculated Mw,u for Korean RC walls using Equation (9).
Figure 13. Relationship between experimental values of Mw,u and results calculated using Equation (9).
4.2.2. Ultimate shear strength equation for walls with boundary columns
The minimum value of the ultimate shear strength of a wall with boundary columns (Vw,Su) is calculated using Equation (10) when applying the Japanese Standard. The research then modified this equation to evaluate the behavior and seismic safety of the shear strength of walls based on the mean shear strength, which is defined by Equation (11), which is derived from Vc,Su of columns (JBDPA Citation2017, Citation2005).
where pte is 100at/(bel) [%]; at is the total area of longitudinal reinforcement of the tension of the column [mm2]; be is the equivalent wall thickness (total cross section area/l) [mm]; l is the outer-to-outer distance between two boundary column [mm]; hw is the height from the floor of the story to the top of the wall (in the case of a top story or single story wall, 2hw/l is replaced by hw/l) [mm]; ps is the equivalent wall reinforcement ratio (aw/bes); aw is the area of one set of lateral reinforcements in the wall [mm2]; s is the spacing between lateral wall reinforcements [mm]; is the yield strength of the lateral reinforcement in the wall [MPa]; ΣN is the total axial load on the boundary columns [N]; and lw is the distance between the centroids of the boundary columns [mm].
shows a histogram of the shear strength ratios (testVw,Su/calcVw,Su-mean), where the values of testVw,Su were obtained experimentally, and calcVw,Su-mean was calculated using Equation (11). Though Equation (10) defines the mean of Vw,Su, the mean value of testVw,Su/calcVw,Su-mean was approximately 0.86, as shown in . Note that the Japanese Standard equation for Vw,Su generally underestimates the results of experiments on Korean walls, and may need to be modified to reasonably estimate the shear strength of Korean RC walls with boundary columns.
Figure 14. Distribution of the ratios of experimentally measured shear strength to the values calculated using Equation (11).
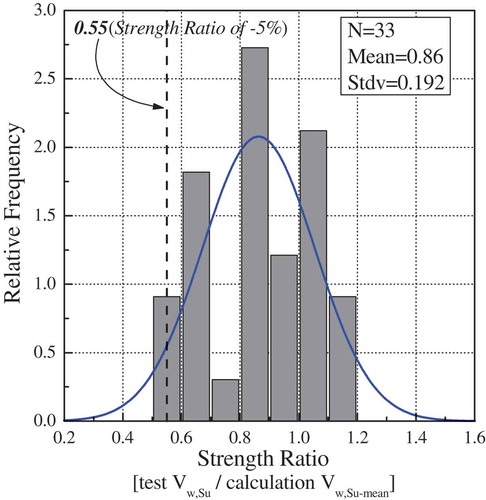
The study modified Equation (12) to provide reasonable estimations of Vw,Su for Korean RC walls, based on the procedure used for Vc,Su. The coefficient of Equation (12), of 0.037, was obtained by multiplying the coefficient from Equation (11), 0.068, by the shear strength ratio, 0.55, which corresponds to – 5% of the distribution curve of the shear strength ratio. The study approximated this by the normal probability density function, as shown in .
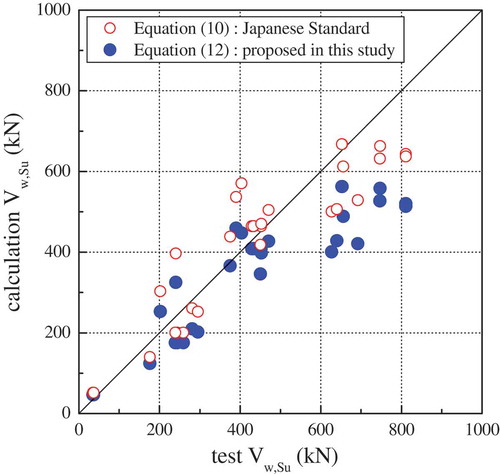
shows the relationship between the experimental values of Vw,Su, those calculated using Equation (12), and those obtained using Equation (10) from the Japanese Standard. As shown in the figure, Equation (12) clearly provides more reasonable estimates of Vw,Su than Equation (10) for Korean buildings because it uses a lower boundary.
Figure 15. Relationship between the experimental values of Vw,Su and those calculated using Equations (10) and (12).
4.3. Ultimate average shear stress of rectangular columns
shows the values of the parameters used to estimate the unit average shear stresses of columns based on the first level procedure. These values were determined statistically based on both technical and engineering considerations. As shown in and , the statistics from 7,256 columns of 26 Korean RC buildings, such as histograms of the tension reinforcement ratios (pt) and the transverse shear reinforcement ratios (pw) of the columns were obtained, respectively.
Figure 16. Distribution of tension reinforcement ratios of Korean RC columns.
Figure 17. Distribution of shear reinforcement ratios of Korean RC columns.
Table 3. Parameters used to estimate the unit average shear stress of columns based on the first level procedure.
Column strength was evaluated using the first level procedure based on the average shear stress and cross-sectional area of each column, which are classified into the following groups;
Short columns with clear height-to-depth ratios less than 2
Short columns with clear height-to-depth ratios between 2 and 6
Short columns with clear height-to-depth ratios greater than 6
Based on the Japanese Standard, the unit average shear stress of columns to be 1.5, 1.0, and 0.7 MPa for height-to-depth ratios less than 2, between 2 and 6, and greater than 6 can be used, respectively. These values were selected conservatively after analyzing the parameters shown in , which were used to evaluate Japanese buildings. This study mainly considered shear and flexural failure modes in these calculations.
shows the shear stress values computed to determine suitable unit shear stresses for Korean columns and those adopted by the Japanese Standard. In the figure, [MPa] and
[MPa] represent unit shear stresses at the flexural and shear failure modes for the clear height-to-depth ratio; these were calculated using the values in based on Equations (13) and (14), which were derived from Equations (5) and (8), respectively.
Figure 18. Unit shear stresses of rectangular columns according to the first level procedure.
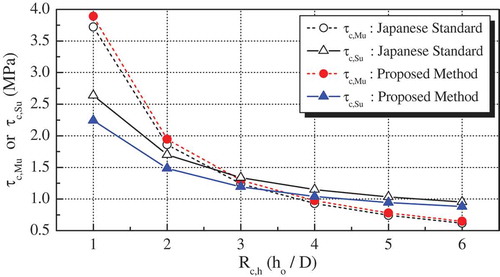
where Vc,Mu is the shear strength in the flexural failure mode, defined 2Mu/ho [kN]; Rc,h is the clear height (ho)-to-depth (D) ratio; and Vc,Su is the ultimate shear strength in the shear failure mode [kN].
This study selected the values of unit shear stress by applying the first level procedure to Korean RC columns based on the values of and
shown in , as follows:
1.4 MPa for Short columns with clear height-to-depth ratios less than 2
0.9 MPa for Short columns with clear height-to-depth ratios between 2 and 6
0.6 MPa for Short columns with clear height-to-depth ratios greater than 6
4.4. Ultimate average shear stress of wall
shows a typical cross section of walls with boundary columns which used to estimate unit average shear stresses when applying the first level procedure. The values shown were selected based on statistics of 26 RC buildings. The strength of walls with boundary columns was evaluated using the first level procedure based on the unit average shear stress and cross-sectional area of the walls. The unit average shear stress to 3.0 MPa when applying the Japanese Standard is used.
Figure 19. Typical cross section of Korean walls with boundary columns.
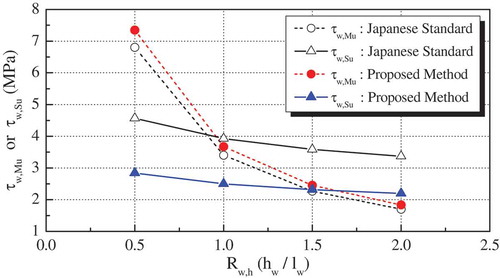
shows the average shear stresses of walls which calculated to assess appropriate unit shear stresses for Korean walls, and the corresponding values for the Japanese Standard. In the figure, [MPa] and
[MPa] represent unit shear stress at the flexural and shear failure modes, respectively, of the walls according to the clear height-to-depth ratio. These values were calculated using Equations (15) and (16), which derived from Equations (9) and (12), respectively. These equations to reflect the typical cross section, shown in , were modified.
where Vw,Mu is the shear strength at the flexural failure mode, defined as 2 Vw,Mu/tlwhw [kN]; Rw,h is hw/lw; and Vw,Su is the ultimate shear strength in the shear failure mode [kN].
Based on the values of and
shown in , the unit shear stress, of 2.0 MPa, using the first level procedure for Korean RC walls with boundary columns was determined. These calculations were based on both technical and engineering considerations.
Figure 20. Unit shear stresses of walls with boundary columns.
5. Evaluation of seismic capacity and safety of RC buildings in Korea based on the proposed basic structural index
In this section, the relationship between the IS of existing RC buildings in Korea evaluated based on the proposed basic structural index (called the proposed method hereafter) and the Japanese Standard is described. A probabilistic method to estimate the structural damage ratios due to future earthquakes is also applied.
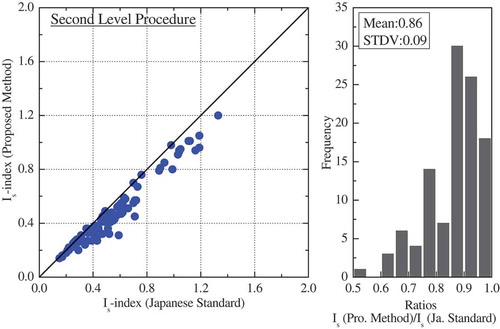
5.1. Relationship between seismic capacity estimated by the proposed method and the Japanese standard
and show the relationship between the seismic capacity indices (Is) estimated using the first and the second level procedures of the proposed method and the Japanese Standard. When calculated using the first level procedure, shown in , Is values generally indicate that capacity is 20% lower when calculated using the proposed method rather than that of the Japanese Standard. This is because the unit average shear stress of the columns according to the first level procedure of the proposed method and Japanese Standard was 0.6 and 0.7 MPa (for columns of Rh > 6), respectively, and the respective values for walls with boundary columns were 2.0 and 3.0 MPa).
When using the second level procedure, Is values of the proposed method are generally 15% lower than those of the Japanese Standard, as shown in . This is because this study used lower bounds, as shown in Equations (8) and (12), when using the proposed method to evaluate suitable ultimate shear strength for Korean columns and walls.
Figure 21. Relationship between Is values (according to the first level procedure) of Korean buildings when calculated using the proposed method and the Japanese Standard.
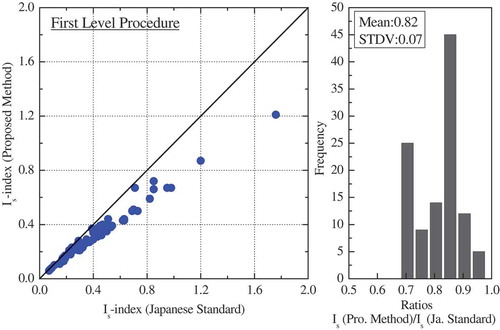
Figure 22. Relationship between Is values (according to the second level procedure) of Korean buildings when calculated using the proposed method and the Japanese Standard.
5.2. Distribution of seismic capacity values
shows the distribution of Is values of Korean RC buildings evaluated by the proposed method and the Japanese Standard, which were also shown earlier in . The study used the second level procedure to plot Is in both directions for each building. As shown in the figure, Is values of Korean buildings have a much narrower distribution when calculated using the proposed method rather than the Japanese Standard. The Is values calculated using the proposed method are lower than those calculated using the Japanese Standard. As mentioned above, this is because the empirical equations approximate the lower bounds of ultimate shear strength.
Figure 23. Distribution of Is values of Korean RC buildings evaluated by the proposed method and the Japanese Standard.
5.3. Distribution of ductility index
shows the distribution of the ductility indices (F) of 14 Korean buildings, which were computed using the proposed method. As mentioned earlier, the Japanese Standard (JBDPA Citation2017, Citation2005) defines the ductility index (F) of a building in terms of the expected ductility μ, which is primarily based on the shear-to-flexural capacity ratio (VSu/VMu).
Figure 24. Ductility index distribution of Korean RC buildings computed by the proposed method.
shows the F-indices of half of the buildings investigated in this study, which varied between 1.4 and 2.3, corresponding to μ = 1.1 to 2.4. The F-indices estimated using the Japanese Standard ranged from 1.8 (μ = 1.6) to 2.6 (μ = 3.3), as shown in . It is seemed that the proposed method provides relatively reasonable results for the ductility indices of Korean RC buildings with hoop spacings wider than 300 mm.
5.4. Probabilistic approach for calculating the structural damage ratio due to future earthquakes
It is widely recognized that structural safety can rarely be evaluated with certainty due to uncertainties in ground motion, the ultimate strength and ductility of structures, and their response to earthquakes, etc., so it should be analyzed probabilistically rather than deterministically. Nakano (Citation1986) and Nakano and Okada (Citation1988) proposed a methodology to assess structural damage ratios due to earthquakes, in which they analyzed the relationship between the seismic capacity and damage ratio due to previous severe earthquakes in Japan. They applied a probabilistic approach to predict the potential damage caused by future earthquakes. The basic concept proposed by Nakano (Citation1986) and Nakano and Okada (Citation1988) to probabilistically assess structural damage ratios due to earthquakes was applied.
5.4.1. Basic concept of assessment of structural damage ratio due to earthquakes
By defining and
, which are the probability density functions of Is and the required seismic capacity, respectively, the damage ratio V, i.e., the ratio of damaged buildings to total buildings, is expressed as follows:
The function is the probability distribution of the required seismic capacity which denote as the ET-index. Therefore, the term in the square bracket represents the probability of failure for structures with Is equal to x. Note that the uncertainty associated with the ground motion is taken into account. This study simplify a discussion by assuming that the seismic capacity of each building is deterministic in Equation (17). Setting
, as shown in Equation (18), the term
can be considered to represent the distribution of the Is values of damaged buildings.
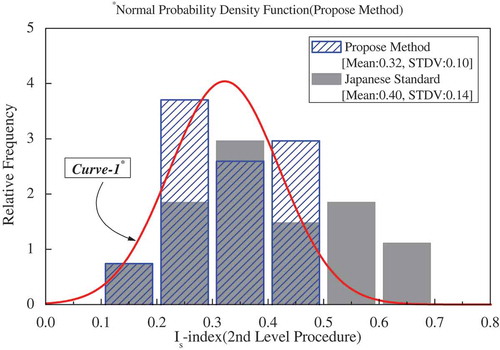
The research estimates the structural damage ratio [V] and distribution of Is values of damaged buildings [] in terms of the probability density function [
] for Korean RC buildings which approximate by a normal probability density function (curve-1 in ), as shown in Equation (19). The study calculated the ET-index [
] using Equation (20), which was derived by Nakano and Okada (Citation1988) based on a normal probability density function.
Note that the ET-index mentioned above is the required seismic capacity of buildings that were moderately or severely damaged by the 1968 Tokachi-oki and 1978 Miyagiken-oki earthquakes (AIJ Citation1968, Citation1980). The acceleration due to gravity was assumed to be approximately 0.23 g at sites and the predominant period was 0.4 s (Umemura, Okada, and Murakami Citation1980).
5.4.2. Structural damage ratios due to future earthquakes
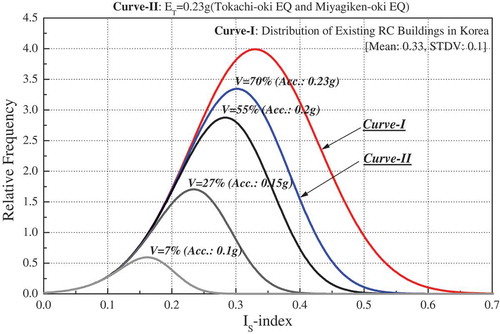
shows the structural damage ratios due to earthquakes and the distribution of Is values of potentially damaged Korean RC buildings (curve-I). These values using Equations (17) and (18) based on the intensities of the 1968 Tokachi-oki and 1978 Miyagiken-oki earthquakes (AIJ Citation1968, Citation1980) were calculated. in Equation (19) and
in Equation (20) were also used. shows the damage ratios due to 0.2 g, 0.15 g and 0.1 g earthquakes which calculated using Equations (17) and (18) (Nakano Citation1986; Nakano and Okada Citation1988). The mean values of
, Equation (20), which scaled by the ground acceleration were also plotted.
As shown in , the structural damage ratio of Korean RC buildings is approximately 70% in the case of earthquakes with the same intensity as the Tokachi-Oki and Miyagiken-oki earthquakes which assumed to be approximately 0.23 g. The damage ratios of Korean buildings due to 0.1 g, 0.15 g, and 0.2 g earthquakes were estimated to be 7%, 27%, and 55%, respectively.
Figure 25. Structural damage ratios of Korean RC buildings due to earthquakes.
6. Concluding remarks
In this study, a method to evaluate the seismic capacity of RC buildings in Korea by reviewing the applicability of the Japanese Standard for Evaluation of Seismic Capacity of Existing Reinforced Concrete Buildings was proposed. The findings can be summarized as follows:
The seismic capacity of RC buildings in Korea was evaluated according to the Japanese Standard
Based on the relationship between the IS values of buildings in Korea and those damaged due to severe earthquakes in Japan, it can be estimated that the Korean buildings investigated in this study would be severely damaged by earthquakes of the intensities that occur in Japan.
Half of the Korean buildings investigated in this study have F-indices between 1.8 (μ = 1.6) and 2.6 (μ = 3.3). It should be noted, however, that the expected ductility of these buildings, particularly the ultimate shear strength, which is the basic parameter used to estimate the ductility, may need to be re-examined. This is due to the fact that most of the buildings investigated herein have hoop spacings wider than 300 mm, so the Japanese Standard may overestimate their ductility.
A modified method for calculating the basic structural index in terms of the ultimate horizontal strength and ductility based on the Japanese Standard was proposed. The ultimate shear strength should be re-examined.
(2) A basic structural index that is suitable for evaluating RC buildings in Korea was proposed
Based on the relationship between the experimental results for Korean buildings and values calculated using the strength equations for the columns and walls from the Japanese Standard, it was determined that the flexural strength equations without modification can be applied. The shear strength equations were modified based on the experimental results, following the same procedure as the Japanese Standard.
The following conservative estimates of unit shear stress were selected when applying the first level procedure to Korean RC columns and walls. The values are based on the statistics of structural characteristics of existing RC buildings, using the proposed ultimate strength equations.
1.4 MPa: for short columns with clear height-to-depth ratios less than 2
0.9 MPa: for short columns with clear height-to-depth ratios between 2 and 6
0.6 MPa: for short columns with clear height-to-depth ratios greater than 6
2.0 MPa: for wall with boundary columns
(3) The Is values of Korean RC buildings were evaluated based on the proposed basic strength index
The Is values of Korean buildings were distributed much more narrowly when calculated using the proposed method rather than the Japanese Standard, and Is values estimated by the proposed method were lower than those estimated by the Japanese Standard.
It is assumed that the ductility indices calculated by the proposed method are more reasonable for Korean RC buildings with hoop spacings wider than 300 mm than those obtained using the Japanese Standard.
The structural damage ratios of Korean RC buildings due to accelerations of 0.1 g, 0.15 g, 0.2 g and 0.23 g were estimated probabilistically to be 7%, 27%, 55% and 70%, respectively.
These findings indicate that the proposed method provides a useful strategy for identifying Korean buildings with seismic vulnerabilities and recommend urgent earthquake preparedness measures. In future research, the value of the seismic index necessary for protecting Korean RC buildings should be determined, and technically sound and cost-effective seismic retrofit schemes should be also developed.
Disclosure statement
No potential conflict of interest was reported by the authors.
Data availability statement
The data described in this article are openly available in the Open Science Framework at DOI:10.17605/OSF.IO/TPA6U.
Additional information
Funding
Notes on contributors
Ju-Seong Jung
Ju-Seong Jung is a PhD candidate at the graduate school of architectural engineering, Hanynag University, Seoul, South Korea. His main research area is seismic capacity evaluation of reinforced concrete structural system.
Kang Seok Lee
Kang Seok Lee is a professor at the department of architectural engineering, Hanynag University, Ansan, South Korea. He received his MS and PhD degrees from the University of Tokyo, Japan. His research interests include seismic capacity evaluation and rehabilitation of concrete structures, seismic risk assessment of urban cities, and optimal structural design.
References
- AIJ. 1968. Report on Damage Due to the 1968 Tokachi-oki Earthquake, 480. Tokyo, Japan: Architectural Institute of Japan.
- AIJ. 2018. Design Code of Reinforced Concrete Buildings, 340. Tokyo, Japan: Architectural Institute of Japan.
- Arakawa, T. 1960. “Study on Shear Mechanisms in R/C Beam.” The Journal of Architectural Institute of Japan 66: 437–440. (In Japanese).
- Architectural Institute of Japan, AIJ. 1980. Report on Damage Due to the 1978 Miyagiken-oki Earthquake. Tokyo, Japan: Architectural Institute of Japan. (in Japanese).
- Etawa, M. A. E., T. Kubo, and K. Ueno. 1998. “Seismic Capacity of Reinforced Concrete Buildings Evaluated Based on the Basic Structural Index and Nonlinear Seismic Analysis: Focused on Buildings Controlled by Shear.” Proceedings of the Architectural Institute of Japan Annual Convention C-2: 63–64.
- Federal Emergency Management Agency, FEMA 310. 1998. Handbook for Seismic Evaluation of Buildings - A Prestandard, 400. Washington, DC: Federal Emergency Management Agency.
- Federal Emergency Management Agency, FEMA 356. 2000. Prestandard and Commentary for Seismic Rehabilitation of Buildings, 450. Washington, DC: Federal Emergency Management Agency.
- JBDPA. 2005. “Standard for Seismic Evaluation of Existing Reinforced Concrete Buildings.” Guidelines for Seismic Retrofit of Existing Reinforced Concrete Buildings, and Technical Manual for Seismic Evaluation and Seismic Retrofit of Existing Reinforced Concrete Buildings, 200. Tokyo, Japan: Japan Building Disaster Prevention Association.
- JBDPA. 2017. Standard for Evaluation of Seismic Capacity of Existing Reinforced Concrete Buildings, 300. Tokyo, Japan: Japan Building Disaster Prevention Association.
- Kubo, T., T. Akagi, K. Ueno, and M. A. E. Etawa. 1998. “Seismic Capacity of Reinforced Concrete Buildings Constituted of Flexural and Shear Failure Members: Seismic Capacity Evaluation of Seismic Screening Standards in Japan.” In Proceedings of the Tenth Japan Earthquake Engineering Symposium, 3273–3278. Yokohama, Kanagawa Prefecture, Japan.
- Kubo, T., and M. A. E. Etawa. 1999. “Seismic Capacity of Reinforced Concrete Buildings Evaluated Based on the Basic Structural Index and Nonlinear Seismic Analysis: Focused on Buildings Controlled by Flexure.” Proceedings of the Architectural Institute of Japan Annual Convention C-2: 269–270.
- Lee, K. S., Y. Nakano, F. Kumazawa, and T. Okada. 1996a. “A Study on Seismic Capacity of Existing Reinforced Concrete Buildings.” Journal of Institute of Industrial Science (Seisan-kenkyu) 48 (11), University of Tokyo: 10–20.
- Lee, K. S., Y. Nakano, F. Kumazawa, and T. Okada. 1996b. “Seismic Capacity of Reinforced Concrete Buildings Damaged by Hyogo-ken Nambu Earthquake 1995 (Seismic Capacity of Reinforced Concrete Buildings in Awaji Island).” Journal of Structural Engineering, Architectural Institute of Japan and Japan Society of Civil Engineers 42B: 55–65.
- Nakano, Y. 1986. “Seismic Capacity of Existing Reinforced Concrete Buildings.” In Proceedings of the Seventh Japan Earthquake Engineering Symposium, 2041–2046. Tokyo, Japan.
- Nakano, Y., and T. Okada. 1988. “Reliability Analysis on Seismic Capacity of Existing Reinforced Concrete Buildings in Japan.” In Proceedings of ninth World Conference Earthquake Engineering, VII333–VII338. Tokyo-Kyoto, Japan.
- Okada, T. 1985. “Seismic Capacity of Existing Reinforced Concrete Buildings and Decision Criteria for Strengthening.” In Proceedings of the First Workshop on Seismic Performance of Existing Buildings, 86–93. Ithaca, New York: Department of Structural Engineering, Cornell University.
- Shiga, T., A. Shibata, and T. Takahashi. 1968. “Earthquake Damage and Wall Index of Reinforced Concrete Buildings.” Proceedings of Tohoku District Symposium of Architectural Institute of Japan 12: 29–32.
- SPRC Committee. 1980. Computational Program for Seismic Evaluation of Existing Reinforced Concrete Buildings (Screen Edition-2). Tokyo, Japan: Japan Building Disaster Prevention Association.
- Umemura, H., T. Okada, and M. Murakami. 1980. “Protection Index for the Seismic Capacity Evaluation Standard of Reinforced Concrete Buildings.” In Annual Convention of Architectural Institute of Japan, 1537–1538. (In Japanese). Tokyo, Japan.
- Yi, W. H., K. S. Lee, D. E. Kang, and H. B. Jeong. 2000. “Seismic Capacity of Existing Reinforced Concrete Buildings in Korea.” The Fall Convention of Earthquake Engineering Society of Korea, 29: 278–287. (in Korean).