
 ?Mathematical formulae have been encoded as MathML and are displayed in this HTML version using MathJax in order to improve their display. Uncheck the box to turn MathJax off. This feature requires Javascript. Click on a formula to zoom.
ABSTRACT
Renovation work on deteriorated multi-family houses (MFHs) is often undertaken to improve their physical performance. However, due to uncertainties in economic benefits from renovation, many MFHs frequently withdraw their renovation plans in South Korea. Despite this problem, there has been very little research on countering this issue. With this background, this study aims to develop a model for predicting the price change patterns (MPPCP) of deteriorated MFHs upon renovation in South Korea. An artificial neural network (ANN)-based MPPCP was developed to detect the relationship between project attributes and price change patterns due to renovations. By combining the parameters of the ANN method, 108 candidate models were identified and a final MPPCP was proposed after conducting simulation tests to verify the level of correct for the candidate`s models. The results of model application to actual MFH renovation cases show that the developed model can facilitate a project owner’s decision-making by estimating price change patterns for the deteriorated MFH in the project planning stage itself.
1. Introduction
1.1. Research background and objectives
According to a report by the Construction & Economy Research Institute of Korea (CERIK), in addition to physical deterioration of multi-family houses (MFHs), their social performance is experiencing rapid changes due to changes in lifestyle and population structure in South Korea (Yoon and Lee, Citation2012). Renovation and reconstruction are considered attractive solutions to counter this physical and social deterioration. From the point of view of low-carbon green construction, renovation is gaining much attention as it imposes less environmental burden.
However, in spite of the positive effect of less environmental pollution, the current status of renovations for deteriorated MFHs is poor. According to the Korea Remodeling Association (KRA), in 2011, only 3% (104,803 households) of 3,177,000 deteriorated households considered renovation and of these, 77% later cancelled their renovation plans (KRA Citation2011). According to Kim, Choi, and Kim (Citation2010), Cho et al. (Citation2012), and Kim et al. (Citation2013), the reasons for abandoning MFH renovations in South Korea are primarily the uncertainty in economic profit after renovation and difficulty in securing the feasibility due to high building costs.
Economic benefit from renovation is very important to not only evaluate the success or failure of a project but also decide whether or not to undertake renovation work (Cho and Yoon Citation2016; Kim et al. Citation2018; Cho, Kim, and Kim Citation2019). However, most of the existing studies on the economic efficiency of MFH renovation projects analyzed economic efficiency only in terms of input cost, such as construction costs (Lee Citation2005; Lee et al. Citation2007; Han and Shin Citation2012; Yeon et al. Citation2014; Kim and Baik Citation2015). Some existing studies have been conducted for typical MFHs in estimating their price or in identifying the factors influencing the price. However, most of these studies have attempted to estimate the price for new and existing MFHs, mainly using the method based on the typical building appraisal methods compensated by referring to the transaction cases (Kim, Cho, and Kim Citation2016).
Therefore, due to the above limitation, it is highly difficult to evaluate the economic effect of renovations, which is one of the main concerns of property owners considering renovating their deteriorated MFHs; this is also a major reason for owners cancelling their renovation plans in South Korea. In this study, we aim to develop a method for evaluating the economic benefit, represented by changes in the monetary price of MFHs in South Korea, post renovation. It is expected that the results of this study would help facilitate decision-making with respect to renovation projects.
1.2. Research methodologies
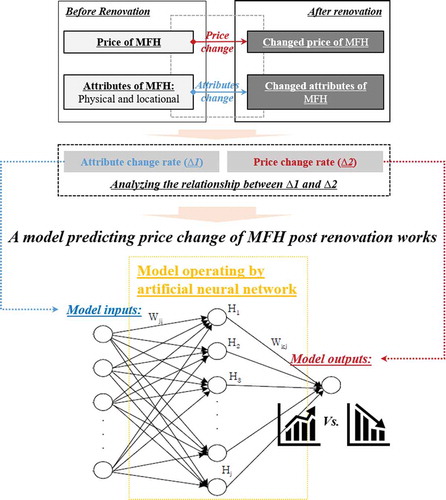
The implementation procedure of the economic effect analysis model developed in this study is depicted in . One of the main aspects in developing the model lies in analyzing the relationship between attribute changes and price changes of a given MFH upon renovation. In other words, renovation work on a deteriorated MFH causes changes in its physical attributes and monetary value. Moreover, if the relationship between the two sets of changes can be structured using scientific and objective methodologies, it is possible to predict price changes in the MFH post renovation according to variations in the project’s attributes corresponding to the renovation plan. With this objective in mind, 120 MFH cases were selected to gather data required for analyzing changes in their attributes and monetary values after renovation; an artificial neural network (ANN) method was adopted to structure the relationship between the two changes objectively. As shown in , the attribute change rate (△1) and corresponding price change rate (△2) were utilized as inputs and out variables for implementing ANN method. Through the above process, this research could propose an ANN-based model predicting price change of MFH post renovation works.
Figure 1. Model framework.
2. Analysis of price changes due to renovations
It is possible to analyse the economic effect of renovations on MFHs by evaluating trends in price changes of the MFH before and after renovation.
2.1. Analysis of price changes due to renovations
Generally, the price of an MFH is influenced by various factors, including location, convenience of transportation, and educational environment (Choi and Song Citation2006; Jin et al. Citation2012; Kim, Cho, and Kim Citation2016). As price changes due to renovation must be measured, the factors above should be controlled while assessing price changes. In other words, price change assessment due to renovations may follow the concept of “relative price” for the renovated MFH on the similar comparative cases, which aims at excluding other price-influencing factors.
Therefore, a comparative case with location and size similar to those of the renovation case should be selected; the price of the renovation case should be assessed relative to the comparison case at three time points (before renovation, after renovation, and present). From the obtained results, one can be sure that the relative price change between the price of the renovated MFH and that of the comparative MFH is due to renovations. The relative price ratio can be calculated using Equations (1–1), (1–2), and (1–3). RCk and CCjk denote renovation case k and comparative case j for RCk, respectively.
Here, = price rate of renovation case (RC) k on comparative case (CC) j before renovation,
= price rate of
on
after renovation,
= price rate of
on
at present,
= renovation case k, and
= comparative case j for RCk.
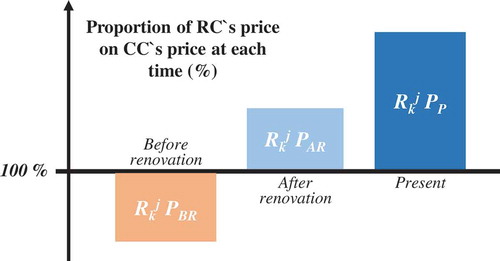
Using the above method, it is possible to analyse price change patterns for an MFH upon renovation; furthermore, the economic effect of renovation can be grasped objectively. As shown in , if the price after renovation is higher than that before renovation, it can be considered that renovations have a positive influence on the monetary value of the MFH.
Figure 2. Example of positive price changes due to renovation.
2.2. Collection of renovation cases and comparative cases
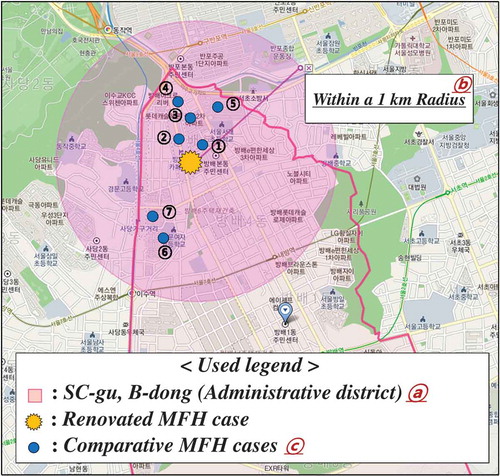
A total of 17 renovated MFH cases, all of which were located in Seoul, were considered in this study. As shown in , in most of these cases, the household unit area increased upon renovation, which took about 1 to 2 years. In some cases, vertical expansion was conducted by increasing the number of floors; most of these structures were constructed around 1970 and about 25 years later, they required renovations for improving building performance in terms of energy, physical appearance, and economic performance. Furthermore, as described above, comparative MFH cases were selected for each renovated MFH case selected using a 2-step criterion as follows (see ). In Step 1, an MFH located in the same administrative district as the renovation case was selected to control the effect on price by location, which has a highly significant effect on MFH price (see ⓐ in ). If the area of the administrative district is too wide, MFHs located within a radius of 1 km from the renovated MFH are selected as comparative candidates (see ⓑ in ). In the second step, because price is also influenced by the household unit area of the MFH, a case with similar unit area was selected from among the candidates screened in the first step as the comparative case (see ⓒ in ).
Table 1. Renovation cases.
Figure 3. Selection example of comparative cases.
In accordance with the above criteria, 103 comparative MFH cases were collected for 17 renovated MFH cases (see ). As shown in the table, each comparative case had an area similar to that of the household unit area of the renovation case. For example, the household unit area of RC7 was 186.12 m2 while that of comparative cases CC71 to CC74 was 177.62, 147.48, 180.20, and 196.71 m2, respectively. A minimum of two comparison cases (for RC11 and RC12) were selected for each renovation case while the maximum was 10 (for RC13).
Table 2. Comparative cases for each renovation case.
Although comparative cases in similar areas were selected in most cases, some comparative cases (i.e., CC37, CC112, and CC168) exhibited significant differences in a unit area. Despite the area difference, because they were located very close to the renovation case, it is meaningful to compare their price data with that of renovation cases. Price data at the three selected time points were collected through the Declared price of real estate in Korea inquiry system (Ministry of Land, Infrastructure, and Transport, Citation2016).
2.3. Analysis of price change patterns due to renovation work
In this study, we collected price data at three time points (before renovation, after renovation, and present) for selected renovation and comparison cases. Using this data, the impact of renovation on MFH prices can be assessed. shows an example of such evaluation for Renovation Case 1. The table shows price information on renovation case RC1 and its comparative cases CC11 to CC14 at the three selected time points as well as the price ratio of RC to CC, which can be used to analyse relative price change trends upon renovation. As shown in the table, a total of four relative price changes could be observed (i.e., changes in the prices of the renovation and comparative cases. The price change of RC1 as compared to CC11 to CC14 shows that its current relative price is greater than its relative price before renovations, which means that renovations exerted a positive influence on its price.
Table 3. An example showing the calculation of price ratio for each union case.
To improve conveyance of the concept “the relative price” of each renovation case at three time points, the combination of the renovation case and the equivalent comparative case is expressed as a union (Ujk) as shown in Equation 2. As described earlier, using 17 renovation cases and 103 comparison cases, 103 combinations were created and these combinations can be expressed as follows.
For example, as shown in , the four combinations referred to for RC1 can be expressed as U11, U12, U13, and U14 (see Union cases in ).
After studying the price change trends of these 103 unions, three price change patterns could be identified (see ). The first price change pattern was the constantly increasing pattern, which means that the price of the renovation case before renovation was lower than that of comparative cases but it was higher than that of comparative cases after renovations. For example, the price change trends of three union cases (U12, U13, and U14) described in follow this pattern. These patterns can be diagrammatically represented as shown in ); 30 cases were found to follow this pattern. In the second price change pattern, the price of the renovation case before renovation was lower than that of comparative cases, but it rose significantly after renovation and this tendency were sustained (), 49 cases). In the third pattern, the price of the renovation case before renovation was lower than that of comparative cases and it increased slightly after renovation, but this increase was not sustained (), 21 cases). Meanwhile, the remaining 3 cases of 103 cases showed patterns different from those described above and these trends were not classified as they were few in number.
Figure 4. Three deduced price change patterns and union cases following each pattern. (a). Pattern I. (b). Pattern II. (c). Pattern III.
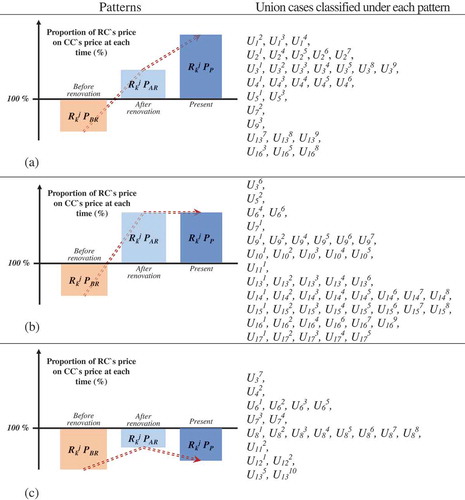
The three meaningful price change patterns can be expressed as Pattern I (Equation 3–1), Pattern II (Equation 3–2), and Pattern III (Equation 3–3). Pattern I and Pattern II have positive economic effects upon renovation while Pattern III shows that the economic benefit due to renovation is insufficient.
3. Development of a model for predicting price change patterns after renovation on MFHs
The derived patterns provide information that helps in deciding whether or not to perform renovations on deteriorated MFHs. If an MFH for which renovation is being considered follows Pattern I or II in terms of price change, renovations may be undertaken. However, if Pattern III is predicted, it may be better not to proceed with renovation for that MFH. Keeping these aspects in mind, this study intends to develop a model that can predict price change patterns after renovating a deteriorated MFH. Using this model, MFH owners will be able to evaluate the pattern of price changes in the renovation planning stage itself, which would help in better decision-making.
3.1. Network architecture
The model for predicting price change patterns (MPPCP) in MFHs upon renovation includes the following processes, as described earlier in – (1) inputting attribute values of the target MFH corresponding to the renovation plan and (2) predicting price change patterns of the MFH due to renovation. To yield this output, the MPPCP model is required to analyse the relationship between property value (i.e., attributes) due to renovation and price change patterns. During the process of identifying the relationship, this study first attempted to analyze it using multivariate data analysis methods (e.g., regression analysis, decision tree method, etc.) that are implemented based on mathematical analysis, but there was a limitation to mathematically generalizing the relationship. Therefore, the authors focused only on developing a method to predict the price change patterns of renovated MFHs using 19 attributes. In this context, a methodology for defining complex nonlinear relationships with 19 input variables (attributes) and 3 output variables (price change patterns) was required to achieve the research goal.
According to Patel and Jha (Citation2016) and Kim (Citation2004), the artificial neural network (ANN) theory can be effectively applied when a complex nonlinear relationship exists between several input and output variables. In addition, it is not necessary to identify a mathematical relationship between variables that affect the output variable, and there is no limit to the number of input variables; thus, there is no need to select appropriate variables (Kim Citation2004). For these reasons, the ANN method is widely used in the field of construction management, and this research developed the MPPCP model using the ANN method.
To develop the ANN-based MPPCP model, input and output variables should be defined. As described earlier, the input variable is set to the attribute value of MFH due to renovation and the output variable is set to the price change pattern described in Equations 3–1, and 3–3. To set the input variables, it is necessary to define the attributes that affect the price of the renovated MFH. Kim, Cho, and Kim (Citation2016), which is a previous study of this research, proposed 19 parameters that affect the price of the renovated MFH in two stages. First, dozens of candidate influencers were derived through an analysis of 23 previous studies dealing with factors influencing the price of general MFHs. Then, a correlation analysis was conducted to identify the relationship between these candidates and price of the renovated MFH; 19 parameters were found to have a significant influence on the price of the renovated MFH. By adopting these parameters, 19 factors that influence the price of renovated MFHs were selected as input variables; these include (1) household unit area, (2) gross floor area, (3) building footprint, (4) number of unit houses, (5) number of floors, (6) years elapsed since construction, (7) type of heating system, (8) reputation of the construction company, (9) number of parking lots, (10) unit plan, (11) administrative district, (12) number of rooms in a household unit, (13) number of convenience facilities near the MFH, (14) distance to the nearest metro station, (15) educational environment, (16) distance to the neighbourhood park, (17) distance to the bus stop, (18) distance to the general hospital, and (19) view from each unit.
To use the above-stated 19 attributes as model input variables, the ratio of relative attribute values was calculated in the same way the relative price ratio was calculated for price change pattern analysis. In other words, if an arbitrary attribute i chosen from the list of 19 attributes given above is referred to as mi, the attribute value of the union case (i.e., the attribute value of renovation case RCk with the comparative case CCkj) can be estimated using Equation (4). shows an example of relative attribute values for 30 cases belonging to Pattern I.
Table 4. Example of attribute ratios for each union case.
3.2. Design parameters and training criteria
To develop MPPCP using ANN, the structure of ANN and various parameters that determine said structure are defined, as shown in . To determine the values of these parameters, empirical methods and genetic algorithms can be used (Hegazy, Fazio, and Moselhi Citation1994). In this study, we used empirical methods. In addition, to operate the ANN, the activation function must be determined. The activation function serves to activate the input signal value in a certain neuron to the input value of the neuron in the hidden layer or the output layer. We found the sigmoid function to be suitable for our study as the input and output variables are nonlinear. In addition, because the sigmoid function is in the range of 0 to 1, it is possible to solve the problem of one neuron dominating the entire operation of the neural network (Kim Citation2004).
Table 5. ANN model parameters and implementation design.
Next, it is necessary to determine the number of hidden layers. In this study, as the input and output variables are not complicated, it is considered that sufficient learning can be achieved by determining the number of hidden layers by one or two. According to the criteria laid down by Hegazy, Fazio, and Moselhi (Citation1994) for determining the number of nodes in hidden layers, in this investigation, we developed three alternatives in the number of nodes as follows – (i) the number of input variables (i.e., 19 nodes), (ii) the number corresponding to 75% of the number of input variables (i.e., 17 nodes), and (iii) twice the number of input variables and then plus one (i.e., 39 nodes).
Finally, it is necessary to set the learning rate and momentum constant. In general, it is not known whether certain values of learning rate and momentum constant guarantee proper neural network learning (Cho, Seo, and Kang Citation2002). Therefore, to generate various alternatives to derive the optimal ANN model, the learning rate and momentum were determined according to the criteria applied by Cho, Seo, and Kang (Citation2002) and Shim, Cho, and Lee (Citation2007). The learning rate was set at 0.3, 0.6, and 0.9 while the momentum constant was set at 0.7, 0.8, and 0.9. In addition, the error back-propagation algorithm was applied to the learning of the ANN model developed in this study. This algorithm is based on the Delta rule that learns in the direction of decreasing the error value using the difference between the user-specified target value and learning output value.
Meanwhile, the ANN model was developed and analysed using the SPSS V23® package (SPSS V 23), a commercially available neural network analysis and modelling software. Thus, the settings for the remained parameters required for implementing the ANN model, including training options and stopping rules, were adopted as the setting values on the SPSS software.
3.3. ANN model building
Based on the set parameters, an ANN-based MPPCP was constructed. In general, to operate a prediction model using ANN, it is necessary to divide the collected data into two groups – (i) a set of learning data for constructing a neural network structure and (ii) a data set for model verification. At this time, a data set must be formulated to prevent excessive learning along with a cross-validation data set (Kim Citation2004). Therefore, we classified 100 union cases into case sets for learning, cross-validation, and testing. In this study, because there are many types of input variables (i.e., 19 MFH attributes) but the amount of data is relatively small, (i) the proportion of the learning case set was relatively high for normalization of learning and (ii) the proportion of verification case sets was also increased as there are three types of output variables (i.e., Patterns I, II, and III). Accordingly, the collected union cases for learning, cross-validation, and verification were set at 73%, 11%, and 16%, respectively. Meanwhile, for the operation of the model, Patterns I, II, and III are coded nominally as 1, 2, and 3, respectively.
4. Model validation and discussion
4.1. Evaluation of the ANN model
The input and output variables of case learning and cross-validation sets were input to the ANN model. By controlling each parameter, a total of 108 model candidates were constructed. After stopping the learning of the model, based on 16 union cases for model verification, the level of correct between actual patterns and the model-predicted patterns were calculated. As shown in , 108 model candidates were developed through a trial and error method for each parameter. Of these, candidates 8, 10, 31, 37, and 51 exhibited a 93.80% of the level of correct and thus these five candidates were named as Models 1 to 5. Subsequently, additional analysis was performed to find the best prediction model among the five chosen models. In order to find the optimal model among these, in this study, the receiver operating characteristic (ROC) and level of correct according to variation of data set number were further evaluated. Recently, in many previous studies adopting ANN method, ROC curve analysis can be used to fine a model with best classifier performance.
Table 6. Level of correct analysis for each trial depending on parameter variation.
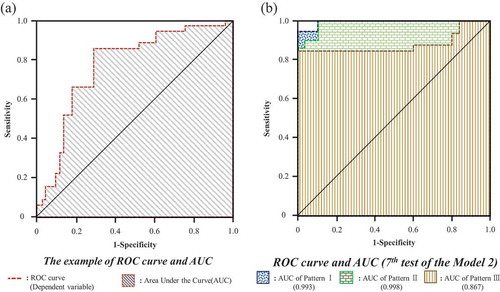
) shows an example ROC curve. These curves are commonly used to analyse the trade-off between sensitivity and specificity of classifiers across different classification thresholds. In general, the more accurate an ANN-based model is, the farther away the ROC curve is from the 45° diagonal, as shown in ). Thus, for a very good model, the ROC curve appears close to a square. The area under the ROC curve (AUC) can be used to characterise the overall discrimination of a classification model. The closer the value of AUC is to 1, the better is the distinction between different classes (Shenfield, Day, and Ayesh Citation2018; Yu, Ye, and Xiang Citation2016). With this background, with cases extracted randomly from 100 union cases, this study evaluated how accurately the five models classified the patterns of the extracted cases and compared them to their actual patterns using the AUC analysis method. Based on the composition ratio (i.e., 73% for learning, 11% for cross-validation, and 16% for verification) of the 100 union cases used for developing the models, as shown in , 10 simulations were carried out to verify how the developed five models distinguish the extracted cases according to their actual patterns; in these simulations, the number of data sets for each ANN implementation was varied randomly. ) shows the ROC curve of Model 2 and its corresponding AUC under the seventh simulation condition in . As shown in the figure, under the seventh simulation condition, the AUC value was 0.993 for pattern I, 0.998 for pattern II, and 0.867 for pattern III, which confirms that classification by pattern using Model 2 is preferable. Using the same process, it was found that the average AUC value for each model during 10 simulations was over 0.9 in all the models as shown in the table. According to the testing criterion set by Tserng et al. (Citation2011) (if AUC ≥ 0.9, it implies an outstanding discrimination), this result implies that pattern classification by all the tested models is highly desirable.
Table 7. ROC analysis results and level of correct for each model.
Figure 5. Example of ROC and AUC analysis. (a). ROC and AUC. (b). ROC and AUC in the 7th test using Model 2.
In addition to AUC analysis, based on randomly extracted cases for model verification on each simulation, the level of correct between actual patterns and model-predicted patterns was calculated. As shown in , for example, Model 1 predicted patterns with 76.5% accuracy for simulation test 1 wherein the model was implemented 17 times based on 17 random verification cases. Furthermore, Model 1 shows an average accuracy of 69.1% during 10 simulations. Similarly, the average level of correct was 69.1% for Model 1, 72.2% for Model 2, 66.6% for Model 3, 69.9% for Model 4, and 71.1% for Model 5.
Because Model 2 shows outstanding pattern discrimination ability (AUC analysis) and its accuracy of prediction for random cases is superior to that of other models (72.2% of accuracy), Model 2 was finally selected as the MPPCP. shows the parameters and performances of the proposed model.
Table 8. MPPCP properties.
4.2. Model application and discussion
To evaluate the applicability of the MPPCP, this study applied the chosen model on an MFH planning actual renovation works. The MFH considering renovation work was built in 1992 in Seoul, South Korea. To apply the MPPCP model, 10 comparative cases of similar size were selected.
To implement MPPCP, it is necessary to calculate various attribute values of the renovation case and use them against those of comparison cases as model input values. Using Equation 4, the relative ratio values for 19 attributes of 10 union cases, which combine the renovation and comparative cases, are derived (). After providing the input values of each case to the MPPCP, it predicted price change patterns, as listed in . As can be seen in the table, the model predicted that Cases 1, 3, and 9 follow Pattern I and the remaining 7 cases follow Pattern II. Therefore, it can be inferred that (i) the MFH undergoing renovations is currently lower in price as compared to the 10 comparative cases, (ii) renovations on the MFH will result in a higher price as compared to the prices of the comparative cases, and (iii) the price will continue to increase in the future (Pattern I) or the increased price will be maintained (Pattern II).
Table 9. Model application & predicted patterns.
Meanwhile, 10 cases could be divided into two groups: a group including cases 1, 3, and 9 that predicted Pattern I and another group predicting Pattern II. In order to identify which attributes can significantly influence the pattern prediction, the average value of each attribute in the two groups was evaluated. As a result, “m6(years elapsed since construction),” “m1(household unit area),” and “m9(number of parking lots)” were detected as the critical attributes, because the difference in the average values for the three attributes between the two groups were evaluated as significant. For example, the average value of m6 for group 1 was about 141.33% (i.e., (192 +156 +76)/3), while the average value of m6 for group 2 was 79.14% (i.e., (83 +78 +69 +74 +100 +76 +74)/7). The gap for this attribute was remarkable, and it could be interpreted that the years elapsed since the MFH’s construction increased; the renovation of such an MFH could be expected to yield economic benefit. Similarly, if the MFH has a relatively small house unit area (m1, 47.00% of group 1 and 75.57% of group 2) and number of parking lots (m9, 77.33% of group 1 and 133.71% of group 2) compared to the surrounding cases, such an MFH could be regarded a good candidate for renovation in terms of economic value increase.
Based on the above application results, this research enables decision-makers to grasp the economic effect of MFH renovation and it is expected that they would be able to decide whether or not to carry out renovations.
5. Conclusion
Interest in the renovation of deteriorated MFHs has been growing in recent years. However, many MFH owners cancel their renovation plans as economic advantages after renovation are often not guaranteed. Although the economic effects of a renovation project are very important for its success or failure and in making decisions on the fate of the project, existing literature on this topic is minimal. Therefore, in this study, we developed a model (MPPCP) that can predict the economic effects of renovation on older MFHs. The effects of renovation were evaluated based on price changes at three time points (before renovation, after renovation, and present) and price changes due to renovation were measured by measuring relative price changes with respect to surrounding comparison cases.
The MPPCP developed in this study was based on the ANN technique. To develop the model, 17 renovation cases and 103 comparison cases were considered for retrieving attribute data and price data. From the collected data, (i) the price change pattern of renovation cases at three time points was analysed and (ii) relative attribute values corresponding to 19 parameters after renovation were calculated. Furthermore, the relationship between price change patterns and these attributes was derived using the ANN method. During the process of applying the ANN method, parameters required to apply the ANN were designed to generate model candidates and finally 108 candidate models were detected by combining various parameters that define the ANN method. From these candidates, five models with relatively high prediction accuracy were selected. Subsequently, by analysing AUC and the level of correct for randomly retrieved verification cases, the final model MPPCP with the highest prediction accuracy was derived.
After applying the selected model to the deteriorated MFH which is currently planning a renovation, it is shown that the price change pattern of the MFH after the renovation is well predicted positively. Using the MPPCP presented in this study, it is possible to predict price change patterns that would be experienced by MFHs upon renovation. Such prediction can be done at the renovation planning stage, which would be of great help to the MFH owner in coming to a decision. In future, based on additional collections of renovation cases and their comparative cases, a model for predicting price changes, and not only price change patterns, due to renovations should be developed.
Acknowledgments
This work was supported by the research funds from Chosun University, 2018.
Disclosure statement
No potential conflict of interest was reported by the authors.
Additional information
Notes on contributors
Kyuman Cho
Dr. Kyuman Cho is an Associate Professor in the School of Architecture at Chosun University. Before joining Chosun University, he was a Post-doctoral research fellow at Purdue University in USA and worked as a Practicing engineer in construction industry. He has published about 80 journal papers and peer-reviewed conference papers, related to Construction Engineering and Management. His primary research areas include Economic analysis on construction systems, Building renovation techniques, and Automation in construction operation.
Jaesung Kim
Jaesung Kim is a Graduate research assistant in the School of Architectural Engineering at Chosun University. His primary research areas include construction engineering and management, building renovation, and cost estimation in the project early phase.
Taehoon Kim
Taehoon Kim received Ph.D. in Civil, Environmental and Architectural Engineering from the Korea University. Since, 2015, he is an assistant professor at the School of Architecture of Chosun University. His research interests are focused on introducing advanced construction methods and technologies for improving construction productivity. He recently conducted a research project on developing a process management technique for efficient construction automation system.
Taehoon Hong
Dr. Taehoon Hong is Underwood Distinguished Professor of Department of Architecture and Architectural Engineering at Yonsei University. He is the Associate Editor of Renewable & Sustainable Energy Reviews, Elsevier and Journal of Management in Engineering, ASCE. He is an editorial board member of Applied Energy, Elsevier as well as Energy and Buildings, Elsevier. He is also an Associate Editor of Sustainable Design and Construction, Frontiers in Built Environment. Dr. Hong’s current research topics include renewable energy system, energy performance, solar photovoltaic system, indoor environmental quality, and sustainable building.
References
- Cho, H. H., D. S. Seo, and K. I. Kang. 2002. “Development of Building Construction Cost Forecasting Model Using Artificial Neural Networks.” Journal of the Architectural Institute of Korea Structure & Construction 18 (8): 107–114. http://www.dbpia.co.kr/Article/NODE00365731
- Cho, J. Y., K. W. Lee, H. S. Yoo, and Y. S. Kim. 2012. “A Study on Vitalizing Plans of Extension Remodeling for Apartment Housings.” Korea Journal of Construction Engineering and Management 13 (4): 33–47. doi:10.6106/KJCEM.2012.13.4.033.
- Cho, K., J. Kim, and T. Kim. 2019. “Decision Support Method for Estimating Monetary Value of Post-renovation Office Buildings.” Canadian Journal of Civil Engineering online published 46: 1103–1113. doi:10.1139/cjce-2017-0692.
- Cho, K., and Y. Yoon. 2016. “Decision Support Model for Determining Cost-effective Renovation Time.” Journal of Management in Engineering, ASCE 32 (3): 04015051. doi:10.1061/(ASCE)ME.1943-5479.0000418.
- Choi, Y. A., and B. H. Song. 2006. “A Study on the Characteristics of the Price Factors in Apartment Houses.” Journal of the Korean Housing Association 18 (2): 75–82. http://www.dbpia.co.kr/Article/NODE00780984
- Han, J. Y., and D. W. Shin. 2012. “A Study on the Story Increase for Securing the Feasibility of Aged-housing Remodeling.” Korea Journal of Construction Engineering and Management 13 (3): 152–159. doi:10.6106/KJCEM.2012.13.3.152.
- Hegazy, T., P. Fazio, and O. Moselhi. 1994. “Developing Practical Neural Network Applications Using Back-propagation.” Computer-Aided Civil and Infrastructure Engineering 9 (2): 145–159. doi:10.1111/j.1467-8667.1994.tb00369.x.
- Jin, R., K. Cho, C. Hyun, and M. Son. 2012. “MRA-based CBR Model for Cost Prediction in the Early Stage of Construction Project.” Expert Systems with Applications 39 (5): 5214–5222. doi:10.1016/j.eswa.2011.11.018.
- Kim, D. J., Y. J. Choi, and G. Y. Kim. 2010. “A Study on the Agreement Rate Encouraging Restriction Factor or Multi-family Housing Remodeling.” Korea Journal of Construction Engineering and Management 11 (1): 122–129. doi:10.6106/KJCEM.2010.11.1.122.
- Kim, G.-H. 2004. “Construction Cost Prediction System Based on Artificial Intelligence at the Project Planning Stage.” PhD diss., Korea University.
- Kim, J., K. Cho, and T. Kim. 2016. “Factors Determining the Price of Remodeled Multi-family Housing.” Korea Journal of Construction Engineering and Management 17 (3): 13–22. doi:10.6106/KJCEM.2016.17.3.013.
- Kim, J., K. Cho, T. Kim, and Y. Yoon. 2018. “Predicting the Monetary Value of Office Property Post Renovation Work.” Journal of Urban Planning and Development, ASCE 144 (2): 04018007. doi:10.1061/(ASCE)UP.1943-5444.0000434.
- Kim, K. H., and H. S. Baik. 2015. “Comparative Analysis between RSMeans and Standard Estimating System for Selective Finish Demolition in Remodeling Projects.” Journal of the Architectural Institute of Korea Structure & Construction 31 (3): 73–80. doi:10.5659/JAIK_SC.2015.31.3.73.
- Kim, W. H., H. S. Cha, D. W. Shin, and K. R. Kim. 2013. “Profit/Cost Prediction Model for Economic Feasibility Assessment on Aged-housing Remodeling Projects.” Journal of the Architectural Institute of Korea Structure & Construction 29 (4): 85–92. http://www.dbpia.co.kr/Article/NODE02148676
- Korea remodeling association. 2011. The Institutional Improvement Committee Seminar. Seoul: Republic of Korea.
- Lee, J. B. 2005. “Economic Analysis and Preference Study on Apartments according to Business Method.” Journal of the Architectural Institute of Korea Structure & Construction 21 (8): 137–144. http://www.dbpia.co.kr/Article/NODE00618931
- Lee, K. S., K. H. Kim., K. R. Kim., and D. W. Shin. 2007. “Profitability Influence Factor Analysis by Apartment Remodeling Case Study.” Korea Journal of Construction Engineering and Management 8 (2): 127–135. http://www.ndsl.kr/ndsl/search/detail/article/articleSearchResultDetail.do?cn=JAKO200734515087128
- Ministry of land, infrastructure and transport. 2016. “Declared Price of Real Estate in Korea Inquiry System.” Accessed January 2016. http://www.realtyprice.kr/notice/
- Patel, D. A., and K. N. Jha. 2016. “Evaluation of Construction Projects Based on the Safe Work Behavior of Co-employees through a Neural Network Model.” Journal of the Safety Science 89: 240–248. doi:10.1016/j.ssci.2016.06.020.
- Shenfield, A., D. Day, and A. Ayesh. 2018. “Intelligent Intrusion Detection Systems Using Artificial Neural Networks.” ICT Express 4 (2): 95–99. doi:10.1016/j.icte.2018.04.003.
- Shim, J. H., C. H. Cho, and S. H. Lee. 2007. “The Industrial Land Price Appraisal Based on Artificial Neural Network.” Journal of the Korea Planning Association 42 (5): 223–232. http://www.dbpia.co.kr/Article/NODE00914539
- Tserng, H. P., G. F. Lin, L. K. Tsai, and P. C. Chen. 2011. “An Enforced Support Vector Machine Model for Construction Contractor Default Prediction.” Automation in Construction 20 (7): 837–863. doi:10.1016/j.autcon.2011.03.002.
- Yeon, J. H., H. S. Lee, M. S. Park, S. Y. Kim, and J. S. Ahn. 2014. “Feasibility Study on Remodeling Project by Using Real Option Model: Focusing on Apartment House Remodeling.” Korea Journal of Construction Engineering and Management 15 (1): 39–50. doi:10.6106/KJCEM.2014.15.1.039.
- Yoon, Y. S., and S. W. Lee. 2012. “Report: System Improvement Plan for Revitalization Remodeling of the Aging Multi-Family Housing.” Construction & Economy Research Institute of Korea(CERIK).
- Yu, X., C. Ye, and L. Xiang. 2016. “Application of Artificial Neural Network in the Diagnostic System of Osteoporosis.” Neurocomputing 214: 376–381. doi:10.1016/j.neucom.2016.06.023.