
ABSTRACT
In the background of rapid urban development in China, several detached houses have been built. The style, local surroundings, and other physical characteristics of these houses are constantly changing, which provides ample samples for the study of the visual preference evaluation of Chinese detached houses. With the detached houses in Jiangsu province, China, as the research object, the architectural style, height-width ratio, window-wall ratio, and local surroundings were set as the physical characteristics of detached houses. A photo stimulation experiment was conducted with different types of participants, the findings of which were then collected and analyzed. The study indicates that architectural style, height-width ratio, window-wall ratio, and local surroundings are the main factors that influence people’s visual preference evaluation of detached houses; people of different categories produce different visual preference evaluations of detached houses. This study offers a valuable reference for the design of Chinese detached houses.
1. Introduction
1.1. Detached houses
A detached house in China refers to a permanent single-family residence that to a large degree can isolate external interference and protect the privacy of the house-owners. With good lighting in every room, the residential quality is highly guaranteed. As the Chinese economy develops, people have also raised higher demands on the comfort level of housing, which justifies the increasing inclination toward a detached house as long as it is affordable. According to statistics, the number of villas/detached houses and luxury apartments constructed in China in 2003 was 108,525 (China Real Estate Statistical Yearbook Citation2003, Citation2003). However, by 2016, the number had risen sharply to 294,616 (China Real Estate Statistical Yearbook Citation2016, Citation2016). Detached houses are mostly located in urban residential districts or in the suburbs close to the downtown with convenient transport and easy accessibility to city centers.
1.2. Visual impact assessment
Visual impact assessment is an assessment method that is widely used to evaluate the visual impact of various architectural elements. Samavatekbatan, Gholami, and Karimimoshaver (Citation2016) studied the aesthetic features of urban high-rise buildings by altering the height and roof style of certain high-rise buildings with computer software. Their study revealed that the height of these buildings had the largest impact on people’s visual aesthetic evaluation of high-rise buildings. The height of buildings also exerted some impact on people’s visual aesthetic evaluation of the roof style and color. Browne (Citation2006) observed that the significance of landmark buildings was partially embodied in its aesthetic values. He proposed some functional suggestions for the construction of urban landmark buildings.
The change in the surroundings of a particular building influences its visual preference evaluation as well. Yabuki, Miyashita, and Fukuda (Citation2011) studied the fusion of different building heights and surrounding landscapes by using the AR method. Collins, Sitte, and Collins (Citation2006) maintained that the building heights around a square influenced people’s perception of the square. According to their research, the minimum size of a square should be equal to the average height of the surrounding buildings, whereas the maximum size should be no larger than twice the average height. Lin, Homma, and Iki (Citation2018) discovered that building height and vegetation types around the lake had some impact on people’s visual preference evaluation of the lake.
1.3. Demographic differences
As has been revealed by previous studies, people’s visual preference evaluation of buildings is influenced by many factors that cover not only the physical factors of the buildings and the landscape factors of the surroundings but also the demographic characteristics of evaluators (Wang and Zhao Citation2017). Among the demographic characteristics, cultural background (Yu Citation1995), education level (Molnarova et al. Citation2012), gender (Lindemann-Matthies et al. Citation2010; Strumse Citation1996), age (Van den Berg and Koole Citation2006), professional knowledge (Strumse Citation1996; Vouligny, Domon, and Ruiz Citation2009), degree of familiarity with the surroundings (Howley, Donoghue, and Hynes Citation2012), and living environment (Yu Citation1995; Zube, Pitt, and Evans Citation1983) have a great impact on people’s visual preference evaluation.
1.4. Research basis
People’s preference for the environment is usually influenced by two main factors. The first factor comprises the physical characteristics of buildings, including the shape, height, and width of buildings or streets; the other type comprises environmental factors. According to existing research, the height-width ratio (the ratio of the building’s height to its frontage width) influences people’s visual preference (Norouzian-Maleki et al. Citation2018). However, the result of the mentioned research only proves that physical characteristics and environmental characteristics influence people’s preference for the environment.
Architectural style also influences people’s visual preference for buildings (Evans Citation2019). An experiment conducted by Saruwono, Rashdi, and Omar (Citation2012) in Malaysia indicated that the subjects showed an increasing interest in modern-style buildings. However, the subjects in this experiment were not categorized. Cerina, Fornara, and Manca (Citation2017) showed that the elderly prefer local traditional residences with green landscapes nearby.
The complexity of the building façade has some impact on people’s visual preference (Akalin et al. Citation2009). Generally, people prefer buildings with a medium-complexity façade. The complexity of the building façade is largely related to windows, the spaciousness and transparency of which also influence people’s visual preference of buildings (Ozdemir Citation2010). From the indoor perspective, people prefer windows through which natural scenery can be seen (Kearney and Winterbottom Citation2006). However, these studies did not explore the possibility and degree of influence that windows exert on visual preference from the outdoor perspective.
Natural landscapes have a positive influence on people (Han and Zhao Citation2018). White and Gatersleben (Citation2011) found that roof greening and façade greening improved people’s visual preference for detached houses. Jungels et al. (Citation2013), in a study conducted in the northeast of the United States, established that respondents’ visual preference, as well as an overall evaluation of the building, could be improved remarkably by the surrounding roof greening. Accordingly, the surrounding green landscapes would influence people’s visual preference for buildings (Kaplan and Kaplan Citation1989).
In the experiment conducted in this study, through a literature study, the characteristics of architectures are classified into four categories: architectural style, height-width ratio, window-wall ratio, and surrounding environment. The method of summarizing the research target’s characteristics through a literature study is widely employed in other academic papers (Kalivoda et al. Citation2014; Wang, Zhao, & Liu, Citation2016).
1.5. Research questions
As shown in previous research, the height and style of high-rise buildings are influential factors in people’s visual preference evaluation of high-rise buildings. However, studies related to low-rise buildings are quite rare (Samavatekbatan, Gholami, and Karimimoshaver Citation2016). With detached houses as the research target, this study explored whether the style, height-width ratio, window area, and surrounding greening environment would influence people’s visual preference evaluation of detached houses.
Post-Occupancy Evaluation (POE) is more often used to investigate people’s view or satisfaction about the detached house (Durosaiye, Hadjri, and Liyanage Citation2019; Pastore and Andersen Citation2019; Ponterosso, Gaterell, and Williams Citation2018; Zhu and Wu Citation2002). The POE focuses on how the environment supports and meets the users’ explicit or implicit demand. When using the POE method, researchers would focus more on users’ satisfaction regarding the interior space in buildings while more or less ignoring the visual preference evaluation of the buildings’ exterior (Marcus and Francis Citation1997). Therefore, in this experiment, photos were used to substitute the actual buildings to guide the participants to focus on the exterior elements of the detached houses.
A questionnaire survey was conducted to collect data on the participants’ visual preference for detached houses of various styles, as well as their demographic characteristics. Through data analysis and statistics, the study explored whether the visual preference evaluation of different groups regarding the exterior of detached houses differ from each other and whether demographic characteristics lead to a focus divergence on the physical properties of the exterior space of the detached house.
2. Research methods
2.1. Research location
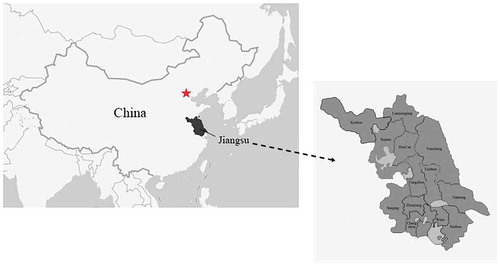
This experiment was conducted in Jiangsu, a province in the east of China. As one of the most economically advanced provinces of China, Jiangsu, together with Shanghai, Zhejiang, and Anhui provinces, constitutes the city cluster on the Yangtze river delta, one of the six world-class city clusters. Located in the East Asia monsoon area and the transition zone of subtropical and warm temperature zone, Jiangsu province boasts of a mixture of north and south climatic characteristics. Similarly, its culture varies dramatically, boasting of a mixture of “Wu culture,” “Jinling culture,” “Huaiyang culture,” “Xuhuai culture,” “Oceanic culture,” and other subcultures.
Since the reform and opening up of China, a large number of detached houses have been built in Jiangsu province. Because of the cultural differences, these detached houses display a great variety in architectural style, surrounding environments, and other aspects. Therefore, these detached houses in Jiangsu province are highly representative of the architectural styles, which justify setting the research location in Jiangsu province (see ).
Figure 1. Location and map of Jiangsu.
2.2. Selection of detached house styles
Given that the detached houses in Jiangsu province display a wide variety of architectural styles, 260 detached houses in 13 cities of Jiangsu province were surveyed by the first, second, and third authors (20 houses in each city). The data on their architectural styles were gathered and analyzed, and the top five popular styles were selected as the research material ( and ). The selected five styles are as follows: French Style, modern Style, Chinese architectural style, Mediterranean style, and British style.
Figure 2. The quantity of detached houses.
Table 1. The statistics of architectural styles of detached houses in Jiangsu province.
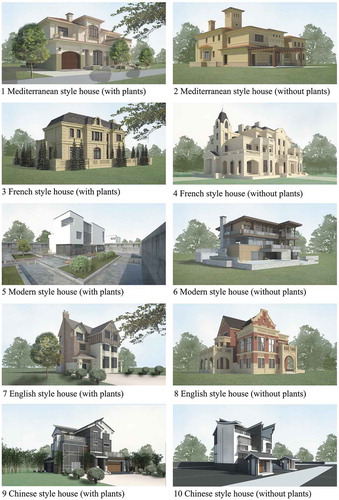
After the selection of the five architectural styles, the actual building forms of each style were determined. Of all the detached houses surveyed, ten houses, to be more specific, ten photos of each architectural style were selected randomly. The fifty photos were then presented to five architecture experts who were asked to single out the top two photos most representative of the five architectural styles. The number of times each photo was selected was calculated, and the top two photos were taken as representative of the building forms of each architectural style. To eliminate or minimize the influence of the shooting angle and shading of photos, the first author modeled and rendered the building forms of ten photos selected by means of SketchUp2018. The viewing angle of modeling and rendering was set at 168 cm from the ground since the average height of Jiangsu citizens is 168 cm according to the Report on Nutrition and Chronic Diseases of Chinese Citizens released by China State Council in 2017. The climatic background was set to be sunny and cloudless. After modeling and rendering, 10 photos were obtained (as shown in ).
Figure 3. The photos used in the experiment and their numbers.
2.3. Calculation of the height-width ratio of detached houses
The change in the width and height of a building exerts a remarkable impact on viewers’ overall visual evaluation of the building. Therefore, the change in the width and height was denoted by the height-width ratio. The height-width ratio can be calculated by dividing the height with the width of a building façade. Generally, two façades are involved in the photos. Accordingly, the average height-width ratios of the two façades were calculated and are shown in .
Table 2. The height-width ratio statistics of detached houses.
2.4. Calculation of relative area of the windows of detached houses
The relative area of the windows of detached houses can be calculated through the window-wall ratio, as expressed by the following formula: a = S1/S2, where S1 denotes the area of the window in the façades, and S2 refers to the area of the façade (as shown in ). Since only two façades could be seen from a viewing angle, the average values of window-wall ratios of the two visible façades were calculated and then shown in .
Figure 4. The schematic diagram of the relative area of windows of detached houses.
Table 3. The window-wall ratio statistics of detached houses.
2.5. Surrounding greening of detached houses
Given that the greening around detached houses is usually complicated in terms of variety and forms, the surrounding greening in the study is narrowed down to the plants in the photos. Of the ten photos obtained, five include plants. Thus, for each architectural style, there is one photo with plants and one without plants.
2.6. Survey of the experiment participants’ preference
The ten photos of different architectural styles, height-width ratios, and greening were shown to the participants to ascertain their visual preference. These photos were printed in full-color and bound into a booklet in random order. To simplify the scoring process, the ten photos were printed in pairs on five sheets of A4 photo paper. These photos were then displayed to the residents living in detached house communities in 13 cities of Jiangsu province randomly. The residents were asked to score the photos. The survey was conducted during weekends to ensure diversity among the participants in terms of demographics. Meanwhile, the communities where the photos were displayed were excluded from the research location list. In previous related research, the photos had been widely used to substitute the actual landscapes (Norouzian-Maleki et al. Citation2018), which justifies the survey conducted in the present study.
The participants in the experiment were asked to fill in a questionnaire on their demographic characteristics that mainly cover the following: gender, age, having/not having design experience, and occupation (see ). According to the data on occupations obtained from the questionnaires and based on the Occupational Classification of People’s Republic of China, the participants were divided into four categories: entrepreneurs, financial staff, sales staff, and technical staff. Then the participants were asked to score the ten photos according to their visual preferences. The scores ranged from 1 to 5, with 1 as the minimum and 5 the maximum. The participants were able to alter their scores before submitting the final score. The questionnaire survey was conducted in February and March 2019, with 358 participants. In all, 297 effective questionnaires were collected, the effective rate being 82.9%. The scoring formula of the demographic characteristics of participants is shown in , and the distribution of the demographic characteristics of participants is shown in . The statistics indicated that the distribution of the demographic characteristics of participants was consistent with that of the Jiangsu Statistical Yearbook 2018, thus ensuring the representativeness of this study.
Table 4. The variables of demographic characteristics and corresponding set values.
Table 5. The scores and corresponding meaning.
Table 6. The statistics of participants’ demographic characteristics.
The data collected were analyzed with SPSS 22.0 to explore the influence of different demographic characteristics on people’s visual preference for the style, height-width ratio, relative area of windows, and greening environment of detached houses. On this basis, multiple linear regression analysis was conducted. These analytical methods have been widely used in previous studies as well (Wang and Zhao Citation2017).
3. Results
3.1. Overall evaluation of photos
The intergroup reliability of the ten photos was measured with SPSS 22.0; the result indicated that the reliability was 0.762, a relatively high internal reliability. Thus, it can be concluded that the questionnaire survey was reliable, and the results could be used for a detailed analysis.
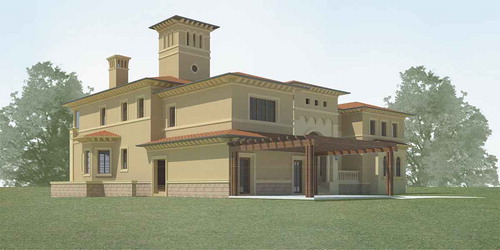
The average score of each photo given by the participants was denoted by S. Among all the photos, the highest average score is 4.15, while the lowest score is 2.38 (the scores ranged from 1 to 5). The average score of all the photos is 3.36. The modern-style house with plants and landscapes was scored the highest (), whereas the Mediterranean-style house without plants and landscapes was scored the lowest ().
In the experiments where the photos are used to substitute actual landscapes, the average score of the photos can be taken as effective data to reflect the viewers’ visual preference.
Figure 5. The photo with the highest average score.
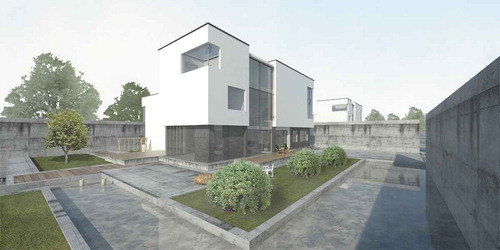
Figure 6. The photo with the lowest average score.
3.2. Demographic characteristics and visual preference evaluation
To study the relationship between demographic characteristics and visual preference evaluation, the single-factor analysis of variance was conducted. The results indicate that there exists a remarkable difference in the average scores (S) of the participants on the basis of gender (F = 10.562, p = 0.01), age (F = 3.698, p = 0.025), having/not having design experience (F = 6.390, p = 0.000), and occupation (F = 6.84, p = 0.000).
The Kendall rank correlation analysis was conducted to measure the correlation between demographic characteristics and visual preference evaluation. The results indicate that the average score (S) displays a remarkable correlation with gender (negative correlation), age (positive correlation), having/not having design experience (negative correlation), and occupation (negative correlation) ().
Table 7. Kendall rank correlation analysis.
Finally, a stepwise multiple linear regression model was used to further analyze the data. Gender, age, work, and experience were taken as independent variables in the multiple linear regression model, while the average score of the photos was set as a dependent variable. The results indicate that gender, age, work, and experience exert a remarkable influence on the scores of the photos (as shown in ).
Table 8. Stepwise multiple linear regression analysis.
Further efforts were made to explore the possibility of the reciprocal effect of demographic characteristics. The collinearity of independent variables was analyzed through the conclusion obtained from the multiple linear regression model. The significant tolerance of age is 0.97, VIF = 1.031, that of gender is 0.453, VIF = 2.206, that of occupation is 0.451, VIF = 2.218, and that of design experience is 0.672, VIF = 6.621. When VIF is larger than 10 or tolerance is smaller than 0.2, collinearity exists in the model (Arriaza et al. Citation2004; Menard Citation2002). In this experiment, all VIFs of independent variables are smaller than 10 and all tolerances are larger than 0.2; besides, the residual errors are distributed in a normal way. Therefore, it can be concluded that collinearity does not exist in this model.
3.3. Gender difference of participants and physical property of photos
The average scores of each photo given respectively by male and female participants were taken as dependent variables. The physical properties of 10 photos (architectural style, height-width ratio, relative area of windows, and local surroundings) were set as independent variables. The stepwise multiple linear regression model indicates that significant predictors of male and female participants are different (as shown in ). For male participants, the relative area of windows (A) and architectural style (S) are reliable predictors for visual preference evaluation; whereas for female participants, architectural style (S) and local surroundings (L) are reliable predictors.
Table 9. The linear analysis of photo physical properties for different gender groups.
The K-S test was used to testify the collinearity between the two models. The test results indicate that residual errors are distributed in a normal way (male participants: K-S Z = 0.605, p = 0.602; female participants: K-S Z = 0.963, p = 0.312). Therefore, it can be concluded that there is no collinearity between the two models.
3.4. Age difference of participants and physical properties of photos
The average scores for each photo given by the participants of different age groups were taken as dependent variables. The physical properties of the ten photos (architectural style, height-width ratio, relative area of windows, and local surroundings) were set as independent variables. The stepwise multiple linear regression model indicates that the significant predictors of different age groups are different. For participants under 17 years and aged 18–34 years, the height-width ratio (H) is a reliable predictor of visual preference evaluation; for participants aged 35–59 years, architectural style (S) is a reliable predictor; for participants over 60 years, architectural style (S) and local surroundings (L) are reliable predictors (as shown in ).
Table 10. The linear analysis of photo physical properties for different age groups.
The K-S test was used to verify the collinearity among the four models. The results indicate that the residual errors are distributed in a normal way (for participants below 17 years: K-S Z = 0.521, p = 0.481; for participants aged 18–34 years: K-S Z = 0.325, p = 0.128; for participants aged 36–59 years: K-S Z = 0.563, p = 0.258; for participants over 60 years: K-S Z = 0.647, p = 0.478). Therefore, it can be concluded that there is no collinearity among the four models.
3.5. Difference in participants’ design experience and physical properties of photos
The average scores of each photo given by the participants having/not having design experience were taken as dependent variables. Moreover, the physical properties of the 10 photos (architectural style, height-width ratio, relative area of windows, and local surroundings) were set as independent variables. The stepwise multiple linear regression model indicates that the significant predictors of the participants having/not having design experience are different. For participants having no design experience, the architectural style (S) and local surroundings (L) are reliable predictors; for participants having design experience, the relative area of windows (A) and architectural style (S) are reliable predictors for visual preference evaluation (as shown in ).
Table 11. The linear analysis of photo physical properties for participants having/having no design experience.
The K-S test was used to verify the collinearity between the two models. The results indicate that the residual errors are distributed in a normal way (participants having design experience: K-S Z = 0.682, p = 0.120; participants having no design experience: K-S Z = 0.516, p = 0.362). Therefore, it can be concluded that there is no collinearity between the two models.
3.6. Occupation difference of participants and physical properties of photos
The average scores for each photo given by the participants of different occupations were taken as dependent variables. The physical properties of the ten photos (architectural style, height-width ratio, relative area of windows, and local surroundings) were set as independent variables. The stepwise multiple linear regression model indicates that the significant predictors of the participants of different occupations are different. For entrepreneurs, height-width ratio (H) and local surroundings (L) are reliable predictors for visual preference evaluation; for financial staff and sales staff, architectural style (S) is the reliable predictor for visual preference evaluation; and for technical staff, relative area of windows (A) and architectural style (S) are reliable predictors for visual preference evaluation (as shown in ).
Table 12. The linear analysis of photo physical properties for participants of different occupations.
The K-S test was used to verify the collinearity among the four models. The test results indicate that the residual errors are distributed in a normal way (for entrepreneurs: K-S Z = 0.552, p = 0.128; for financial staff: K-S Z = 0.891, p = 0.461; for sales staff: K-S Z = 0.328, p = 0.100; and for technical staff: K-S Z = 0.697, p = 0.782). Therefore, it can be concluded that there is no collinearity among the four models.
4. Discussion
4.1. Demographic characteristics and visual preference evaluation
Zube, Pitt, and Evans (Citation1983) maintained that people of different demographic characteristics would produce different visual preference evaluations of even the same group of photos. They also discovered that the average score would decrease as the viewers aged. However, the result of the present study is the opposite: age is positively correlated with visual preference evaluation (see ). This is mainly because the older participants had experienced a relatively poor living environment during their childhood. Accordingly, they would spontaneously compare the brand new detached house with their childhood living environment when they are shown the photos of new detached houses; consequently, they would conclude that detached houses are more “advanced.” Comparatively, since the detached houses, with the actual houses in Jiangsu province as the prototype, have been a common sight for young participants, they would not evaluate the photos as highly as would the older ones. Howley, Donoghue, and Hynes (Citation2012) observed that people of different ages would have different visual preference evaluations, which could be justified by the living environment and life experience of the participants. Wang and Zhao (Citation2017) came to a similar conclusion as Zube, Pitt, and Evans (Citation1983) in their study of people’s visual preference evaluation of plants, but their conclusion is contrary to that of the present study. Therefore, when judging the visual preference evaluation of people of different ages, the researchers should give full consideration to the difference in the viewers’ cultural and life experience rather than rushing to a conclusion.
Abello and Bernaldez (Citation1986) held that gender difference would produce different visual preference evaluations, which is in line with the present study. In addition, the present study also discovers that compared with male participants, female participants would produce a much higher visual preference evaluation: the average score given by female participants is 3.96, while that of male participants is 3.52. This may be because of the fact that detached houses in the photos display distinctive features that are more attractive to female participants. Comparatively, male participants are more inclined to eclectic features. However, this conclusion is contrary to that of Yao et al. (Citation2012).
Keane (Citation1990) claimed that the participants’ life or study experience would not influence their visual preference evaluation of landscapes, which is contrary to the conclusion of the present study. It is discovered in this study that the participants having/not having design experience would produce different visual preference evaluations of even the same group of photos; moreover, those with design experience would produce a lower evaluation than those with no such experience. This may be because those having design experience have mastered some knowledge about visual aesthetics and appreciate many excellent architectures or landscapes. They would be stricter when evaluating the actual detached houses. Thus, their design experience increases the likelihood of a low visual preference evaluation. Al-Akl, Karaan, Al-Zein, and Assaad (Citation2018) took the participants’ design experience as a key factor when exploring the visual preference evaluation of urban cemetery landscapes. However, they did not confirm the relationship between design experience and visual preference for landscapes.
Nasar and Kang (Citation1999) maintained that people of different occupations would produce different visual preference evaluations on the ground that they belonged to different cultural classes. Their conclusion is similar to that of the present study. As shown in this study, the participants with a higher average income (entrepreneurs and financial staff) would produce a comparatively low visual preference evaluation. This can be attributed to the fact that the high-income groups no longer find the common detached houses appealing. They now desire houses that are distinctively different from the common ones. Consequently, they would give a comparatively low evaluation. Kalivoda et al. (Citation2014) found that people who are engaged in ecological protection are highly consistent in their visual preference evaluation of the landscapes when they explored the influence of occupations on people’s visual preference evaluation. By contrast, people of other occupations show a great difference in their visual evaluations.
To sum up, although no unanimous agreement on the influence of demographic characteristics on visual preference evaluation has ever reached in the academic circle, it can be safely drawn that full consideration should be given to research subjects, characteristics of the times, people’s life experiences, and local surroundings.
4.2. Interaction between different demographic characteristics
Thus far, there has been no unanimous agreement on the influence of demographic characteristics on visual preference for architectures or the environment. One important reason for this is the interaction between different demographic characteristics. However, there has been no definite conclusion as the participants/viewers come from different countries and have different cultures and experiences. Accordingly, the regression model has to be established to verify whether the interaction between different demographic characteristics exists and how/how much it functions. This experiment reveals through a multiple linear regression model that there is no interaction between gender, age, having/not having design experience, and occupation (as shown in ). This could be justified by the fact that this experiment was conducted in Jiangsu province, and all the participants were Chinese. In Jiangsu province, whose population boasts of high mobility, the interaction between age, gender, experience, and occupation is rather unstable. An experimental study requires recalculating and reweighting under certain local and cultural circumstances to ensure the objectivity of the experiment instead of simply quoting the conclusions of other research.
4.3. Demographic characteristics and physical characteristics of photos
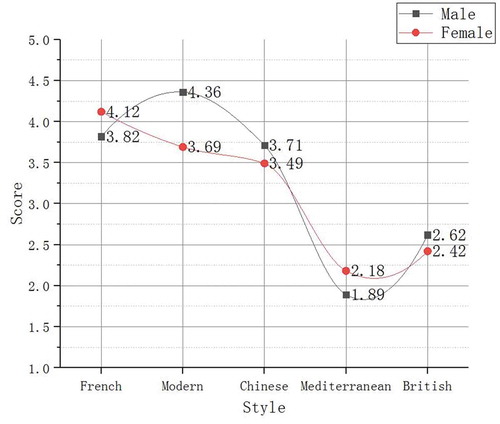
The two genders produce different visual preference evaluations of the exterior of detached houses. Our experiment suggests that females mainly consider the style of the house when evaluating the detached houses in Jiangsu province; in addition, through a multifactor analysis of variance, it was found that French style is scored much higher than the other four styles because of its distinctive features (as shown in ). The main reason for female participants’ preference for French-style buildings could be their preference for the ornate façade style that is exemplified in French-style buildings. It was also seen that males primarily consider the architectural style and relative area of the windows when evaluating detached houses. In terms of architectural style, male participants prefer modern-style buildings, and their scoring would increase as the relative area of the windows increases. This may be justified by the fact that males are comparatively more rational and thus pay more attention to the relative area of windows when evaluating detached houses.
Figure 7. The preference of different gender groups for architectural style of detached houses.
Different age groups show different visual preferences for the exterior of detached houses. The experiment suggests that groups below 17 years and those aged 18–35 years give a special concern over height-width ratio when evaluating detached houses; in addition, their visual preference evaluation is positively correlated with the height-width ratio. The main reason for this situation is because young and middle-aged participants are already quite familiar with detached houses in China, which are mostly three-storied or lower, and they would evaluate much more highly the detached houses with larger height-width ratios. In contrast, participants aged 36–59 years prefer the architectural style. On an average, they score the Chinese style much higher than other styles (as shown in ). Their rich life experience may justify their inclination: people of this age prefer labeling their taste of culture by traditional Chinese style. Participants over 60 years pay more attention to the exterior environment of the detached houses and prefer local surroundings with greening landscapes. This is mainly because most people in this age group have lived in the countryside for some time and thus would be more than willing to recall their past country life. The exterior greening landscapes can better reflect and satisfy their emotional and psychological needs. The study of visual preference evaluations made by the participants of different ages suggests that younger groups show greater eagerness for novelty while older groups tend to be more nostalgic. The reason for this is because the younger groups are mostly highly educated due to the rapid development in Chinese education in the last few decades and thus they have cultivated a relatively strong curiosity toward new and novel things; the latter can be justified by the fact that when evaluating the detached houses, participants of over 60 years would compare the house with their past living environment spontaneously and then evaluate highly those aspects that bear some resemblance to their past memories.
Figure 8. The preference of participants of 36–59 years old for architectural style of detached houses.
The characteristic of having or not having a design experience also influences the participants’ visual preference evaluation of detached houses. Participants with design experience pay more attention to architectural style and relative area of windows when evaluating the detached house. This is mainly because they are highly familiar with prominent architectural styles and thus have their own clear judgment. The relative area of windows is crucial for the façade effect of the house, and thus it is specially considered. In contrast, participants without any design experience show greater consideration for the architectural style and height-width ratio, since these two characteristics can reflect the exterior of the detached house more directly. They would find the physical characteristics easy to catch. Meanwhile, the comparison of the scores given by the two groups indicates that the group having design experience scores the photos lower than the group without design experience (the former scores 3.21 while the latter scores 3.52 on average). This could be because the group having design experience may be stricter when evaluating the detached house. After all, their knowledge about famous architectural designs may turn out to be a negative factor when they evaluate the comparatively common detached houses.
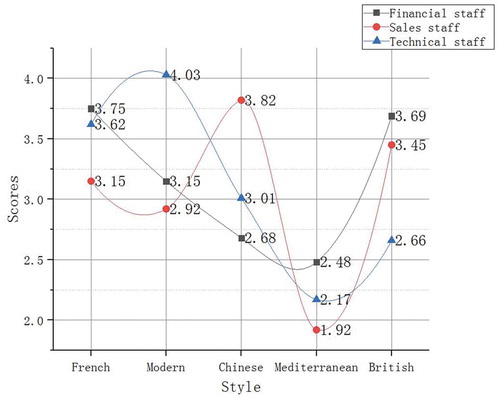
Similarly, occupation also exerts some impact on participants’ visual preference evaluation of the detached houses. The questionnaire survey conducted covers only four occupation groups who are more likely to afford a detached house in Jiangsu province. The four occupations are ranked by average income as follows: entrepreneurs, financial staff, sales staff, and technical staff. The experiment suggests that entrepreneurs give special consideration to the height-width ratio and local surroundings when evaluating detached houses, and they prefer detached houses with large height-width ratio and landscapes. This is because they are comparatively wealthy, and hope to manifest their wealth with higher houses and a more beautiful living environment. Financial staff, sales staff, and technical staff pay more attention to the architectural style of the detached house. The comparison of the average scores given by the participants of the three occupations indicates that financial staff are more inclined to British- and French-style houses; sales staff are more inclined to Chinese-style houses; and technical staff prefer modern-style houses (as shown in ). The difference displayed in their preference for architectural styles may be caused by their different occupations.
Figure 9. The preference of participants of different occupations for architectural style of detached houses.
5. Conclusions
Architects and landscape planners should give full consideration to the feelings of different groups of people to improve the owners’ satisfaction level. Detached house projects that can meet the need of the majority are more likely to win public support (Gobster et al. Citation2007). Ignoring the majority’s need may cause a detached house project to fail, or at least fail to achieve the sales forecast (Junker and Buchecker Citation2008). One of the fundamental tasks for architects is to comprehend the need and demand of the target population and design buildings that meet their expectations. Architects’ comprehension of the needs of the target population plays a significant role in building evaluation.
The results of this study provide a valuable reference for architects to become acquainted with the way different groups view detached houses in Jiangsu province and the physical characteristics they would give more attention to. Different genders give priority to architectural styles when evaluating detached houses; for different age groups, their life experience counts significantly in their visual preference evaluation of detached houses; the groups having design experience tend to be stricter and more scrupulous in the process of evaluation than those without relevant experience; entrepreneurs are inclined to manifest their wealth, whereas people of other occupations choose the architectural styles in accordance with their job nature.
Although this experiment does not delve deeply into whether there is an interaction between genders, ages, having/not having design experience, and occupations, the experiment conducted and the analytical results obtained are of significance in providing the architects and landscape planners with valuable insight into their actual design practices. Meanwhile, they can, to some degree, forecast the development trend of visual preference evaluation of detached houses in Jiangsu province, China.
Acknowledgments
We want to express our heartfelt thanks to the dozens of architecture experts and hundreds of anonymous participants.
Disclosure statement
No potential conflict of interest was reported by the authors.
Additional information
Funding
Notes on contributors
Zitong Zhen
Zitong Zhen is a Postgraduate Student of School of Architecture and Design, China University of Mining and Technology. Her research focuses on Architectural Design.
Mingkang Ma
Mingkang Ma is a Postgraduate Student of School of Architecture and Design, China University of Mining and Technology. His research focuses on Architectural Design.
Zebiao Shao
Zebiao Shao is a Lecture at School of Architecture and Design, China University of Mining and Technology. He is a Ph.D. His research focuses on Architectural Design, low-carbon technology building integration applications, and Building Physical Environment.
Chenping Han
Chenping Han is a Professor at School of Architecture and Design, China University of Mining and Technology. He is a Ph.D. His research focuses on theories and methods of Architectural Design Innovativion, architectural design under special and complex environmental conditions, and intelligent & movable buildings.
Xixiao Bu
Xixiao Bu is a Postgraduate Student of School of Architecture and Design, China University of Mining and Technology. Her research focuses on Architectural Design.
References
- Abello, R. P., and F. G. Bernaldez. 1986. “Landscape Preference and Personality.” Landscape & Urban Planning 13 (86): 19–28. doi:10.1016/0169-2046(86)90004-6.
- Akalin, A., K. Yildirim, C. Wilson, and O. Kilicoglu. 2009. “Architecture and Engineering Students’ Evaluations of House Façades: Preference, Complexity and Impressiveness.” Journal of Environmental Psychology 29 (1): 124–132. doi:10.1016/j.jenvp.2008.05.005.
- Al-Akl, N. M., E. N. Karaan, M. S. Al-Zein, and S. Assaad. 2018. “The Landscape of Urban Cemeteries: Perceptions and Preferences.” Urban Forestry & Urban Greening S161886671730403X. doi:10.1016/j.ufug.2018.04.011.
- Arriaza, M., J. F. Cañas-Ortega, J. A. Cañas-Madueño, and P. Ruiz-Aviles. 2004. “Assessing the Visual Quality of Rural Landscapes.” Landscape and Urban Planning 69 (1): 115–125. doi:10.1016/j.landurbplan.2003.10.029.
- Browne, L. A. 2006. “Regenerate: Reusing a Landmark Building to Economically Bolster Urban Revitalization.” Diss., University of Cincinnati.
- Cerina, V., F. Fornara, and S. Manca. 2017. “Architectural Style and Green Spaces Predict Older Adults’ Evaluations of Residential Facilities.” European Journal of Ageing 14 (3): 207–217. doi:10.1007/s10433-016-0406-z.
- National Bureau of Statistics. 2003. China Real Estate Statistical Yearbook. Beijing: China Statistics Press.
- National Bureau of Statistics. 2016. China Real Estate Statistical Yearbook. Beijing: China Statistics Press.
- Collins, G. R., C. Sitte, and C. C. Collins. 2006. Camillo Sitte: The Birth of Modern City Planning. New York: Dover Publications.
- Durosaiye, I. O., K. Hadjri, and C. L. Liyanage. 2019. “A Critique of Post-occupancy Evaluation in the UK.” Journal of Housing and the Built Environment 34 (1): 345–352. doi:10.1007/s10901-019-09646-2.
- Evans, K. 2019. “Exploring the Relationship between Visual Preferences for Tiny and Small Houses and Land Use Policy in the Southeastern United States.” Land Use Policy 81: 209–218. doi:10.1016/j.landusepol.2018.10.051.
- Gobster, P. H., J. I. Nassauer, T. C. Daniel, and G. Fry. 2007. “The Shared Landscape: What Does Aesthetics Have to Do with Ecology?” Landscape Ecology 22 (7): 959–972. doi:10.1007/s10980-007-9110-x.
- Han, C., and M. Zhao. 2018. Landscape Architecture: Art and Design. Beijing: China Architecture & Building Press.
- Howley, P., C. O. Donoghue, and S. Hynes. 2012. “Exploring Public Preferences for Traditional Farming Landscapes.” Landscape and Urban Planning 104 (1): 66–74. doi:10.1016/j.landurbplan.2011.09.006.
- Jungels, J., D. A. Rakow, S. B. Allred, and S. M. Skelly. 2013. “Attitudes and Aesthetic Reactions toward Green Roofs in the Northeastern United States.” Landscape and Urban Planning 117: 13–21. doi:10.1016/j.landurbplan.2013.04.013.
- Junker, B., and M. Buchecker. 2008. “Aesthetic Preferences versus Ecological Objectives in River Restorations.” Landscape and Urban Planning 85 (3–4): 141–154. doi:10.1016/j.landurbplan.2007.11.002.
- Kalivoda, O., J. Vojar, Z. Skřivanová, and Z. Daniel. 2014. “Consensus in Landscape Preference Judgments: The Effects of Landscape Visual Aesthetic Quality and Respondents’ Characteristics.” Journal of Environmental Management 137: 36–44. doi:10.1016/j.jenvman.2014.02.009.
- Kaplan, R., and S. Kaplan. 1989. The Experience of Nature: A Psychological Perspective. Cambridge: Cambridge University Press.
- Keane, T. D. 1990. “The Role of Familiarity in Landscape Aesthetics: A Study of Tallgrass Prairie Landscapes.”.
- Kearney, A. R., and D. Winterbottom. 2006. “Nearby Nature and Long-term Care Facility Residents: Benefits and Design Recommendations.” Journal of Housing for the Elderly 19 (3–4): 7–28. doi:10.1300/J081v19n03_02.
- Lin, L., R. Homma, and K. Iki. 2018. “Preferences for a Lake Landscape: Effects of Building Height and Lake Width.” Environmental Impact Assessment Review 70: 22–33. doi:10.1016/j.eiar.2018.03.001.
- Lindemann-Matthies, P., R. Briegel, B. Schüpbach, and X. Junge. 2010. “Aesthetic Preference for a Swiss Alpine Landscape: The Impact of Different Agricultural Land-use with Different Biodiversity.” Landscape and Urban Planning 98 (2): 99–109. doi:10.1016/j.landurbplan.2010.07.015.
- Marcus, C. C., and C. Francis. 1997. People Places: Design Guidlines for Urban Open Space. Hoboken: John Wiley & Sons.
- Menard, S. 2002. Applied Logistic Regression Analysis. 2nd ed. Quantitative Applications in the Social Sciences. Thousand Oaks, CA: SAGE Publications. doi:10.4135/9781412983433.
- Molnarova, K., P. Sklenicka, J. Stiborek, K. Svobodova, M. Salek, and E. Brabec. 2012. “Visual Preferences for Wind Turbines: Location, Numbers and Respondent Characteristics.” Applied Energy 92: 269–278. doi:10.1016/j.apenergy.2011.11.001.
- Nasar, J. L., and J. Kang. 1999. “House Style Preference and Meanings across Taste Cultures.” Landscape and Urban Planning 44 (1): 33–42. doi:10.1016/S0169-2046(98)00109-1.
- Norouzian-Maleki, S., S. Bell, S.-B. Hosseini, M. Faizi, and B. Saleh-Sedghpour. 2018. “A Comparison of Neighbourhood Liveability as Perceived by Two Groups of Residents: Tehran, Iran and Tartu, Estonia.” Urban Forestry & Urban Greening 35: 8–20. doi:10.1016/j.ufug.2018.08.004.
- Ozdemir, A. 2010. “The Effect of Window Views Openness and Naturalness on the Perception of Rooms Spaciousness and Brightness: A Visual Preference Study.” Scientific Research and Essays 5 (16): 2275–2287.
- Pastore, L., and M. Andersen. 2019. “Building Energy Certification versus User Satisfaction with the Indoor Environment: Findings from a Multi-site Post-occupancy Evaluation (POE) in Switzerland.” Building and Environment 150: 60–74. doi:10.1016/j.buildenv.2019.01.001.
- Ponterosso, P., M. Gaterell, and J. Williams. 2018. “Post Occupancy Evaluation and Internal Environmental Monitoring of the New BREEAM “Excellent” Land Rover/Ben Ainslie Racing Team Headquarters Offices.” Building and Environment 146: 133–142. doi:10.1016/j.buildenv.2018.09.037.
- Samavatekbatan, A., S. Gholami, and M. Karimimoshaver. 2016. “Assessing the Visual Impact of Physical Features of Tall Buildings: Height, Top, Color.” Environmental Impact Assessment Review 57: 53–62. doi:10.1016/j.eiar.2015.11.008.
- Saruwono, M., A. M. Rashdi, and E. O. Omar. 2012. “To House-owners, Style Does Matter.” Procedia-Social and Behavioral Sciences 36: 166–176. doi:10.1016/j.sbspro.2012.03.019.
- Strumse, E. 1996. “Demographic Differences in the Visual Preferences for Agrarian Landscapes in Western Norway.” Journal of Environmental Psychology 16 (1): 17–31. doi:10.1006/jevp.1996.0002.
- Van den Berg, A. E., and S. L. Koole. 2006. “New Wilderness in the Netherlands: An Investigation of Visual Preferences for Nature Development Landscapes.” Landscape and Urban Planning 78 (4): 362–372. doi:10.1016/j.landurbplan.2005.11.006.
- Vouligny, É., G. Domon, and J. Ruiz. 2009. “An Assessment of Ordinary Landscapes by an Expert and by Its Residents: Landscape Values in Areas of Intensive Agricultural Use.” Land Use Policy 26 (4): 890–900. doi:10.1016/j.landusepol.2008.10.016.
- Wang, R., and J. Zhao. 2017. “Demographic Groups’ Differences in Visual Preference for Vegetated Landscapes in Urban Green Space.” Sustainable Cities and Society 28: 350–357. doi:10.1016/j.scs.2016.10.010.
- Wang, R., Z. Jingwei., and Z. Liu. 2016. “Consensus in Visual Preferences: The Effects Of Aesthetic Quality and Landscape Types.” Urban Forestry & Urban Greening 20: 210–217. doi:10.1016/j.ufug.2016.09.005.
- White, E. V., and B. Gatersleben. 2011. “Greenery on Residential Buildings: Does It Affect Preferences and Perceptions of Beauty?” Journal of Environmental Psychology 31 (1): 89–98. doi:10.1016/j.jenvp.2010.11.002.
- Yabuki, N., K. Miyashita, and T. Fukuda. 2011. “An Invisible Height Evaluation System for Building Height Regulation to Preserve Good Landscapes Using Augmented Reality.” Automation in Construction 20 (3): 228–235. doi:10.1016/j.autcon.2010.08.003.
- Yao, Y., X. Zhu, X. Yingbi, H. Yang, W. Xian, L. Yangfan, and Y. Zhang. 2012. “Assessing the Visual Quality of Green Landscaping in Rural Residential Areas: The Case of Changzhou, China.” Environmental Monitoring and Assessment 184 (2): 951–967. doi:10.1007/s10661-011-2012-z.
- Yu, K. 1995. “Cultural Variations in Landscape Preference: Comparisons among Chinese Sub-groups and Western Design Experts.” Landscape and Urban Planning 32 (2): 107–126. doi:10.1016/0169-2046(94)00188-9.
- Zhu, X., and S. Wu. 2002. “The Influence of Post-evaluation on Architectural Design and Its Significance to China.” Journal of Architecture 5: 42–44.
- Zube, E. H., D. G. Pitt, and G. W. Evans. 1983. “A Lifespan Developmental Study of Landscape Assessment.” Journal of Environmental Psychology 3 (2): 115–128. doi:10.1016/S0272-4944(05)80151-3.