
 ?Mathematical formulae have been encoded as MathML and are displayed in this HTML version using MathJax in order to improve their display. Uncheck the box to turn MathJax off. This feature requires Javascript. Click on a formula to zoom.
ABSTRACT
Sky type classification is a significant element in daylight simulation. As a “winter city”, the daylight climate of Harbin is distinctive, and there is therefore a particular need to determine the most appropriate sky models to establish sky luminance distribution in the city and thereby improve the accuracy of daylight simulations. To determine the closest sky type to that of Harbin during winter, sky luminance data consisting of 145 sky elements were collected by a sky scanner at 10 min intervals from June 2018 to February 2019. The sky luminance data were compared with the 15 standard sky definitions, varying from overcast sky to clear sky, proposed by the Commission International de l’ Eclairage (CIE). The sky with the lowest root-mean-square-error was selected as the most appropriate sky type. The results show that clear skies prevail in Harbin during winter, with an occurrence of 70.56%. The dominant sky type is type 12, with an occurrence of 48.57%, followed by types 11, 10, and 8 with occurrences of 17.67%, 5.81%, and 5.36% respectively. The sum of the occurrences of these four sky types exceeds 77%, which means that they can be regarded as generally representative of Harbin’s skies during winter.
1. Introduction
In recent years, daylight performance evaluation has been considered to be an important element in “green” building design and has accordingly attracted increasing attention (Gago et al. Citation2015). Daylight calculations are usually carried out using computer simulations and focus on sky luminance distribution. An accurate sky model is required to establish sky luminance distributions for daylight simulations. The 15 Commission International de l’ Eclairage (CIE) standard sky models were introduced to accurately describe sky luminance distribution and facilitate classification. The models provide a set of well-defined sky luminance patterns, from overcast to clear skies. However, sky luminance distribution is also affected by other factors, such as solar position, cloud conditions, turbidity, the pollutant content of the atmosphere, etc. (Kittler and Darula Citation2016). There are distinct differences in luminance distribution between areas with different climates and geographical features. Thus, there is a need to determine the closest CIE sky type at a certain location and time, based on regional daylight measurement data, in order to accurately calculate luminance distribution.
The literature reports many climate variables which contribute to classification of the CIE standard skies, including sky luminance, Lz/Dv, VSC, Dv/Ev, Gv/Ev, etc. The ratio of zenith luminance to horizontal sky-diffuse illuminance (Lz/DV) is the base criterion for sky classification, but this is not suitable for locations at low altitudes (Tregenza Citation2004). Vertical sky component (VSC) appears to be ambiguous at certain scattering angles (Alshaibani, Citation2008, Citation2011; Li et al. Citation2011). The ratio of horizontal sky diffuse illuminance to extra-terrestrial illuminance (Dv/Ev) can be applied in combination with other methods for effective sky classification. The ratio of horizontal global illuminance to extra-terrestrial illuminance (Gv/Ev) is sometimes not reliable in describing actual sky conditions accurately (Li and Tang Citation2008). Horizontal sky illuminance (Alshaibani, Citation2017) is a simple criterion, but is sometimes uncertain. Overall, sky luminance of an entire sky hemisphere has generally been considered to provide an accurate and direct data for sky classification (Li, Chau, and Wan Citation2014). A sky scanner is normally used for sky luminance observation based on the recommendations of CIE 108–1994. Furthermore, long-term luminance measurements can provide basic data for daylight modelling and dynamic daylight simulations.
However, luminance data for the entire sky hemisphere are not always available in many areas. Studies on sky luminance distributions have been carried out in a few areas around the world, such as England (53.38°N, 1.50°W), France (45.78°N, 4.93°W), Italy (39.35°N, 16.22°W), Spain, Thailand (14.08°N, 100.62°E), Singapore (1.5°N, 103.78°E), and China (Hong Kong 22.31°N, 114.21°E; Beijing 39.97°N, 116.4°E),etc. (Bartzokas et al. Citation2003, Citation2005; Markou et al. Citation2005; Ferraro, Mele, and Marinelli Citation2011; Torres et al. Citation2010a, Citation2010b; Suárez-García et al. Citation2018; Janjai and Palon Citation2011; Mettanant, Chaiwiwatworakul, and Chirarattananon Citation2017; Wittkopf and Soon Citation2007; Li, Lau, and Lam Citation2004; Ng et al. Citation2007; Luo et al. Citation2015). However, sky luminance research has been carried out in very few areas in Asia. The sky luminance distribution in the northeast of China, which has a high latitude, is relatively unknown. Harbin is a historic industrial city, which faces air pollution problems. The city also has a comparatively long period during winter when municipal heating is in operation because of the extremely cold climate. Increases in anthropogenic emissions exacerbate air pollution problems such as haze (Mao et al. Citation2018). These pollutants increase the turbidity of the atmosphere and result in the reduction of solar radiance and sunshine duration, which then affects exterior daylight conditions and indoor illuminance. This probably distinguishes Harbin from other cities and explains variations in performance between winter and other seasons. Recently, however, visual comfort concerns have given rise to more creativity in daylight design. Harbin has a lower solar altitude during winter compared to other major cities because of its relatively high latitude, and there is therefore high potential for discomfort glare when the skies are sunny in winter. Hence, more attention has to be paid to the design of buildings in Harbin to take account of visual comfort during winter. Knowledge of Harbin’s typical sky type in winter will therefore contribute significantly to appropriate daylight design in the city.
The present study aims to define typical daylight conditions and representative skies during the winter period in Harbin, based on sky luminance observations. This will provide a reference for daylight simulation for buildings in Harbin in the future.
The structure of the paper is as follows: Information from the measurement facility and data collection is described in Section 2. An introduction to the CIE standard general skies and sky classification method is given in Section 3. The characteristics of Harbin’s skies during the winter period and analysis of time and solar altitudes are set out in Section 4. A summary of the observations and an assessment of the contribution of the present work to future building projects is set out in Section 5.
2. Sky luminance distribution data measurements
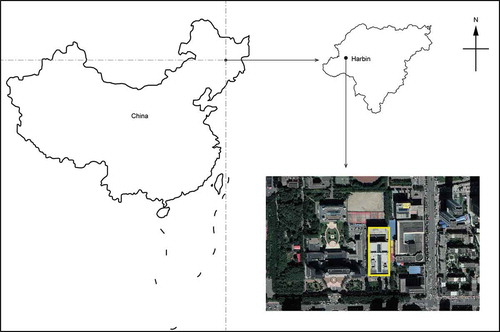
Harbin is the capital city of Heilongjiang Province. The city is characterised by severely cold winters with average annual sunshine duration between 2300 and 2800 h. China is divided into five daylight climate zones by annual average daylight illuminance according to China’s Standard for Daylighting Design of Buildings (Architecture and Press, Citation2013). Harbin is classified into zone Ⅳ, in a daylight climate zone of China with an annual average daylight illuminance of between 30 and 35 klx and an exterior design illuminance value of 13,500 lx. The meteorological observation station used to provide data for Harbin is located in the urban centre of the city (45.75°N, 126.68°E). It is installed on the roof of a five-storey building which is 28 m above ground level. (Zi Citation2020) shows the location of the meteorological observation station.
Figure 1. The location of the meteorological observation station (Zi. Citation2020).
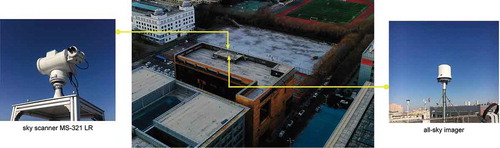
As shown in (Zi Citation2020), measurement instrumentation consists of a sky scanner and an all-sky imager. The sky scanner is an EKO (MS-321 LR), and is used to measure the sky luminance and radiance of 145 elements of the sky hemisphere. Measurement is accomplished by using a sensitive sensor with a viewing angle of 11° and a dual-axis control drive. A single scan takes 4.5 min. The luminance value is measured in kcd/m2 and the radiance value in W/m2/sr. The luminance and radiance ranges are 50 kcd/m2 and 300 W/m2/sr. The sky scanner was calibrated before measurements were carried out. The all-sky imager is installed next to the sky scanner. It is equipped with a fisheye lens with a 180° field of view. It is used to take photographs of the entire sky and contributes to defining sky conditions.
Figure 2. The experimental facility (Zi Citation2020).
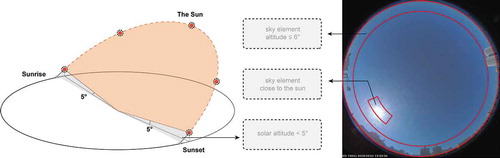
The two instruments were set to operate every 10 min from sunrise to sunset every day from June 2018. The period from 1 November 2018 to 28 February 2019 was defined as the winter period. Luminance data and sky image data from November 2018 to February 2019 were selected for winter analysis and data gathered before November 2018 were used for comparative analysis in this study. Unfortunately, sky luminance data for the period from 7 February 2019 to 13 February 2019 are missing as a result of a power failure. In addition, some abnormal measurement data were removed before data analysis () (Zi Citation2020). Measurement scans with solar altitude angles of equal to or lower than 5° were excluded from analysis (Suárez-García et al. Citation2018). Further, as some sky elements close to the sun are strongly influenced by beam sunlight, luminance data with extremely high values were removed. A luminance value of 50 kcd/m2 was adopted as the criterion for consideration in the luminance range. Luminance data with values lower than 0.1 kcd/m2 were also removed. Luminance data from sky elements at an altitude angle of 6° were eliminated, as this measurement would be influenced by tall buildings in the distance (Ferraro, Mele, and Marinelli Citation2011, Citation2013). In practice, abnormal measurement data (values higher than 50 kcd/m2, lower than 0.1 kcd/m2, and with an altitude angle of 6°) were assigned a value of 0. This process was carried out using a MATLAB program.
Figure 3. Abnormal measurement data needed to be removed (Zi Citation2020).
3. CIE standard sky models and sky classification method
3.1. CIE standard sky luminance distribution
The CIE standard skies scheme was originally proposed by Kittler and others (Kittler, Darula, and Perez Citation1998), and subsequently adopted by the CIE and the International Standards Organisation (ISO) (International Standards Organization Citation2004). The classification scheme is now known as the “CIE/ISO Standard General Skies”. The CIE standard skies classify skies into 15 defined sky types, comprising 5 overcast skies, 5 intermediate skies, and 5 clear skies. The formal descriptions of the 15 CIE standard skies are shown in (International Standards Organization Citation2004). The CIE sky model describes sky luminance according to the ratio of the luminance of one sky element to the sky zenith luminance (EquationEquation 1(1)
(1) ).
Table 1. Description of CIE standard skies (International Standards Organization Citation2004).
The gradation function describes luminance from the zenith to the horizon, and the indicatrix function
describes the relationship between the sky element and the sun. They are calculated as follows:
where:
a is a parameter of the gradation function, used to determine whether horizon region is either darker or brighter than zenith region;
b is a parameter of the gradation function, used to indicate the luminance gradation close to horizon region;
c is a parameter of the indicatrix function, used to describe the luminance rise towards the sun position;
d is a parameter of the indicatrix function, used to express the width of the circumsolar region;
e is a parameter of the indicatrix function, used to indicate changes of horizon luminance because of solar angular distance;
Z is the zenith angle of a sky element;
Zs is the zenith angle of the sun; and
χ is the angular distance of a sky element from the sun.
The value χ can be calculated using EquationEquation (4)(4)
(4) . Descriptions of the different parameters are shown in (Zi Citation2020).
Figure 4. Relative parameters and positions of the sun and the sky element (Zi Citation2020).
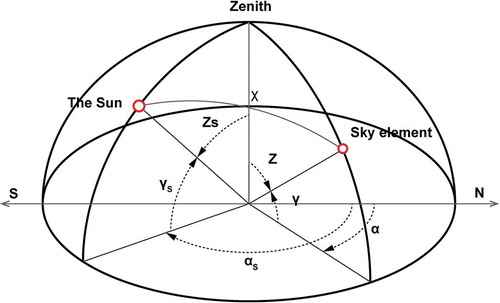
where α and αs are the altitude angles of a sky element and the sun.
3.2. Sky classification with Tregenza methods
The method in the present study is based on the Tregenza method. The principal characteristic of this method lies in its normalisation of measured luminance with respect to horizontal illuminance and solar elevation, rather than using measured sky zenith luminance directly. The use of measured zenith luminance could lead to uncertainty, as the single sky element of luminance can change considerably, even under stable cloudy conditions, and the luminance of the sky zenith cannot be measured accurately when the sun is close to the zenith. The Tregenza method appears to be more stable and effective, as it takes these potential issues into consideration. The method has been applied successfully by many researchers (Ng et al. Citation2007; Torres et al. Citation2010a, Citation2010b; Suárez-García et al. Citation2018).
As shown in (Zi Citation2020), the sky hemisphere was divided into 145 sky elements. The horizontal illuminance from the entire sky () is the sum of the horizontal illuminance from the 145 sky elements (
) (EquationEquation 5
(5)
(5) ). As some abnormal data were discarded prior to analysis, a correction factor (
) was proposed for the calculation of horizontal illuminance (EquationEquations 6
(6)
(6) Equationand 7)
(7)
(7) .
Figure 5. Positions and sequence of the 145 measurement points for sky scanning in 8 bands (Zi Citation2020).
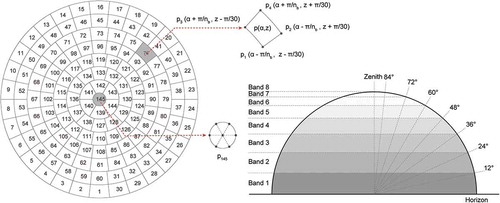
where is the number of the band range from 1 to 8 and
is the number of each band.
The horizontal illuminance of each sky element () is a contribution of the luminance of the sky element p, and can be calculated according to EquationEquations 8
(8)
(8) Equationand 9
(9)
(9) .
where is the measured luminance value of a sky element.
The normalised luminance of each sky element () can then be determined by the ratio of the measured luminance of each sky element (
) to the horizontal illuminance from the whole sky hemisphere (
) (EquationEquation 10
(10)
(10) ).
The luminance distribution of each standard general sky type () was subsequently calculated according to EquationEquations 1
(1)
(1) –4. To enhance the comparison values, the mean luminance of each sky element was acquired by taking the mean of the calculated luminance at the four corners of the element ()(Zi Citation2020). The angular position of the four corners (p1, p2, p3, and p4) of element p (α, Z) are (α – π/np, Z – π/30), (α – π/np, Z + π/30), (α + π/np, Z – π/30), and (α + π/np, Z + π/30). The final sky element was divided into six triangles ()(Zi Citation2020). The luminance of this element was calculated as the mean luminance of the six triangles (EquationEquation 11
(11)
(11) ).
The horizontal illuminance () from the standard sky was also calculated according to EquationEquations 8
(8)
(8) and Equation9
(9)
(9) , and 15 sets of luminance (
) can be identified using EquationEquation (10)
(10)
(10) .
The final step was the comparison between each standard sky and the measured sky to determine the closest sky type. The root-mean-square-error (RMSE) for the calculation was obtained by subtracting the normalised luminance of sky element measured data from that of each standard sky, then calculating the sum of these values, and finally dividing the sum by the total number of available sky elements (EquationEquation 12(12)
(12) ). The closest sky type was obtained once the lowest RMSE value had been calculated. A sequence of MATLAB code was developed for the entire process.
where n means the numbers of available luminance data, which are required to exclude void elements from the sum.
where, for each sky element, was originally determined to be 1, and would be assigned a value of 0 if the luminance of the sky element was 0.
4. Results and discussion
4.1. Characterisation of Harbin’s skies during winter
In this study, a total of 6332 sky scans during winter were obtained, of which 5589 were eventually used for analysis. ) shows the frequency of occurrence (%) of different sky types and ) shows the distribution of overcast, intermediate, and clear sky conditions in Harbin during winter. ) shows the RMSE between the best-fitting CIE skies and the measured skies. It can be observed that the frequency distributions of the 15 general sky types are demonstrably different. The dominant sky type of Harbin during the winter is type 12 (CIE standard clear sky) with a frequency of occurrence of 48.57%. This is followed by types 11, 10, and 8, with frequencies of occurrence of 17.67%, 6.29%, and 5.36%, respectively. The total frequency of occurrence of these four sky types is about 77.89%, which means that, between them, these four sky types are effectively representative of the sky luminance distribution of Harbin during winter. shows typical sky images of these four sky types at certain times. Type 1 appeared with quite a low frequency of occurrence at about 3.75%, which suggests that the standard overcast sky type is not suitable for prediction of daylight conditions in Harbin during winter, even though current standards are still using this sky type for daylight evaluation across China. From the perspective of cloudiness conditions, the frequency of occurrence of clear skies is 70.56%, with types 12, 11, and 13 being the dominant sky types indicating clear conditions. The frequencies of occurrence of intermediate and overcast skies are relatively low with values of 19.79% and 9.56%, respectively.
Figure 6. (a) Frequency distribution of different sky types in Harbin during winter. (b) Cloudiness classification of Harbin during winter. (c) The RMSE of the best-fitting skies in comparison to the real skies.
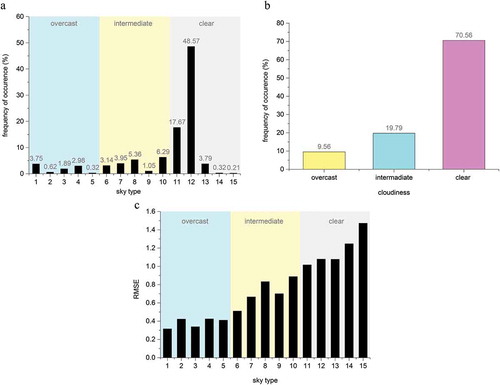
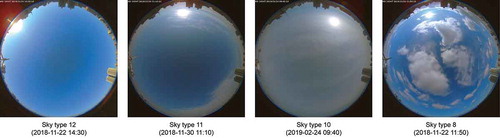
Figure 7. Sky images of the four typical sky types in Harbin during winter: clear skies (types 12 and 11), intermediate skies (types 10 and 8).
As shown in ), the RMSE has a tendency to increase from overcast skies to clear skies. For clear skies, a high deviation was found, particularly for type 15, which has an extremely low frequency of occurrence. However, types 11, 12, and 13 show relatively low RMSE values with a high frequency of occurrence, which confirms that these three sky types better represent clear sky conditions. For intermediate skies, the distribution of the RMSE values shows a similar pattern to the frequency of occurrence. Type 8 had the highest RMSE as well as the highest frequency of occurrence. For overcast skies, these five sky types have relatively low deviation compared to the other sky types, with type 1 exhibiting the lowest value. This means that type 1 was closest to the real sky luminance distribution, though it is not regarded as one of the representative skies of Harbin during winter.
In the meantime, some cities at similar latitudes to Harbin were selected for comparative analysis using data from previous research, including Pamplona (42.83°N, 1.6°W), Bratislava (48.2°N, 17.1°E), Beijing (116°E, 40°N) and Sheffield (53.38°N, 1.50°W) (Torres et al. Citation2010b; Bartzokas et al. Citation2005; Luo et al. Citation2015; Markou et al. Citation2005). Significant differences in sky luminance distribution appear between these sites. Overcast skies prevail in Bratislava, Sheffield, and Pamplona, as Bratislava has a Mediterranean climate and the other two cities have warm temperate climates. The climates of these three cities are humid and rainy days occur more frequently in winter. However, intermediate skies prevail in Beijing and clear skies dominate in Harbin, although both cities have a temperate monsoon climate. They are generally cold and dry in winter, although Beijing is markedly warmer. The extremely low temperatures, high atmospheric pressure, and low volumes of water vapour molecules in Harbin mean that clear skies prevail during winter.
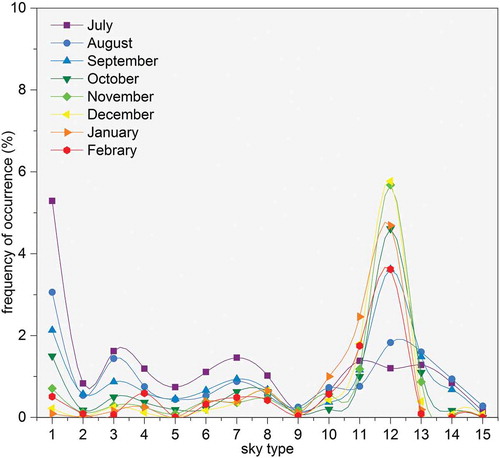
In this study, some data from other months were chosen for comparison to assist in defining the sky luminance distributions of Harbin during winter. (Zi Citation2020) shows the frequency of occurrence of the 15 sky types of different months from summer to winter. Considerable changes can be observed from summer to winter for overcast and clear skies, with the frequency of occurrence of overcast skies showing a declining trend. Conversely, a significant increase from summer to winter can be found for clear sky conditions. The frequency of occurrence of intermediate skies is generally stable with only slight fluctuations. Type 1 was the dominant sky type in July with a frequency of 5.29%, but with frequencies of only 1.5% in October and 0.09% in January. This is because there are more rainy days during summer than winter in Harbin, and type 1 prevails on rainy days. Clear days are more prevalent in winter, with the change of frequency of sky type 12 being the most significant, with frequencies of 1.2% in July, 4.61% in October, and 4.69% in January.
Figure 8. Comparative study of sky frequency in different months (Zi Citation2020).
4.2. Analysis of daylight hours
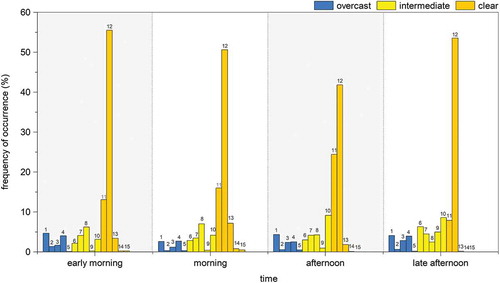
presents sky distributions at various times of the day during winter. To find the relationships between the sky types and the periods of the day, the day during winter was divided into four periods, including early morning (before 9 solar hour), morning (between 9 and 12 solar hour), afternoon (from 12 to 15 solar hour), and late afternoon (after 15 solar hour). shows the distribution of sky types in different periods of the day during winter in Harbin. It can be observed that clear skies prevail overall, especially in the mornings and early mornings. The frequency of intermediate skies increases incrementally, in a stable fashion, and exhibits a high frequency of occurrence in the late afternoons, but comparatively low frequency in the early mornings. In the meantime, the frequency of overcast skies appears to be stable across the different daily periods.
Figure 9. Frequency distribution of skies in different daytime hour during winter.
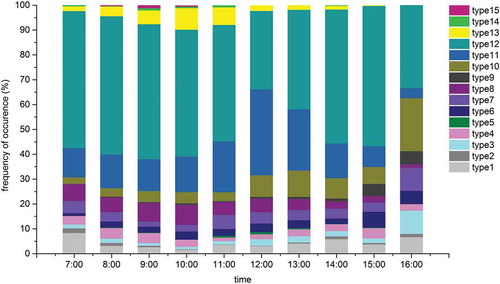
Figure 10. Frequency distribution of skies in four daily periods during winter.
For clear skies, sky type 12 was generally the dominant type with a high and consistent frequency of occurrence of over 40%. Aside from type 12, type 13 had a relatively high frequency of occurrence in the mornings, but a lower frequency in the afternoons, probably due to reduction in atmospheric pollution at that time. Type 11 exhibited the opposite trend. At around 12:00, the frequency of occurrence of type 11 peaked, and exceeded that of type 12. For intermediate skies, type 8 prevailed in the mornings and early mornings and type 10 prevailed in the afternoons and late afternoons. For overcast skies, type 1 was the dominant sky type with a high frequency of occurrence across all periods of the day.
(a–d) shows the sky types at various time points during 4 representative days. The dynamic sky conditions over time can be clearly identified. As is universally recognised, the limitation of the CIE standard sky models is that the correct sky type must be selected before simulation. The closest sky type is selected to establish the corresponding sky luminance distribution for daylight calculations, and in this way assists in the simulation of real-time indoor daylight conditions.
Figure 11. (a) Occurrence of sky types of different time points in 27 November 2018. (b) Occurrence of sky types of different time points in 22 December 2018. (c) Occurrence of sky types of different time points in 20 January 2019. (d) Occurrence of sky types of different time points in 18 February 2019. [Instruction text: Figure 11(a–d) Occurrence of sky types of different time points during represented days.].
![Figure 11. (a) Occurrence of sky types of different time points in 27 November 2018. (b) Occurrence of sky types of different time points in 22 December 2018. (c) Occurrence of sky types of different time points in 20 January 2019. (d) Occurrence of sky types of different time points in 18 February 2019. [Instruction text: Figure 11(a–d) Occurrence of sky types of different time points during represented days.].](/cms/asset/71a9dd75-d619-492f-9714-73152ab1d21f/tabe_a_1752217_f0011_b.gif)
4.3. Analysis of solar altitude
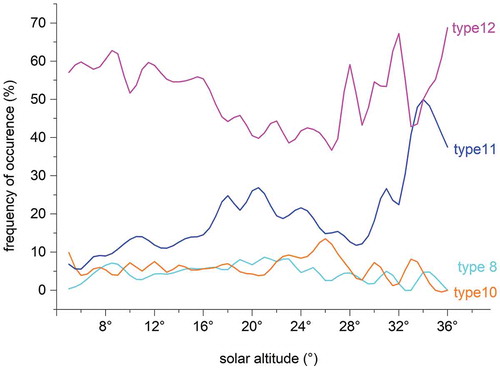
The solar altitude of Harbin during winter is relatively low, with values of not more than 37°. shows the frequency of occurrence of different sky types against solar altitude in Harbin during winter, and shows data for the four representative sky types during winter. An obvious change against solar altitude can be identified with regard to type 12, with the frequency of occurrence of type 12 showing a gradual decline with increase in solar altitude, but then an abrupt uptrend when the solar altitude approaches 30°. Conversely, the frequency of occurrence of type 11 exhibits a rise-fall-rise tendency, with the first peak value at about 25% when the solar altitude is approximately 21°. When the solar altitude is close to 35°, the frequency of occurrence of type 11 is about 50%. Types 10 and 8 have similar distributions and appear to be stable, with only slight fluctuations. Type 10 exhibits a peak value of about 15% with a solar altitude of 26°.
Figure 12. Frequency of occurrence against solar altitude for 15 CIE standard skies during winter.
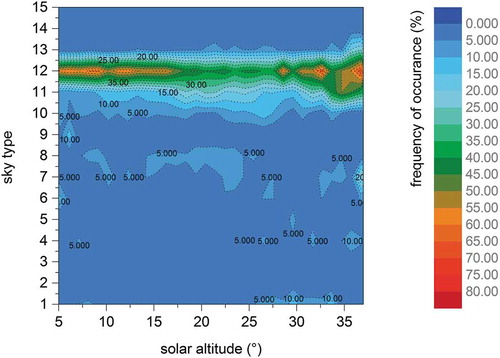
Figure 13. Frequency of occurrence versus solar altitude for four representative skies during winter.
During daylight, the windows of a room are the main source of glare. Relatively low solar altitudes and a high frequency of occurrence of clear skies will make non-north-facing rooms suffer long-term beam sunlight, particularly in directly south-facing rooms, which will increase the potential for discomfort glare. With the high frequency of occurrence of type 12 skies, glare is more likely to occur in Harbin than in the other cities mentioned supra. Glare evaluation seems to be essential for Harbin during winter, so it is reasonable to select a clear sky type for glare risk evaluation.
5. Conclusion
In this study, the skies distribution of Harbin during winter was analysed for the first time. The representative sky types of Harbin were identified by comparative analysis of measured data with theoretical sky models based on observed sky luminance distribution. The frequency of occurrence of different skies turned out to vary significantly. Clear skies have the highest frequency of occurrence, at 70.56%, followed by intermediate skies. Overcast skies were found to have the lowest frequency of occurrence. The dominant sky type in Harbin during winter is type 12, with a frequency of occurrence of approximately 50%. A reduced set of CIE standard skies could be used to describe the sky luminance distribution of Harbin in winter. A simplified set of four out of the fifteen sky types, types 12, 11, 10, and 8, can be regarded as representing the skies of Harbin in winter, with a total frequency of occurrence of more than 70%.
A standard overcast sky is still used in current China as a benchmark to evaluate daylight conditions, but according to the results of this study, this appeared to be inaccurate and ineffective for Harbin. Clear skies are more suitable for describing the overall sky luminance distribution of Harbin during winter. The closest sky type could be identified, based on real-time luminance observation, and used for establishing the sky luminance distribution. A sky model based on measured luminance data could also be established to represent real sky brightness, which will help to develop a real-time daylight simulation and improve the accuracy of daylight simulation.
In the future, further long-term luminance measurements will be required for the annual study of the daylight climate of Harbin and other cities in China. This could contribute to the establishment of acceptable general daylight design rules, and other meteorological data observations can be carried out for analysis in concert.
Disclosure statement
No potential conflict of interest was reported by the authors.
Additional information
Funding
References
- Alshaibani, K. 2008. “Determination of CIE Standard General Sky from Horizontal and Vertical illuminance/irradiance[C]//Proc.” In World Renew. Energy Congress X, Glasgow.
- Alshaibani, K. 2011. “Finding Frequency Distributions of CIE Standard General Skies from Sky Illuminance or irradiance[J].” Lighting Research & Technology 43 (4): 487–495. doi:10.1177/1477153511404999.
- Alshaibani, K. 2017. “Classification Standard Skies: The Use of Horizontal Sky Illuminance.” Renewable and Sustainable Energy Reviews 73: 387–392. doi:10.1016/j.rser.2017.01.116.
- Architecture, C., and B. Press. 2013. “Standard for Daylighting Design of Buildings.” (GB 50033–2013). Beijing: China Architecture & Building Press
- Bartzokas, A., H. D. Kambezidis, S. Darula, and R. Kittler. 2005. “Comparison between Winter and Summer Sky-luminance Distribution in Central Europe and in the Eastern Mediterranean.” Journal of Atmospheric and Solar-Terrestrial Physics 67 (7): 709–718. doi:10.1016/j.jastp.2004.12.008.
- Bartzokas, A., S. Darula, H. D. Kambezidis, and R. Kittler. 2003. “Sky Luminance Distribution in Central Europe and the Mediterranean Area during the Winter Period.” Journal of Atmospheric and Solar-terrestrial Physics 65 (1): 113–119. doi:10.1016/S1364-6826(02)00283-3.
- Ferraro, V., M. Mele, and V. Marinelli. 2011. “Sky Luminance Measurements and Comparisons with Calculation Models.” Journal of Atmospheric and Solar-Terrestrial Physics 73 (13): 1780–1789. doi:10.1016/j.jastp.2011.04.009.
- Ferraro, V., V. Marinelli, and M. Mele. 2013. “A Method for Selecting the Cie Standard General Sky Model with regard to Calculating Luminance Distributions.” Journal of Atmospheric and Solar-terrestrial Physics 59-64. doi: 10.1016/j.jastp.2013.01.006.
- Gago, E. J., T. Muneer, M. Knez, and H. Köster. 2015. “Natural Light Controls and Guides in Buildings. Energy Saving for Electrical Lighting, Reduction of Cooling Load.” Renewable and Sustainable Energy Reviews 41: 1–13. doi:10.1016/j.rser.2014.08.002.
- International Standards Organization. 2004. “ISO 15469:2004/CIE 011:2003. Spatial Distribution of daylight-CIE Standard General Sky.” Geneva: ISO.
- Janjai, S., and P. Plaon. 2011. “Estimation of Sky Luminance in the Tropics Using Artificial Neural Networks: Modeling and Performance Comparison with the Cie Model.” Applied Energy 88 (3): 840-847. doi: 10.1016/j.apenergy.2010.09.004.
- Kittler, R., and S. Darula. 2016. “Scattered Sunlight Determining Sky Luminance Patterns.” Renewable and Sustainable Energy Reviews 62: 575–584. doi:10.1016/j.rser.2016.05.012.
- Kittler, R., S. Darula, and R. Perez. 1998. “A Set of Standard Skies, Characterizing Daylight Conditions for Computer and Energy Conscious Design.” US SK 92 052 Final Report, 52 p., ICA SASBratislava. doi:10.13140/RG.2.1.4798.7048.
- Li, D H W, K L Cheung, H L Tang, and C C Cheng. 2011. “Identifying CIE Standard Skies Using Vertical Sky component[J].” Journal of Atmospheric and Solar-Terrestrial Physics 73 (13): 1861–1867. doi:10.1016/j.jastp.2011.04.015.
- Li, D. H., C. C. Lau, and J. C. Lam. 2004. “Overcast Sky Conditions and Luminance Distribution in Hong Kong.” Building and Environment 39 (1): 101–108. doi:10.1016/j.buildenv.2003.06.001.
- Li, D. H., T. C. Chau, and K. K. Wan. 2014. “A Review of the CIE General Sky Classification Approaches.” Renewable and Sustainable Energy Reviews 31: 563–574. doi:10.1016/j.rser.2013.12.018.
- Li, D. H. W., and H. L. Tang. 2008. “Standard Skies Classification in Hong Kong.” Journal of Atmospheric and Solar-Terrestrial Physics 70 (8–9): 1222–1230. doi:10.1016/j.jastp.2008.03.004.
- Luo, T., D. Yan, R. Lin, and J. Zhao. 2015. “Sky-luminance Distribution in Beijing.” Lighting Research and Technology 47 (3): 349–359. doi:10.1177/1477153514532466.
- Mao, Q., C. Huang, H. Zhang, Q. Chen, and Y. Yuan. 2018. “Aerosol Optical Properties and Radiative Effect under Different Weather Conditions in Harbin, China.” Infrared Physics & Technology 89: 304–314. doi:10.1016/j.infrared.2018.01.024.
- Markou, M. T., H. D. Kambezidis, A. Bartzokas, B. D. Katsoulis, and T. Muneer. 2005. “Sky Type Classification in Central England during Winter.” Energy 30 (9): 1667–1674. doi:10.1016/j.energy.2004.05.002.
- Mettanant, V., P. Chaiwiwatworakul, and S. Chirarattananon. 2017. “A Model of Thai’s Sky Luminance Distribution Based on Reduced CIE Standard Sky Types.” Renewable Energy 103: 739–749. doi:10.1016/j.renene.2016.11.008.
- Ng, E., V. Cheng, A. Gadi, J. Mu, M. Lee, and A. Gadi. 2007. “Defining Standard Skies for Hong Kong.” Building and Environment 42 (2): 866–876. doi:10.1016/j.buildenv.2005.10.005.
- Suárez-García, A., D. Granados-López, D. González-Peña, M. Díez-Mediavilla, and C. Alonso-Tristán. 2018. “Seasonal Caracterization of CIE Standard Sky Types above Burgos, Northwestern Spain.” Solar Energy 169: 24–33. doi:10.1016/j.solener.2018.04.028.
- Torres, J. L., M. De Blas, A. Garcia, A. Gracia, and A. De Francisco. 2010a. “Sky Luminance Distribution in the North of Iberian Peninsula during Winter.” Journal of Atmospheric and Solar-Terrestrial Physics 72 (16): 1147–1154. doi:10.1016/j.jastp.2010.07.001.
- Torres, J. L., M. De Blas, A. García, A. Gracia, and A. De Francisco. 2010b. “Sky Luminance Distribution in Pamplona (Spain) during the Summer Period.” Journal of Atmospheric and Solar-Terrestrial Physics 72 (5–6): 382–388. doi:10.1016/j.jastp.2009.12.005.
- Tregenza, P. R. 2004. “Analysing Sky Luminance Scans to Obtain Frequency Distributions of CIE Standard General Skies.” Lighting Research and Technology 36 (4): 271–279. doi:10.1191/1477153504li117oa.
- Wittkopf, S. K., and L. K. Soon. 2007. “Analysing Sky Luminance Scans and Predicting Frequent Sky Patterns in Singapore.” Lighting Research and Technology 39 (1): 31–51. doi:10.1177/1365782806070683.
- Zi., Y. 2020. “Research on Methods of Daylight Simulation in Winter City Based on Regional Sky Luminance Distribution Measurement.” Master diss., Harbin Institute of Technology.