
ABSTRACT
Performance measurement has become conventional in construction management. However, it is non-trivial to establish an effective system to capture, evaluate, and feedback the on-site data. Whilst 3D object–based technology prevails in the industry, project managers remain accustomed to text-based system. Unstructured data format requires a tremendous amount of time and effort when analyzing a project in detail. To overcome this issue, an extensive literature review in conjunction with industry feedback has been conducted. Based on this preliminary investigation, the authors have proposed an on-site performance measurement system that interlinks 3D object with a spreadsheet. The system enables project managers to recognize the performance and/or productivity of a project in real time and helps find timely remedies in updating the original plan. One of the key findings includes that the identified eight on-site productivity factors should be embedded into a 3D model in effectively measuring the performance for a particular project. The new system also provides a useful tool in managing the productivity of a project. The main contribution of this study is the proposition and verification of a novel methodology that effectively manages on-site performance information by relating 3D objects with productivity factors in building construction.
1. Introduction
1. 1. Research background
Accurate project planning and control have long been important for determining the success of projects (Russell Citation1993; El-Gohary, Aziz, and Abdel-Khalek Citation2017; Song and AbouRizk Citation2008; Tserng and Lin Citation2004; Taneja et al. Citation2010). However, the accuracy of project performance management depends on a wide range of data accumulation parameters such as time, cost, quality, and other issues (Cha and Kim Citation2011). Many endeavors have been devoted to acquiring detailed information from current and historical projects to effectively measure performance. Traditionally, several on-site construction information sources (i.e. laborers, materials, equipment, weather, work progress, locations) have been utilized to acquire data in the form of daily reports. In many cases, project performance has been difficult to manage because of poor data-capturing techniques (Martínez-Rojas, Marín, and Vila Citation2015; Feng, Chen, and Huang Citation2010). First, it takes considerable time and effort to extract on-site productivity information from project documents (Xie, Fernando, and AbouRizk Citation2011; Oral and Oral Citation2007). Moreover, additional efforts must be taken to use captured historical data. Second, on-site information is stored in the form of text. Thus, it is troublesome to determine the precise characteristics of a target project. Third, at construction job sites, project managers have difficulty inputting detailed levels of performance data into the information management system. Therefore, seemingly trivial data is often neglected (McCullouch and Gunn Citation1993). Fourth, project performance is heavily influenced by various project characteristics (size, location, weather, and labor availability). Even if the data were to be successfully captured, additional efforts would be required to verify whether they were meaningful. Therefore, project practitioners are often reluctant to employ on-site performance management systems (Gelisen and Griffis Citation2014, Nasir et al. Citation2012). As such, project performance is commonly measured from personal experience, judgment, and industry standards, which are not specific to target projects.
Building information management (BIM) systems have been widely developed for the construction industry and used in various disciplines, including design-error detection, document management, and energy and risk analyses (Eastman et al. Citation2008). It is important to note that BIM can be used as effective performance measurement tools from the perspective of one or multiple projects having a digital library (Cha and Lee Citation2018).
This study proposes a 3D/BIM framework that collects, analyzes, and predicts project performance by generating field information for minimizing additional management work and demonstrating validity by predicting and tracking future project.
Figure 1. Research process
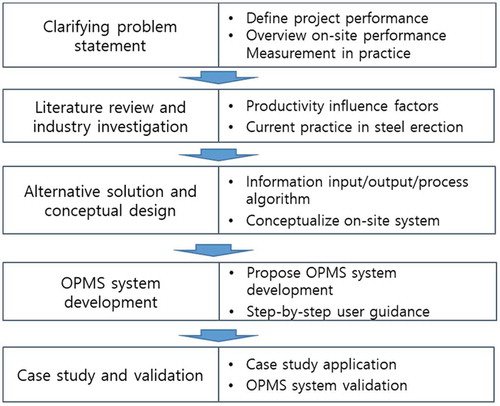
1. 2. Research methodology
Project performance is a function of input and output. Well-performed projects produce the same output with less input. For the purpose of research, output is confined to project percent completion, whereas input is confined to project resources (material, manpower, and equipment). A case study of the proposed system was demonstrated within the steel erection work of a commercial building project. The information in the study was derived from standard daily reports widely used by general contractors in South Korea. In terms of productivity factors, the research used predetermined influential factors based on literature reviews. A detailed research methodology is depicted in .
Upon clarifying problems, the authors investigated prior studies related to construction productivity management. This led to important considerations on performance measurement systematization that overcomes research barriers. Additionally, a field survey was conducted to account for the potential productivity factors specific to the steel erection work.
From previous studies, a BIM-based system was proposed and system requirements were established. Systems were constructed to suggest robust approaches in managing productivity information. During this phase, a step-by-step guide was prepared for the case project. Finally, the utilization of performance information was validated in terms of its applicability in a real case study of a construction project.
2. Literature review
2. 1. Definition
Performance and productivity have long been interchangeably used in the industry. (Dozzy and AbouRizk Citation1993). Although performance is regarded as the outcome of work, productivity is more often related to work efficiency. Historically, project performance was regarded a measure of consequences of past actions focused on financial elements. Recently, however, lagging financial measures were criticized because they neglected continuous knowledge, information, and client satisfaction improvements. Productivity defines how much and how well a project performs based on the resources used. Productivity is, therefore, a key performance area that many project managers consider as crucial. A comprehensive research review was conducted in terms of definition, influential factors, measurement, and management of performance and/or productivity information.
2. 2. Productivity/performance influential factors
Construction productivity has recently acquired research attention because of influential factors that have been scrutinized across a variety of construction processes and building types (Thomas and Yiakoumis Citation1987; Zayed and Halpin Citation2004; Dai, Goodrum, and Maloney Citation2009; Khanh and Kim Citation2014; Nguyen and Nguyen Citation2012; Sonmez and Rowings Citation1998; Gelisen and Griffis Citation2014; Sherekar and Tatikonda Citation2016; Durdyev, Ismail, and Kandymov Citation2018; Jarkas and Bitar Citation2012, Heravi and Eslamdoost Citation2015; Boussabaine and Duff Citation1996; Ellk Citation2018). These authors classified eight categories based on the characteristics of key influential issues: management, laborers, buildings/objects, communications, environments, tools/machines, materials, and jobs/methods. All of the eight influential factors are respectively delineated as follows.
Management Efforts can be further divided into manpower, capability, and conditions related to controlling particular projects. Among others, manpower (i.e. lack of supervision, inadequate staff) directly affects construction productivity. Capability issues are linked to the trustworthiness of supervision, proper coordination, and effective communication. These factors can indirectly influence project performance. Finally, management conditions are important, because job circumstances, administration support, and project management styles can cause productivity improvement.
Laborer Issues are divided into labor availability, conditions, and motivations. Labor availability includes capacity, team support, crew size, skillfulness, qualification, and technical excellence. Labor conditions indicate time, space, and environment of labor, including percent overtime, physical fatigue, shortage of experienced labor, lack of periodical meetings, lack of rest, sufficient facilities, and accommodation. Labor motivation can be either attitude or mindset. It may include absenteeism, accidents, levels of familiarity with current job, or other conditions.
Building/Object Issues are related to design characteristics (project type, size, and complexity). This may include building materials, project statuses, work types, dynamic structures, design complexities, or poor buildability. Notably, building design is considered a critical productivity factor.
Communication Issues are related to the management of information generated at the job site. This issue influences acquisition, transfer, and transformation of information among project participants. Examples of this factor include communication, coordination errors, and unrealistic deadlines. Additionally, drawing errors, complexity of construction information, and ambiguity of specifications can impact communication problems. Similarly, sequencing problems, schedule compressions, and frequent change orders are issues related to productivity improvement.
Environment Issues relate to both physical and regulatory confinement, including weather, policy, and contractual limitations. Traditionally, poor weather conditions (i.e. high/low temperature, humidity, wind, precipitation) are direct factors in productivity loss. The strictness of a regulatory system (i.e. engineering
standards, municipal policies, permit approvals, working days, project organizational cultures) affects productivity negatively, because it differentiates conventional work practices by requiring additional efforts when executing a project. The examples of contractual limitations include subcontract percentages, incentive schemes, payment delays, levels of direct or subcontract labor, and client influence.
Equipment Issues are direct influential factors of productivity. Equipment type, maximum capacity, availability, and machine superiority strongly influence jobsite productivity. Proper decision-making when selecting equipment results in tremendous productivity improvements. Machine reliability, availability, and lack of tools/operatives are also closely linked to construction efficiency.
Material Issues provide a key resource. Inferior materials, scattered materials, and unavailable materials negatively influence project productivity. Late, inadequate, unsuitable, or over-costed supplies are also factors under this category.
Job/Method Issues affect construction methods and environments. A specific building method (i.e. excavation, soil treatment, roofing, and cladding) explicitly affects productivity, because they vary in terms of experience. Other issues include rework, space availability, quality problems, and inspection by the engineers.
2. 3. On-site productivity information management
The above eight categories are commonly addressed in daily work progress reports at construction job sites. Daily report is a key document in which important information is recorded to manage and control a project. However, the use of this information is very limited, because the data is text-based and hard to organize. There is no linkage between daily reports and building objects as well. Accordingly, it is non-trivial to extract exact performance amounts associated with particular activities. As such, enormous amounts of data often remain useless and disappear when the project is completed. This type of poor data management results from the disorganization of data structures and failures to link data with building components and objects (Cha and Lee Citation2018).
There have been many studies on construction information using various technologies to derive future productivity. For example, Tserng and Lin (Citation2004) conducted a research to accumulate and utilize activity-level information. In detail, it presented a novel process for data accumulation, classification, storage, and reuse. This information system was intended to be used for various types of management. Boussabaine and Duff (Citation1996) proposed a method to estimate productivity by constructing an expert system based on survey results.
Recently, a new technology-driven data analysis is another research endeavor, including advanced site information management organizer (ASIMO), 3D modeling, multi-dimensional personal digital assistant (MD-PDA) (Oh, Park, and Kim Citation2005; Tserng, Ho, and Jan 2014; Xie, Fernando, and AbouRizk Citation2011). In this area, many researchers analyze productivity using BIM (Gelisen and Griffis Citation2014, Feng, Chen, and Huang Citation2010; Shan and Goodrum Citation2014). BIM provides 3D objects for visually managing information. This is a very powerful technique for field data managers (Tserng, Ho, and Jan 2014).
In the study of Tserng, Ho, and Jan (Citation2014), the performance of the construction was visually displayed on a screen by using BIM to enhance information usability. However, it has a disadvantage in that a tremendous amount of information was needed at an initial stage. As such, a computerized system should be developed to maximize the benefit.
3. Preliminary industry investigation
3. 1. Expert survey results
To understand current on-site productivity/performance measurements, a rigorous expert survey was conducted. There were 10 participants having industry experience of 10–20 years. Based on the survey, productivity/performance data were managed using a standard format, including a daily work report. However, this reporting system was designed to show day-to-day work progress by describing resource inputs, performance outputs, and specific site conditions (i.e. weather, change orders, and labor issues). Furthermore, there were significant influential factors regarding the performance levels of the jobsite. Thus, there was no effective tool for capturing, storing, and recognizing the factors.
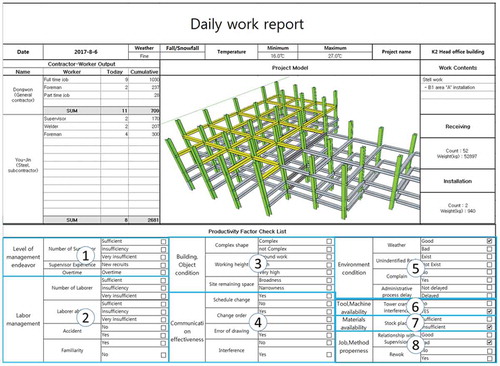
Many practitioners have agreed that the information from a daily work report is not fully used or effectively analyzed. Furthermore, reporting systems are regarded as unimportant. Thus, this process is typically delegated to inexperienced personnel. A vastly improved and easy-to-manage daily report information management system is required. Thus, this study analyzes daily reports based on the mentioned eight categorized influential factors linked to the current daily reporting system, as shown in .
As seen in (upper), laborer, environmental, material, tool/machine, job/method issues are easily recognized. Likewise, management and communication issues can be inferred from the comments or special-note sections. Finally, the building/object issues can be obtained when the 3D model is linked to the daily report as depicted. A detailed strategy of the datalink structure between the 3D/BIM model and daily report is provided in the following section.
Figure 2. Example of daily progress report
3. 2. Salient findings from investigations
As described earlier, a rigorous literature review revealed that there were eight categories related to the construction productivity influential factors. Because productivity plays a crucial role in performance enhancement, project managers were asked to identify and control one or more factors during the construction phase. Currently, on-site construction productivity and/or performance information must be recorded in a standard form. On-site construction data require tremendous and tedious workloads in a capture and retrieval process. In practice, construction engineers and managers use a standard worksheet-based program to reduce this workload. Microsoft ExcelTM is the dominant software tool. Current practices, however, fail to record, store, analyze, retrieve, and re-use construction productivity data captured in this way. Rather, much data is dispersed and buried once the project is completed. This practice shows that construction productivity is as bad or even worse than before, as claimed. Finally, recent BIM technologies have enabled the wide application of information systems at construction job sites. By linking productivity and/or performance data with 3D/BIM objects, a more powerful information management system can be developed, enabling project managers to efficiently interlink a variety of data with design elements. Moreover, when meaningful information can be used later, storage should be visually identified and distinguished. From the preliminary investigation, it is strongly required to develop a 3D/BIM-linked information management system to recognize/identify/control the productivity/performance of a project from the perspective of a job-site activity.
4. Development on-site performance measurement system (OPMS)
4. 1. Conceptual model of OPMS
The system has two different types of data flow: text- and object-based. Because construction data are generated from daily progress reports, these two formats are extracted from a standard Excel template. The unstructured dataset is transferred into a ready-to-use database by linking the 3D objects embedded in the 3D/BIM model. The 3D object model can instantly provide both locational and quantifiable data.
By tracking the pre-determined 3D object library, project progress can be measured effectively. Without this tracking process, the raw data obtained from the jobsite must be re-organized. In current practice, this work is often neglected because of insufficient on-site human resources. When the raw data are generated or inter-linked with the 3D/BIM model, a productivity database can be established, as shown in the bottom of .
Figure 3. Conceptual data model for OPMS
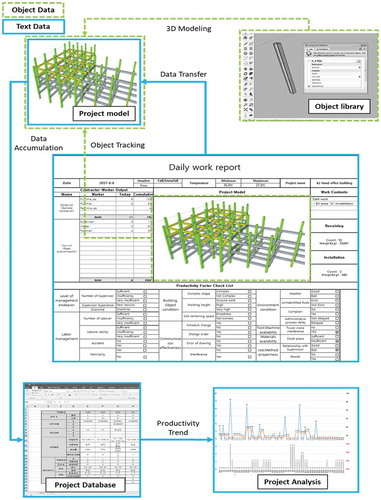
The database is automatically produced from the daily reports and 3D objects. Thus, a detailed level of analysis, in terms of productivity and performance of a particular project, can be conducted. For example, daily productivity loss/gain trend can be recognized by plotting the time-series graph of the target project. Project managers can forecast the performance of a project by predicting each productivity influential factor. Thus, the OPMS comprises three components: BIM-based product models, Excel-based work reports, and graphic-based analyses. The BIM-based product model is a tailored 3D object model that shows embedded building objects and detailed construction information. Excel is the standard format linked to the predefined database. The final output of performance/productivity is graphically provided to present the accurate status of the target project. A detailed demonstration of this conceptual algorithm is discussed in the following section.
4. 2. Case study demonstration
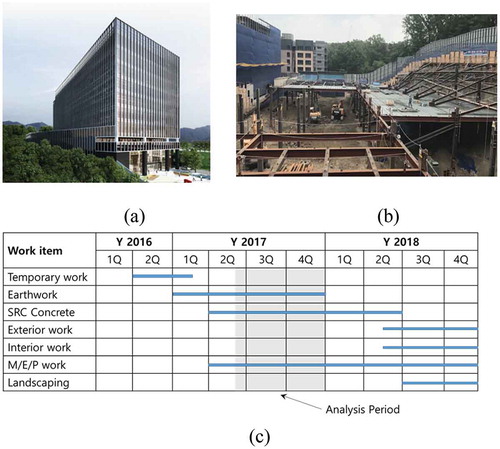
To verify the applicability of the OPMS, the authors pilot-tested a voluntary construction project. This building was a commercial office project located in Seoul. Total construction costs amounted to 55 USDM with a construction period of 26 months (November 2016 to December 2018) (). Owing to site restrictions, the project applied top-down non-shoring excavation technology, whereby both excavation and structural work occurred simultaneously. For the purpose of this study, a 7-month period (June to December 2017) was chosen to demonstrate the system. The entire set of daily work reports was analyzed and incorporated into the system. As shown in ), the major activities included earthwork and sulfate-resisting cement construction.
Figure 4. Case study project overview
(1) 1st Step: 3D Modeling
In OPMS, 3D/BIM modeling is a prerequisite for input performance data in the system. For this project, the authors completed a 3D/BIM model using two-dimensional (2D) drawings, as shown in .
Figure 5. 2D drawings (up) and 3D modelling (down)
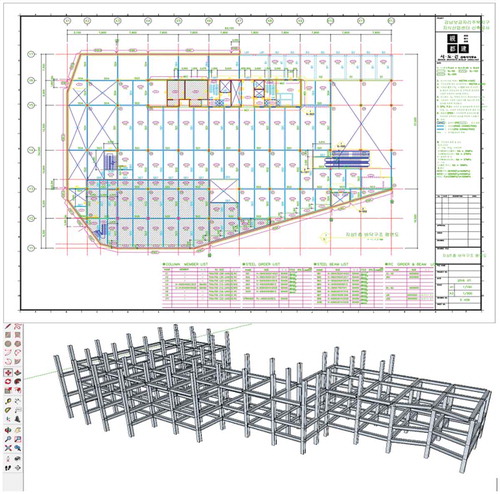
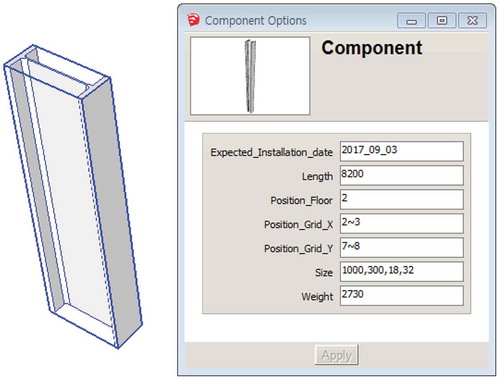
Using the structural drawings of the project (upper part of ), the steel components were modeled using 3D design software (i.e. Sketch-upTM). In the model, each structural member (i.e. bracket, strut, PRD pile, H-beam, supporter, raker, and gusset plate) were identified and embedded in the BIM library, as shown in . When modeling each component, property information (i.e. size, dimension, location, schedule, zoning, weight) were inputted into the BIM model.
Figure 6. Screenshot of exemplary 3D object
(2) 2nd Step: Daily Work Progress Reporting
After 3D/BIM modeling, daily work progress was reported using ExcelTM, as shown in . Using the standard form, specific work progress information was included with the aforementioned eight productivity influential factors. Project performance, obtained by computing how much the steel members were delivered, was automatically computed using the pre-established BIM model. As seen in , the green steel members (right) were installed on site, and the delivered items were colored yellow for June 2017 (left). The daily amount of installation amounted to 940 kg, as seen on the screen.
(3) 3rd Step: Database Analysis
The 7-month daily progress reports were incorporated to analyze project performance. The total quantity of work performed for the specific date was automatically computed based on the 3D/BIM software when the object was linked to the assigned database. Different colors were used to allocate whether the object was “delivered,” “installed,” or “completed.” When the model is linked with the location information in conjunction with the daily work report, one can easily recognize progress. Because the conventional reporting system is difficult to understand with regard to work performance, a graphical chart is useful for identifying project performance. As seen in , OPMS effectively demonstrates the trend of performance in terms of laborers, material deliveries, and installations of steel for the analysis period. Additionally, the productivity information embedded in the daily work progress report could be effectively monitored in real time, as seen in .
Figure 7. Automatic quantity computation of 3D model
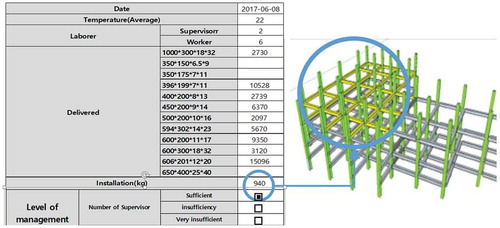
Figure 8. Graphical data analysis from OPMS system
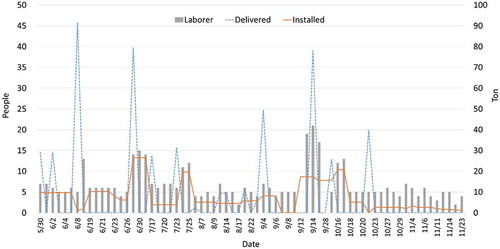
All productivity information is linked to the system-generated database. The demonstration result is depicted in in terms of manpower, material delivery, and installation. The results appear volatile according to date, and installation performance is dependent on both material delivery and labor availability. The performance level of late June is higher than that of mid-September, although the two resources are nearly the same. This phenomenon frequently happens at job sites because of the various levels of productivity-factor impacts.
(4) 4th Step: Productivity/Performance Feedback
The final step of the OPMS finds the relationship between project performance and productivity. This effort is required to predict the future performance and to provide corrective actions to improve productivity. By transforming the database of the previous step into a graphical diagram, the construction personnel can easily recognize the current status of the project in terms of productivity and performance (see ). The input information (i.e. manpower, materials, equipment, work contents, productivity factors) is stored in the database and analyzed to monitor productivity and predict performance. As seen in , the day-to-day cumulative number of steel members of actual and planned work are depicted. This graph is obtained from the OPMS database. The manpower productivity trend is provided in the form of a bar chart. This chart is created by dividing day-to-day steel-member installations by the number of laborers on site. Thus, the project managers can easily monitor project performance in consideration of resource inputs and outputs.
Figure 9. Performance trend linked to productivity database
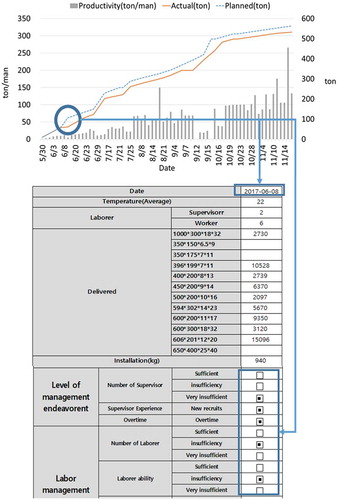
OPMS also enables project participants to provide critical factors that can be linked to poor performance by indicating pre-defined productivity influential factors. For example, shows a significant drop in labor productivity after June 8th (5 t/person). The OPMS system can promptly link the daily report to the corresponding day. As seen in , the database shows that there were poor levels of productivity influential factors (i.e. site environments, tools/machines, and job/method categories). Thus, the raw data related to on-site information of the daily report would be more valuable if it were managed via the proposed system.
4. 3. System validation
It is widely accepted that an academic idea or a system can be validated through direct examination of the knowledge base from an expert or a non-expert. The proposed system validation was conducted using an expert survey. In the construction area, the required number of experts surveyed was 8–10, each having at least 5 years’ experience (Yoon and Cha Citation2018). The proposed system was verified in terms of effectiveness and efficiency. The detailed questions and the mean value of each question are provided in .
Table 1. System validation results
The survey was conducted with 10 field construction managers having over 7 years’ site work experience. The scores were estimated using a Likert seven-point scale (i.e. 1 = very dissatisfied; 2 = moderately dissatisfied; 3 = slightly dissatisfied; 4 = neutral; 5 = slightly satisfied; 6 = moderately satisfied; and 7 = very satisfied). These results illustrate that performance improvements measured using OPMS were valid and reasonable when compared with the current system. Every expert confirmed that the current system lacked performance analysis and that the proposed system could provide an appropriate solution for this limitation.
From the survey, an average score of 5.13 indicates that OPMS was effective in measuring on-site performance. For Q.4, a relatively low score of 4.58 was obtained, because it took some time for respondents to link performance data to the 3D model. Therefore, it required additional effort when inputting the daily work data into the system. It is, therefore, recommended to automatically link the text and object data by providing a standard input system at the beginning stages to reduce the time-consuming effort. It is noteworthy, however, the validation is limited in terms of statistical significance. A full scale validation is required by expanding the number of respondents
5. Conclusions
This research proposed a novel methodology for inputting, processing, and outputting data to solve the problem of on-site productivity and/or performance information not being effectively managed. By developing an OPMS, it was found that productivity information was not properly managed and that there was much room for improvement at the job site. From preliminary investigations, eight productivity factors were derived and incorporated into the system presented in this study.
To prevent on-site administrators from spending unnecessary time with documentation, an information input method was suggested based on the 3D/BIM technology, such that it could be easily used in productivity analysis. Through this process, it is now possible to input productivity information using a process similar to existing daily recording practices. Furthermore, it is possible to effectively manage information input by storing it in a BIM database provided by the system. This case study demonstrates that the productivity and performance of information is effectively managed and useful when predicting future trends and providing potential corrective actions.
The main contribution of this research is twofold. First, the study identified eight on-site productivity factors that play crucial roles in measuring the levels of performance in a particular project. Second, the new system (i.e. OPMS) provided a useful tool for managing the productivity and performance of construction information and project performance. More specifically, BIM object-based productivity/performance management information offers higher potential for capturing real time performance data.
However, there are some limitations of this study as follows. First, the individual productivity factors are difficult to define and are influenced by other factors. Although key elements were derived from previous studies and interviews, factor quantifications and relative importance should be incorporated. It is also recommended that the influential factors should be quantitatively measured to be linked with the captured data. Second, the 3D/BIM model objects containing on-site productivity data should be linked and standardized. In this study, information was based on material and labor used for steel construction work. In the case of steel materials, shapes can be made differently for each company, and they may be customized according to project conditions. In the future, more standard models can be established with object libraries that can be expanded. Third, the data-capturing process of the proposed system remains manual-based. The construction jobsite is volatile, and data measurement is time- and effort-consuming. Thus, a new technology for data capture and measurement will be very beneficial (Taneja et al. Citation2010, Lee, Son, and Lee Citation2014). When considering laser scanning, drone technologies, and image analyses, the proposed system would become more powerful and efficient.
Acknowledgments
This research was supported by a grant (19RERP-B099826-05) from Residential Environment Research Program (RERP) funded by Ministry of Land, Infrastructure and Transport of Korean government.
Disclosure statement
No potential conflict of interest was reported by the authors.
References
- Boussabaine, A. H., and A. R. Duff. 1996. “An Expert-simulation System for Construction Productivity Forecasting: Conformation Method Used to Illustrate the Uncertainty Associated with Expert’s Knowledge.” Building Research and Information 24 (5): 279–286. doi:10.1080/09613219608727543.
- Cha, H., and C. Kim. 2011. “Quantitative Approach for Project Performance Measurement on Building Construction in South Korea.” KSCE Journal of Civil Engineering 15 (8): 1319–1328. doi:10.1007/s12205-011-1323-5.
- Cha, H., and D. Lee. 2018. “Framework Based on Building Information Modeling for Information Management by Linking Construction Document to Design Objects.” Journal of Asian Architecture and Building Engineering 17 (2): 329–336. doi:10.3130/jaabe.17.329.
- Dai, J., P. M. Goodrum, and W. F. Maloney. 2009. “Construction Craft Workers’ Perceptions of the Factors Affecting Their Productivity.” Journal of Construction Engineering and Management 135 (3): 217–226. doi:10.1061/(ASCE)0733-9364(2009)135:3(217).
- Dozzy, S. P., and S. M. AbouRizk. 1993. Productivity in Construction. Ottawa, Canada: Institute for Research in Construction National Research Council.
- Durdyev, S., S. Ismail, and N. Kandymov. 2018. “Structural Equation Model of the Factors Affecting Construction Labor Productivity.” Journal of Construction Engineering and Management 144 (4): 04018007. doi:10.1061/(ASCE)CO.1943-7862.0001452.
- Eastman, C., P. Teicholz, R. Sacks, and K. Liston. 2008. BIM Handbook: A Guide to Building Information Modeling for Owners, Managers, Designers, Engineers and Contractors. John Wiley & Sons .
- El-Gohary, K. M., R. F. Aziz, and H. A. Abdel-Khalek. 2017. “Engineering Approach Using ANN to Improve and Predict Construction Labor Productivity under Different Influences.” Journal of Construction Engineering and Management 143 (8): 04017045. doi:10.1061/(ASCE)CO.1943-7862.0001340.
- Ellk, L. D. S. 2018. “Establishing an Expert System for the I Dentifying Causing Problems to Reduce Productivity of Human Resources in Construction Projects.” Applied Research Journal 4 (1): 1–11.
- Feng, C. W., Y. J. Chen, and J. R. Huang. 2010. “Using the MD CAD Model to Develop the Time–cost Integrated Schedule for Construction Projects.” Automation in Construction 19 (3): 347–356. doi:10.1016/j.autcon.2009.12.009.
- Gelisen, G., and F. H. Griffis. 2014. “Automated Productivity-based Schedule Animation: Simulation-based Approach to Time-cost Trade-off Analysis.” Journal of Construction Engineering and Management 140 (4): B4013007.
- Heravi, G., and E. Eslamdoost. 2015. “Applying Artificial Neural Networks for Measuring and Predicting Construction-labor Productivity.” Journal of Construction Engineering and Management 141 (10): 04015032. doi:10.1061/(ASCE)CO.1943-7862.0001006.
- Jarkas, A. M., and C. G. Bitar. 2012. “Factors Affecting Construction Labor Productivity in Kuwait.” Journal of Construction Engineering and Management 138 (7): 811–820. doi:10.1061/(ASCE)CO.1943-7862.0000501.
- Khanh, H. D., and S. Y. Kim. 2014. “Determining Labor Productivity Diagram in High-rise Building Using Straight-line Model.” KSCE Journal of Civil Engineering 18 (4): 898–908. doi:10.1007/s12205-014-0521-3.
- Lee, C., J. Son, and S. Lee. 2014. “A System Model for Analyzing and Accumulating Construction Work Crew’ S Productivity Data Using Image Processing Technologies.” Journal of Asian Architecture and Building Engineering 13 (3): 547–554. doi:10.3130/jaabe.13.547.
- Martínez-Rojas, M., N. Marín, and M. A. Vila. 2015. “The Role of Information Technologies to Address Data Handling in Construction Project Management.” Journal of Computing in Civil Engineering 30 (4): 04015064. doi:10.1061/(ASCE)CP.1943-5487.0000538.
- McCullouch, B. G., and P. Gunn. 1993. “Construction Field Data Acquisition with Pen-based Computers.” Journal of Construction Engineering and Management 119 (2): 374–384. doi:10.1061/(ASCE)0733-9364(1993)119:2(374).
- Nasir, H., C. T. Haas, J. H. Rankin, A. R. Fayek, D. Forgues, and J. Ruwanpura. 2012. “Development and Implementation of a Benchmarking and Metrics Program for Construction Performance and Productivity Improvement.” Canadian Journal of Civil Engineering 39 (9): 957–967. doi:10.1139/l2012-030.
- Nguyen, L. D., and H. T. Nguyen. 2012. “Relationship between Floor Number and Labor Productivity in Multistory Structural Work: A Case Study.” In Construction Research Congress 2012: Construction Challenges in a Flat World, 1520–1529. West Lafayette, Indiana: ASCE. https://ascelibrary.org/doi/10.1061/9780784412329.153
- Oh, S. W., S. G. Park, and Y. S. Kim. 2005. “The Development of a Schedule Management Support System Using Productivity Information of Construction Activities.” Korean Journal of Construction Engineering and Management 6 (6): 181–192.
- Oral, M., and E. Oral 2007. “A Computer Based System for Documentation and Monitoring of Construction Labour Productivity.” In Proceedings 24th CIB W78 Conference “Bringing ICT knowledge to work”. June 26–29 2007, Maribor, Slovenia.
- Russell, A. D. 1993. “Computerized Daily Site Reporting.” Journal of Construction Engineering and Management 119 (2): 385–402. doi:10.1061/(ASCE)0733-9364(1993)119:2(385).
- Shan, Y., and P. M. Goodrum. 2014. “Integration of Building Information Modeling and Critical Path Method Schedules to Simulate the Impact of Temperature and Humidity at the Project Level.” Buildings 4 (3): 295–319. doi:10.3390/buildings4030295.
- Sherekar, V., and M. Tatikonda. 2016. “Impact of Factor Affecting on Labour Productivity in Construction Projects by AHP Method.” International Journal of Engineering and Computer Science 6: 6.
- Song, L., and S. M. AbouRizk. 2008. “Measuring and Modeling Labor Productivity Using Historical Data.” Journal of Construction Engineering and Management 134 (10): 786–794. doi:10.1061/(ASCE)0733-9364(2008)134:10(786).
- Sonmez, R., and J. E. Rowings. 1998. “Construction Labor Productivity Modeling with Neural Networks.” Journal of Construction Engineering and Management 124 (6): 498–504. doi:10.1061/(ASCE)0733-9364(1998)124:6(498).
- Taneja, S., B. Akinci, J. H. Garrett, L. Soibelman, E. Ergen, A. Pradhan, P. Tang, et al. 2010. “Sensing and Field Data Capture for Construction and Facility Operations.” Journal of Construction Engineering and Management 137 (10): 870–881. doi:10.1061/(ASCE)CO.1943-7862.0000332.
- Thomas, H. R., and I. Yiakoumis. 1987. “Factor Model of Construction Productivity.” Journal of Construction Engineering and Management 113 (4): 623–639. doi:10.1061/(ASCE)0733-9364(1987)113:4(623).
- Tserng, H. P., S. P. Ho, and S. H. Jan. 2014. “Developing BIM-assisted As-built Schedule Management System for General Contractors.” Journal of Civil Engineering and Management 20 (1): 47–58. doi:10.3846/13923730.2013.851112.
- Tserng, H. P., and Y. C. Lin. 2004. “Developing an Activity-based Knowledge Management System for Contractors.” Automation in Construction 13 (6): 781–802. doi:10.1016/j.autcon.2004.05.003.
- Xie, H., S. Fernando, and S. AbouRizk 2011. “Integrating Realtime Project Pro Gress Input into a Construction Simulation Model.” In Proceedings of the 2011 Winter Simulation Conference (WSC), 3443–3454. Phoenix, Arizona: IEEE.
- Yoon, J., and H. Cha. 2018. “Optimal FM Strategy for Commercial Office Buildings Using Fuzzy Synthetic Evaluation.” ASCE Journal of Performance of Constructed Facilities 32: 3.
- Zayed, T. M., and D. W. Halpin. 2004. “Quantitative Assessment for Piles Productivity Factors.” Journal of Construction Engineering and Management 130 (3): 405–414. doi:10.1061/(ASCE)0733-9364(2004)130:3(405).