
 ?Mathematical formulae have been encoded as MathML and are displayed in this HTML version using MathJax in order to improve their display. Uncheck the box to turn MathJax off. This feature requires Javascript. Click on a formula to zoom.
ABSTRACT
An analytical model was developed that accounted for double confinement provided by both transverse reinforcements and wide flange steel sections in the compression zone. This study also found that the amount of confinements was very sensitive to the post-yield behavior of the composite columns, especially when the buckling in compression region occurred. The nominal moment capacity and post-yield structural behavior of the composite columns were then calculated. The results were verified by comparison to numerical nonlinear finite element analysis results. The model was also verified experimentally. The post-yield behavior of the composite columns obtained from previous experimental studies and nonlinear finite element analysis based on concrete plasticity agreed well with those of the analytical results presented in this study, demonstrating a reliable and fast evaluation of the post-yield behavior of the composite actions. Fracture criteria for the concrete encasing steel columns under axial and lateral loads were also proposed based on the confinement offered by the steel sections encased in concrete. The new concept engaged in the estimation of the flexural strength of concrete columns confined by encased steel sections added innovations to the state of the art in the body of knowledge and advancement of the composite frames.
GRAPHICAL ABSTRACT
1. Introduction and research significance
1.1. Previous research and objectives
The use of steel-concrete composite columns, which combine the individual merits of the two materials, has increased significantly in recent years. Many studies have been performed to explore the post-yield behavior of steel columns encased in structural concrete (Brettle Citation1973; Bridge and Roderick Citation1978; Furlong Citation1974; Mirza and Skrabek Citation1992; El-Tawil and Deierlein Citation1999; Mirza, Hyttinen, and Hyttinen Citation1996). (Chen and Lin Citation2006) conducted a study to explore the axial compressive capacity of composite stub columns. More importantly, the emphasis of this modeling established stress–strain relationships for concrete confined by lateral reinforcement and by various structural steel sections of the composite columns. However, this model was proposed only for the estimation of the axial strength of columns without considering lateral forces, and is not able to predict the strength of the composite columns when flexural moments are applied.
A nonlinear three-dimensional finite element and fiber element models were proposed to simulate the inelastic behavior of mega SRC columns (Zhang, Zhao, and He Citation2012; Lu et al. Citation2013; Lu, Yin, and Jiang Citation2014; Zhang et al. Citation2012). They found that the steel ratio and axial compression ratio have significant effects on the seismic performance of mega SRC columns. Nonlinear analysis program was also developed based on fiber model to analyze the flexural behavior of steel-reinforced concrete (SRC) columns under axial and bilateral loading, finding that the flexural capacity is underestimated when the concrete confinement was not properly considered (Jiang, Li, and Zhu Citation2017). Recently, interesting studies of composite short columns with high-strength concrete encasing steel were published. Lai, Liew, and Xiong (Citation2019) investigated the axial compressive behavior of high-strength Concrete Encased Steel (CES) composite short columns. The structural performance was explored including failure pattern, load-carrying capacity, load-deformation response and post-peak ductility based on major parameters affecting the ultimate strength of composite columns such as concrete strength, spacing of transverse reinforcement bars, and the inclusion of steel fibers in the high-strength concrete. They found that the failure mode of CES columns with high concrete strength C120 is caused by concrete cover spalling, which triggered a sudden drop of compression capacity once the peak resistance was reached. Zhu, Meng, and Jia (Citation2014) performed an experimental investigation on the axial load performance of steel-reinforced high-strength concrete short columns. They found that stirrups affected ductility and residual strength of columns, but not the peak strength whereas structural steel influenced the peak, residual strength and ductility of columns. They concluded that the effect of structural steel on ductility is more obvious when the effective confinement index is larger. Lai, Liew, and Wang (Citation2019) tested three long Concrete Encased Steel (CES) column specimens made of high-strength concrete C100 and S355 H-section under axial compression, providing an insight into the buckling behavior of high strength (CES) columns. Their nonlinear finite element analyses also predicted the buckling resistance and trace the load-displacement behaviour of these columns. Lai, Liew, and Le Hoang (Citation2019) presented an experimental program studying a structural behaviour of high-strength Concrete Encased Steel (CES) composite columns, finding that steel contribution ratio played a dominant role in the ductility, whereas increasing hoop reinforcement ratio and adding steel fiber has negligible effect. They also proposed a simplified formula to evaluate ductility of high-strength CES columns.
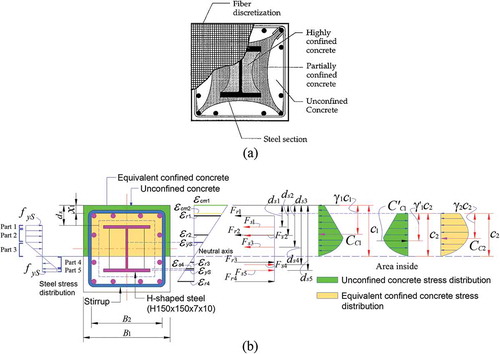
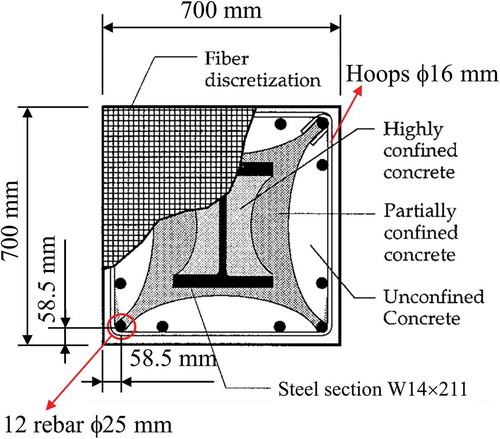
Hong et al. (Citation2015) presented a “modified strain compatibility approach” for a broad range of yield and load limit states which was limited to the frame without axial loads. This approach also did not consider the confining effect provided by steel sections to accurately predict the nominal flexural capacity, leading to inaccurate predicted strengths of the composite frames. Analytical investigations of inelastic behavior, particularly to understand the concrete confinement effect from the steel flanges of concrete-encased steel columns with both axial and lateral loads at concrete strains of 0.003, were reported by El-Tawil and Deierlein (Citation1999). In their approach, a steel section was discretized into many small regions in order to use the fiber method, and each region represents a fiber of material running longitudinally along the member (). In a statistical analysis of slender composite column strength (Mirza, Hyttinen, and Hyttinen Citation1996) subdivided concrete into three types: unconfined concrete outside the lateral ties, highly confined concrete between the steel web and flanges, and partially confined concrete located inside the lateral ties but outside the influence of the steel section.
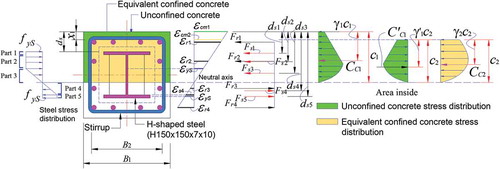
Figure 1. Two simplified zones with concrete stress-strain profiles and axial and lateral forces. (a) Concrete confined by stirrups and a steel section (Parabolic arching formed by the longitudinal bars and structural steel section El-Tawil and Deierlein Citation1999). (b) Strains, stresses, and corresponding force components at the maximum lateral load limit state for the column introduced by (Chen and Lin Citation2006) with 30% axial load column capacity (hoop spacing = 75 mm)
However, neither the work of (El-Tawil and Deierlein Citation1999) nor (Mirza, Hyttinen, and Hyttinen Citation1996) quantified the beneficial residual strength provided by the steel flanges in concrete strains between 0.003 and 0.01 when both axial and lateral loads were applied with considering confining effects provided by wide steel sections, although they stated that the presence of a large steel core provided the advantage of providing residual strength after concrete crushing, leading to improved ductility.
1.2. Methodology for prediction of in-elastic structural behavior of steel-concrete composite columns
Prediction of the flexural strength of steel columns encased in structural concrete has conventionally accounted for a single confining effect offered by transverse reinforcements. The flexural strengths of the composite columns were relatively well predicted for concrete strains up to 0.003 when the confinements of concrete provided by a wide flange steel section in the compression zone were not considered. However, the flexural strengths of the composite columns were significantly underestimated at large concrete strains without considering concrete confined by wide flange steel sections in the compression zone. The aim of this study is to present an analytical model for predicting the nonlinear in-elastic structural behavior of steel-concrete composite columns that accounts for concrete confined by both transverse reinforcements and steel sections. Additional confining effects provided by the wide flange of the steel section were divided into zones; a highly confined region and a partially confined region. These zones were idealized with the equivalent confining factor. The proposed analytical model was based on the curvatures obtained through the appropriate equivalent confinement factors, Ke, which were derived from the concrete confined by both transverse reinforcements and wide flange steel sections. This study presents an analytical model that considers the confining effects provided by the steel flange, and the results demonstrate post-yield behavior similar to that observed experimentally. The fracture criteria and strength with ductility of composite columns were determined with the analytical model accounting for the inelastic stress-strain response of concrete proposed by (Mander, Priestley, and Park Citation1988). The change in composite column behavior for varying nominal compression strength of concrete is considered, as is the concrete confinement by reinforcing bar ties. The analytical model was based on the elasto-plastic in tension and elasto-buckling of rebars and steels in compression. The buckling in compression region degrading composite columns was considered in the computational model developed in this study, demonstrating post-yield structural behavior similar to that reported by (El-Tawil and Deierlein Citation1999). Internal loads exerted from rebars and steel sections were calculated. The analysis is limited to short columns, and thus slenderness effects are not considered. The proposed analytical model made predictions based on the double confining effects, and its results were compared to experimental results and finite element analysis results. Rebars were assumed to buckle and lose their strength as a result of local buckling in the compression zone when the concrete cover reaches peak strength. Mathematical expressions were derived for the composite columns based on strain compatibility and were used to estimate the neutral axis and flexural moment strength interactions with axial forces. The equivalent confinement factor, Ke, was introduced to model the two concrete zones confined by the steel flange and hoops and can evaluate the influence of the wide flange of the steel section on the concrete confinement. The equivalent confining factors for highly confined and partially confined regions were determined, and idealized to account for the confinement provided by the wide steel flange in the constitutive material properties. The flexural load carrying capacity and post-yield behavior were examined at both the yield limit and maximum load limit states and were validated by previously published experimental data and numerical results from a nonlinear finite element analysis.
2. Analytical model of the concrete confined by hoops and wide-flange steel sections based on the equivalent confining factors
2.1. Equivalent confining factors
Parabolic arching was assumed for the area of the effectively confined concrete core by the reinforcing bars (Mander, Priestley, and Park Citation1988; Sheikh and Uzumeri Citation1982). In ), concrete was subdivided into the three types by Mirza, Hyttinen, and Hyttinen (Citation1996), including an unconfined concrete region outside the parabolic arching formed by the longitudinal bars, a highly confined region inside the arching formed by the steel section, and a partially confined region located outside the highly confined concrete region but inside the parabolic arching formed by the longitudinal bars.
In this study, these zones are simplified as two zones based on equivalent confined zone and unconfined zone, as shown in (b). Arching similar to that suggested by Mirza and Skrabek (Citation1992), El-Tawil and Deierlein (Citation1999) and Chen and Lin (Citation2006) was idealized as straight to form a concrete region confined by the structural steel section. The confinement factors (Kp and Kh) shown in EquationEquations (1(1)
(1) ) and (Equation2
(2)
(2) ) were defined by (Chen and Lin Citation2006) for the partially and highly confined concrete, respectively. However, there was no equations were provided to calculate Kp and Kh. Chen and Lin (Citation2006) found the Kp and Kh values which make their analytical model match the experimental results. In the present analytical model, the concrete stress–strain relationships in was proposed to define the equivalent confining factor (refer to EquationEquation (3)
(3)
(3) ), idealizing a highly confined region and a partially confined region. In EquationEquations (1
(1)
(1) –Equation3
(3)
(3) ), the equivalent confining factors accounted for the confinements provided by the transverse reinforcing steels and the wide steel flange.
Ke was determined by trial method. The different Ke values were tried until the calculated results matched the test results.
2.2. Constitutive models considering buckling of the longitudinal bars and structural steel
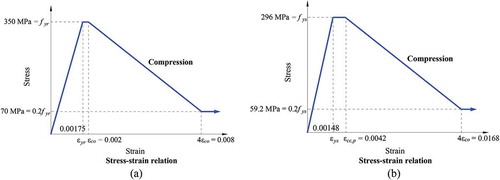
Chen and Lin (Citation2006) found the buckling strain of reinforcing bar and steel from the experimental results. A constitutive model for the longitudinal reinforcing rebars in the compression zone, shown in ), was suggested by (Bayrak and Sheikh Citation2001) based on the load-carrying capacity and inelastic buckling of the longitudinal rebars under the compression observed experimentally. The longitudinal bar under the compression reached the yield strength followed by a yield plateau. The stress of the rebars began to degrade when the axial strain of the rebars reached εco, which corresponds to the peak compressive stress, fco, of the unconfined concrete. It was assumed that spalling of the concrete cover caused the rebars to buckle and lose their strength when the concrete cover reached the peak strength. The stress of the rebars decreased to 20% of its yield strength when the axial strain reached a value of four times εco, and remained constant after that. A stress–strain relationship similar to that for the longitudinal rebars was also employed to model the structural steel section, as shown in ). The local buckling of the elements such as the flanges of the structural steel section was assumed to occur when the partially confined concrete reached a crushing strength. Stress degradation was assumed to occur after the axial strain reached εcc,p, which represents the crushing of the partially confined concrete. The post-peak strength of the steel sections decreased to the 20% of its yield strength when the axial strain reached four times εcc,p. An elasto-plastic constitutive relationship was used to model the longitudinal reinforcing steels and steel sections of the composite members subjected to a flexural bending moment in the tension zone.
Figure 2. Concrete stresses – strain relationships for zones based on equivalent confining factors (based the confined Mander curves)
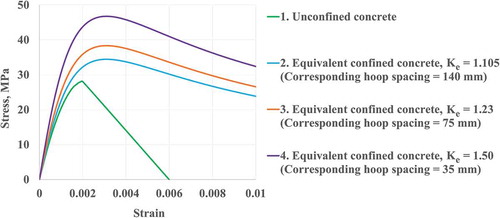
Figure 3. Stress–strain relations in compression and tension (Chen and Lin Citation2006). (a) Longitudinal reinforcing bar in (b) Structural steel in the compression zone (Chen and Lin Citation2006)
3. Analytical model of the confinement by transverse reinforcements and wide flange steel sections
3.1. Formulation of the analytical model
The geometric configuration of the steel column encased in the structural concrete is found in ), and the Appendix contains additional notations and dimensions of the section.
) shows the neutral axes satisfying the equilibrium of a section based on the two simplified zones, along with concrete stress-strain profiles. A formulation of the analytical model was performed at the maximum load and ultimate load limit states. The nominal flexural strength was calculated at the maximum limit state, whereas the ultimate flexural strength was obtained when the substantial contribution of the concrete was lost.
3.2. Maximum load limit state
Concrete compressive forces for the two zones, including the unconfined concrete zone (green regions in ), EquationEquations (4)(4)
(4) and (Equation5
(5)
(5) )) and the equivalent confined concrete zone (orange region in ), EquationEquation (6)
(6)
(6) ) were calculated, where
()) is the neutral axis of the section at the maximum load limit state. The depth of the compressive concrete block is indicated by
()), which represents the equivalent zone confined by the steel section.
The relationships between the compressive concrete blocks and the neutral axes, and
, are also established in EquationEquations (6)
(6)
(6) and Equation(A1)
(A1)
(A1) . These equations are based on the Mander confining curve. The mean stress factors (α) and centroid factors (
are derived in EquationEquations (A2)
(A2)
(A2) through Equation(A4)
(A4)
(A4) and (EquationA5
(A5)
(A5) ) through Equation(A7)
(A7)
(A7) in appendix, respectively.
3.3. Maximum load limit state with 30% axial load column capacity
The equivalent zone confined by the steel section was determined by the depth of the compressive concrete block, indicated by c2 in ), which illustrates the two idealized zones which includes the unconfined concrete zone (refer to green regions in ), EquationEquations (4)(4)
(4) and (Equation5
(5)
(5) )) and equivalent confined concrete zone (refer to orange region in ), EquationEquation (6)
(6)
(6) ), when 30% axial load of column capacity was exerted.
For the unconfined concrete (green region of )), the compressive forces on the concrete block are given by based on the Mander curve;
For the equivalent confined concrete (orange region of )), based on the Mander curves;
The compressive concrete blocks and the neutral axes, c1 and c2, in which the depth of each compressive concrete block was obtained from the neutral axis, c1. The compressive concrete blocks c2, the mean stress factors αi and the centroid factors yi were shown in the Appendix.
The equilibrium equations are given in EquationEquations (7)(7)
(7) and (Equation8
(8)
(8) ), from which the neutral axis,
is calculated.
or
The internal forces contributed by the structural components of the section for the tension are as follows:
The internal forces contributed by the structural components of the section for the compression based on EquationEquations (11)(11)
(11) through (Equation13
(13)
(13) ) are as follows:
The nominal moment strength at the maximum load limit state can be obtained using EquationEquation (14)(14)
(14) :
Finally, the flexural moment capacities provided by the structural components with respect to the centroid are as follows:
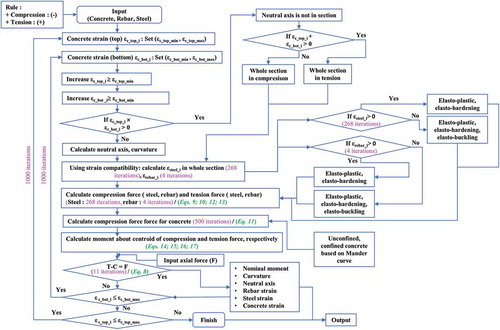
The neutral axis and the corresponding nominal moment capacity of a concrete section encasing the steel sections with the application of the axial loads were calculated based on the computation algorithm () when the concrete sections are confined by the hoops and the steel sections. This algorithm automatically analyzed entire sections from the top to the bottom of the composite section to locate the neutral axis of the section based on the iterations indicated in the flow chart. The internal loads exerted from the rebars and the steel sections for the given sections were also calculated to design the composite sections. More than 1.3 billion global and local sub-iterations were performed for each analysis, taking less than 10 min per column member using a desktop computer, to produce highly accurate neutral axes. The results including the nominal moment capacity and post-yield structural behavior of the composite columns were verified by the comparison to the numerical nonlinear finite element analysis results considering concrete damaged plasticity.
Figure 4. Computation algorithm and analytical equations used to calculate the nominal flexural moment capacity
4. Influence of the confining effect by steel sections on the steel columns encased in structural concrete
4.1. Verification analysis; study of (Chen and Lin Citation2006) with wide flanges steel sections and axial loads
(Chen and Lin Citation2006) tested the concrete encased steel composite column specimens with the wide flange steel sections, as shown in . The axial load–strain relationships published by (Chen and Lin Citation2006) are compared to the results of this study in for the varying compressive strains. The axial strengths predicted by the present analytical model of this study agreed well with the experimental and analytical data reported by (Chen and Lin Citation2006).
Figure 5. Test specimens of concrete encased steel composite columns with a wide flange steel section (Chen and Lin Citation2006)
Figure 6. Verification analysis of axial load–strain relationships for concrete with hoop spacings of 140 mm (29.5 MPa, SRC1), 75 mm (28.1 MPa, SRC2), and 35 mm (29.8 MPa, SRC3) and equivalent confining factors; columns tested by Chen and Lin (Citation2006) ()
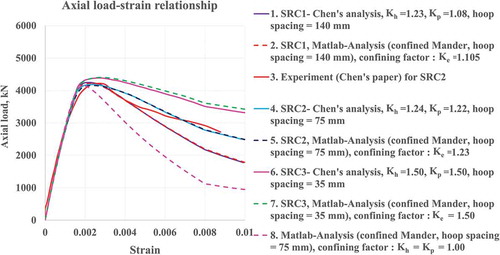
The analytical model in this study is based on an equivalent confining effect predicted for both the pre-peak and post-peak behavior. The degradation model for the longitudinal bars and structural steel was well established in the present model. The axial load–strain relationships corresponding to Lines 1&2, 4&5 and 6&7 in illustrate values at which the two studies had strong correlations. The confining factors (Kh and Kp) were 1.23 and 1.08, 1.24 and 1.22, and 1.5 and 1.5 for the hoop spacings of 140 mm (29.5 MPa), 75 mm (28.1 MPa), and 35 mm (29.8 MPa), respectively. These confining factors were idealized as 1.105, 1.23 and 1.5, respectively, as shown in . However, the axial load–strain relationship that was obtained based on an equivalent confining factor of 1.0 (Line 8 in ) exhibited considerable differences, indicating that the confining factors should be adjusted to account for the strength that is estimated based on the confining effect provided by the steel section. The test data (refer to Legend 3 in ) published by (Chen and Lin Citation2006) were in relatively good agreement with their analytical results and with the results of the model proposed in this study. The present study located the neutral axis depth exerted by both axial load and moment whereas the experimental and analytical investigation of (Chen and Lin Citation2006) based on axial loads only was not able to find neutral axis due to the absence of the lateral loads.
4.2. Verification analysis; study of (El-Tawil and Deierlein Citation1999) with the wide flanges steel sections and axial/lateral loads
4.2.1. Verification analysis column S-08-L with axial and lateral load combinations; highly (100 mm) and lightly (320 mm) confined columns with strength = 28 MPa
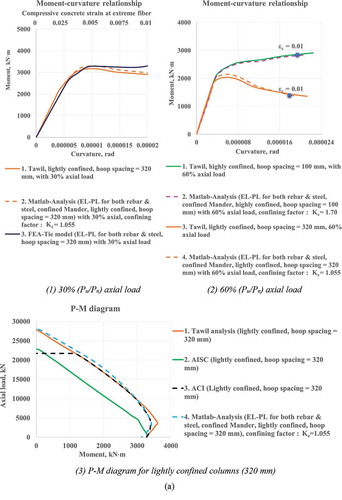
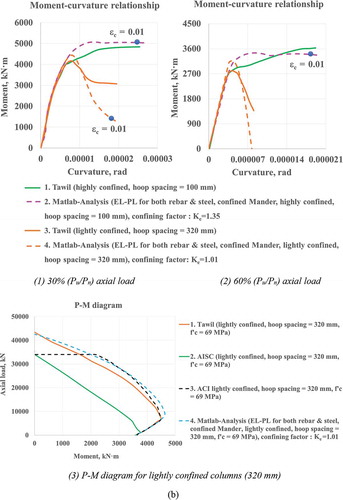
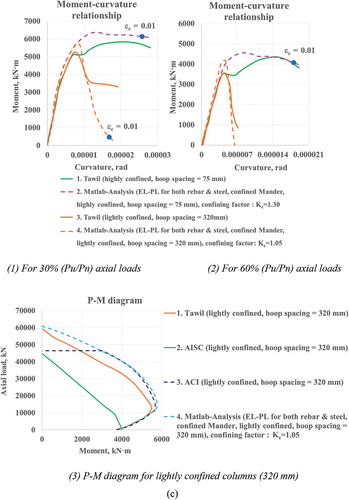
(El-Tawil and Deierlein Citation1999) performed a numerical analysis on the sections having a steel ratio of As/Ag = 0.08 (denoted as S-08) and low strength (28 MPa, denoted as L), medium strength (69 MPa, M) and high strength (110 MPa, H) concrete, as shown in ,b). In ), a transverse hoop reinforcement of 16 mm in diameter with four branches was placed at 100 mm for the concrete with f’c = 28 and 69 MPa, and at 75 mm for the concrete with f’c = 110 MPa in accordance with the seismic provisions in AISC/LRFD for the special moment frames. The transverse reinforcement in ) consisted of 16 mm diameter ties spaced at 320 mm in accordance with the non-seismic standard ACI 318 requirements. The analytical results for the concrete strength (28 MPa) obtained by this study (refer to Legend 2 of -1,a-2)) are compared to the data published by (El-Tawil and Deierlein Citation1999) for the axial loads of 30% of Pu/Pn and 60% of Pu/Pn as shown in -1) and (a)-(2) where the good correlations for both the highly and lightly confined columns were also exhibited up to the concrete strain of 0.01 for the axial loads of a 60% of Pu/Pn. In -1), the moment–strain relationships obtained from the finite element analysis considering the damaged concrete plasticity were also well correlated with that predicted by the proposed analytical model for the axial loads of 30% of Pu/Pn.
Figure 7. Composite columns S-08 (El-Tawil and Deierlein Citation1999). (a) Details of Seismic Hoop Reinforcement for S-08. (Hoop spacing @ 100 mm (highly confined) for concrete with f’c = 28 and 69 MPa, and @ 75 mm for 110 MPa). (b) Prototype composite columns S-08 (Hoop spacing @ 320 mm (lightly confined) for non-seismic standard)
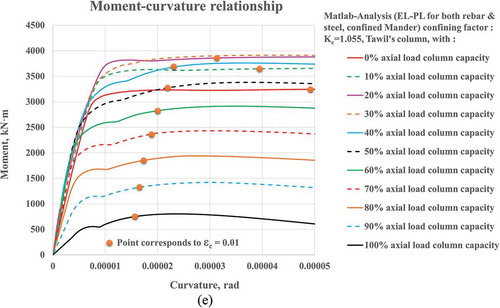
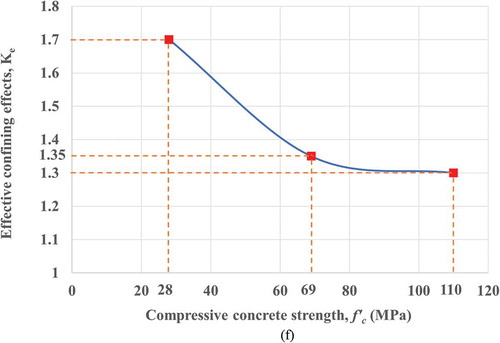
Figure 8. Failure criterion of the column described in based on the confined concrete by both rebars and encased steel section; columns tested by El-Tawil and Deierlein (Citation1999). (a) Verification analysis column S-08-L with axial and lateral load combinations; highly (100 mm) and lightly (320 mm) confined columns with strength = 28 MPa. (b) Verification analysis column S-08-M with axial and lateral load combinations; highly (100 mm) and lightly (320 mm) confined columns with strength = 69 MPa. (c) Highly (75 mm) and lightly (320 mm) columns S-08-H of 110 MPa strength. (d) P-M diagram for highly confined columns (100 mm) of 28 MPa. (e) Influence of axial load ratio (Pu/Pn) on the moment–curvature relationships for highly (100 mm) confined composite columns with low concrete strength (28 MPa). (f) Influence of the confining effects vs. concrete strength
(Continued)
(Continued)
(Continued)
(Continued)
(Continued)
4.2.2. Verification analysis column with the axial and lateral load combinations; highly (100 mm) and lightly (320 mm) confined columns with strength = 69 MPa and 110 MPa
Good correlations for the highly confined columns with a medium concrete strength (M = 69 MPa) at both the axial load ratios (30% and 60% of Pu/Pn) similar to those obtained from the low concrete strength (L = 28 MPa) are presented in -1,b-2). Relatively good correlations were exhibited by the lightly confined columns at 30% and 60% of Pu/Pn axial loads up to the strain of 0.01, as can be seen in -1,b-2). The moment–strain relationship for the column with a concrete strength of 110MPa (H) is shown in ) which was similar to one observed from the column with concrete strength of 69 MPa.
4.2.3. P-M diagram
For the columns tested by (El-Tawil and Deierlein Citation1999) (refer to ), the P-M interaction diagrams (refer to -3,b-3,c-3)) obtained by the analytical model of this study were compared with those calculated by the AISC, ACI codes and (El-Tawil and Deierlein Citation1999). For the lightly confined columns (hoops at 320 mm) having a compressive concrete strength of 28 MPa shown in -3), the present study demonstrates the axial-moment interaction diagram similar to that of both the ACI code and (El-Tawil and Deierlein Citation1999); the model proposed in this study correlated with that by the ACI code better than those of the (El-Tawil and Deierlein Citation1999) in the regions with low axial loads. The present study demonstrates the P-M interaction diagrams similar to the P-M interaction diagrams obtained by the ACI code for the lightly confined columns (hoops at 320 mm) having a compressive concrete strength of 69 and 110 MPa for the entire axial loads as can be seen in -3,c-3); better correlation with the ACI code was found by the present model than one provided by (El-Tawil and Deierlein Citation1999) when a compressive concrete strength of 69 and 110 MPa were used.
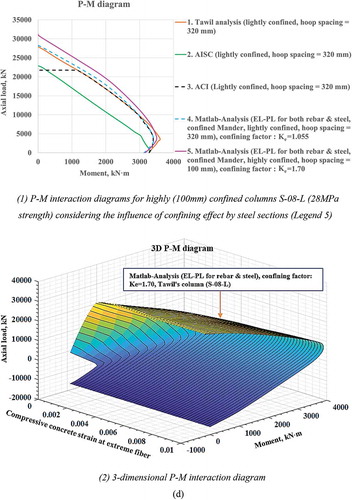
4.2.4. P-M diagram for highly confined columns (100 mm) of 28 MPa
The P-M interaction diagrams calculated by the AISC, ACI (El-Tawil and Deierlein Citation1999) and the presents study for the wide flange steel section are compared in -1) where the P-M interaction diagrams for the highly confined (hoops at 100 mm) columns (28MPa strength), identifying the influence of the confining effect by steel sections (refer to Legend 5 of -1)) was presented. As can be seen with the P-M diagram derived for a concrete strength of 28 MPa indicated by Legend 4 of -1), it was demonstrated by the P-M diagram that both the models by (El-Tawil and Deierlein Citation1999) and the present study demonstrate a good correlation with that of the ACI when the confining effect provided by the steel sections was not considered (refer to Ke = 1.055). However, the P-M diagram calculated by the ACI and (El-Tawil and Deierlein Citation1999) was slightly underestimated when the confining effect provided by the steel sections was considered (refer to Ke = 1.7) as shown in the P-M diagram for the highly confined columns represented by Legend 5 of -1). This is because that the P-M diagram calculated by the ACI did not consider the confining effect provided by the steel sections.
4.2.5. Influence of the axial load ratio (Pu/Pn) on the moment–curvature relationships for the highly (100 mm) confined composite columns with the low concrete strength (28 MPa)
The effect of the axial loads ratio (Pu/Pn) on the moment–curvature relationships of the highly confined composite columns with the 100 mm spaced hoops and a concrete strength (L = 28 MPa) is illustrated in ). This figure provides the failure criterion of the column described in ) based on the confined concrete by both the rebars and the encased steel section for the wide strain range. The composite columns can be designed in the consideration of the confining effects by the both confining components based on this graphical assistance to determine the performance-based structural capacity of the composite concrete columns encasing the steel sections. The confining effects became less influential as concrete strength increased, as shown in ).
5. Nonlinear finite element analysis
5.1. Three-dimensional FE model for steel-concrete composite column
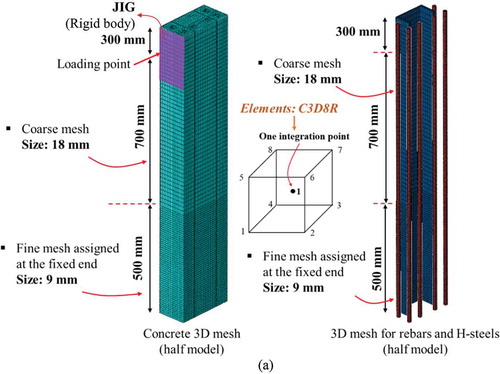
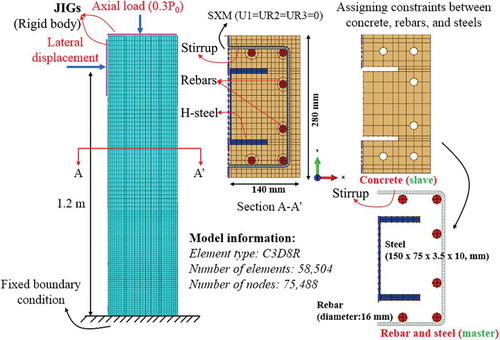
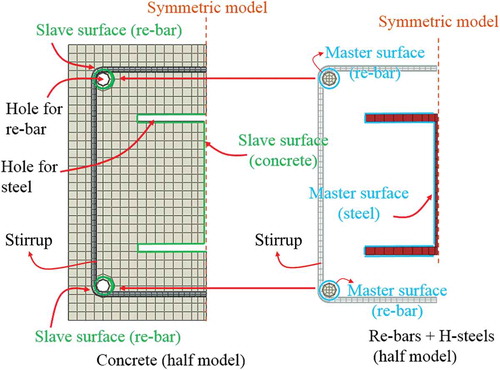
The finite element (FE) model was discretized based on C3D8 R solid elements, as shown in and . A fine mesh of 9 mm was used for the fixed end of the column while a coarse mesh of 18 mm was used at all other locations (refer to )). A symmetric modeling technique (SXM = U1 = UR2 = UR3 = 0) was employed in this study to reduce the number of degrees of freedom (DOF), as well as to enhance the solution accuracy of the analysis. The embedded model was used for the stirrups. The stirrups were considered as the elements that embedded in the concrete (called host region). In the first step of the analysis, the FE model was loaded with an axial load equivalent to 30% of the axial capacity (P0) of the composite column introduced by (Chen and Lin Citation2006). Then, a constant lateral load controlled by the displacement was exerted at a height of 1.2 m (see )) until the steel-concrete column reached failure. In , the interactions between the concrete, reinforcing bars, and steel were modeled based on the cohesive contacts and tie constraint method available in ABAQUS User’s Manual (Dassault Systèmes Simulia Corp Citation2014). The two surfaces, the master and slave surfaces, were chosen as depicted in . The surfaces of the H-steels and reinforcing bars were defined as master surfaces, whereas the concrete surface was defined as a slave surface. The yield strengths of the H-steel and rebars were 296 MPa and 350 MPa, respectively. The nonlinear concrete behaviors were investigated based on a concrete damage plasticity model. The constitutive relationships for the concrete material were established based on the unconfined stress-strain curve suggested by (Mander, Priestley, and Park Citation1988). The concrete compressive strength was defined as 28 MPa, while the tensile strength of the concrete was assigned a value of 2.8 MPa. The dilation angle, viscosity, eccentricity, fb0/fc0 ratio, and Kc parameters were assigned of 30°, 0.003, 0.1, 1.16, and 0.6667, respectively. The 30° dilation angle was also selected based on the recommendations in a study published by (Malm Citation2006). Both the dilation angle and the eccentricity were incorporated into the non-associative Drucker-Prager (DP) formulation, which is given in EquationEquation (18)(18)
(18) ;
where is the dilation angle measured in the p-q plane at high confining pressures. σto is the uniaxial tensile stress,
is the hydrostatic pressure,
is the von Mises equivalent effective stress, and
is the eccentricity of 0.1. A viscosity value of 0.003 was assigned to lower the plastic degradation of the concrete material, leading to a better convergence.
Figure 9. Three-dimensional FE model developed for use with the composite column: elements and discretization. (a) FEA meshes. (b) Application of axial loads on symmetric model. (c) Constitutive relations with concrete damaged plasticity (CDP); scalar damage variables (Hong Citation2019)
(Continued)
(Continued)
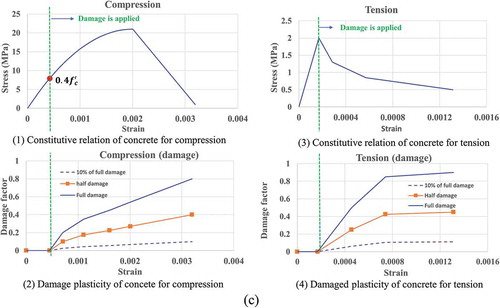
Figure 10. Modeling of reinforcing bars and steels in steel–concrete composite members; tie modeling technique (Nzabonimpa Citation2018)
) shows the constitutive relationship of concrete in uniaxial tension and compression with the concrete damaged plasticity (CDP), where the scalar stiffness degradation variables for compression and tension defined by dc and dt, respectively. Readers are referred to Abaqus manual (Dassault Systèmes Simulia Corp Citation2014) for details of descriptions. In ), the damage parameters for full, half, and 10% degradations were illustrated in the concrete damaged plasticity model of the unconfined concrete (compressive strength of 21 MPa) proposed by Kent and Park. The softening of concrete in the compression region began from the end of the linear region (equivalent to 0.4 f’c) whereas the damages in the tension region initiated after the concrete reached its maximum tensile stress, σt0, which is equivalent to 1/10 of the compressive strength of concrete, σcu. Abaqus manual for details of descriptions can be also referred.
5.2. Non-linear finite element analysis with the concrete damaged plasticity (CDP)
(Chen and Lin Citation2006) tested the wide flange steel columns encased in the structural concrete depicted in . The geometric and material properties of these composite columns and the material properties used in the analytical modeling are summarized in and . (Chen and Lin Citation2006) stated that the confining effect was enhanced by the structural steel, indicating that the confinement factor (Kh) for the highly confined concrete, and the confining stress on the core concrete was influenced by the shape of the structural steel section. The present study performed a numerical investigation of the proposed frames using a finite element analysis (FEA) that accounts for the concrete plasticity to explore the confining effects of the wide flange steel. An earlier study (Hu, Hong, and Park Citation2017) identified the nonlinear FEA parameters for predicting the structural behavior of the steel sections encased in structural concrete.
Table 1. Geometric properties of the composite columns
Table 2. Material properties
5.3. P-M interaction diagram based on the double confinement
5.3.1. Strain evolutions
The analytical model presented in this section considered both the axial load and moment, capable of determining changes in the neutral axis depth due to the lateral loads, while the model suggested by Chen and Lin (Citation2006), based on the axial loads only, was not able to consider changes in the neutral axis depth changed by the lateral loads for their experimental and analytical investigation. ) shows the axial force-moment (P-M) interaction diagram for the columns with a compressive strength of 28.1 MPa (column introduced by Chen with a hoop spacing of 75 mm) accounting for the double confinement provided by both transverse reinforcements and a wide flange steel section in the compression zone. In the P-M interaction diagrams ()), the strains evolved between 0.001 and 0.01 with an equivalent confining factor (Ke, obtained from the average of Kh and Kp) of 1.23. The equivalent confining factor (Ke) of 1.23 provided the axial and flexural strengths similar to those obtained using Kh (1.24) and Kp (1.22), for a hoop spacing of 75 mm, shown in ).
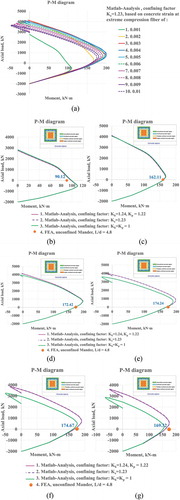
Figure 11. P-M diagrams for strain evolutions (equivalent confining factors) with a hoop spacing of 75 mm, EL-PL for rebar & steel except EL-buckling for rebar in compression columns with compressive strength of 28.1 MPa tested by (Chen and Lin Citation2006) (, SRC2). (a) P-M diagrams for concrete with a hoop spacing of 75 mm and concrete strains between 0.001 and 0.01. (b) Concrete strain of 0.001. (c) Concrete strain of 0.002. (d) Concrete strain of 0.003. (e) Concrete strain of 0.005. (f) Concrete strain of 0.007. (g) Concrete strain of 0.01
5.3.2. Fracture criteria
The fracture criteria were presented at the ultimate limit state. A strain level of 0.01 was established as the ultimate limit state, and it was recommended that the performance limit of the composite columns can be evaluated at this limit state. The selected P-M interaction diagrams are shown in –g). The P-M diagram showing the interaction between the axial force and moment interaction decreased for a concrete strain greater than 0.003 because the degradation of the concrete strength commenced at a concrete strain of 0.003 (). In –g), the P-M diagrams for the columns with equivalent confining factors are compared to those for the columns that did not consider the confinement provided by the wide steel flange for the concrete strains of 0.001, 0.002, 0.003, 0.005, 0.007 and 0.01. The strengths provided by an equivalent confining factor of 1.23 were compared with those obtained when the equivalent confining factors was fixed at 1.0. The fracture criteria based on the flexural strengths of the composite columns with zero axial load well correlated with the finite element results for the concrete strains less than 0.005 (–e)). However, the flexural strengths were considerably underestimated for the larger concrete strains (,g)) when the confinement provided by the wide flange steel section in the compression zone was not considered. This became more apparent at concrete strains greater than 0.003 ()) when axial forces increased. This underestimation of the composite columns was observed where there were considerable differences between the strength estimated by accounting for the confining effect provided by the steel section and the strength estimated while ignoring the confinement from the steel section. The degree of underestimation increased with increasing the axial loads on the composite columns, as shown in . The flexural capacities at the maximum load and design load limit states (εc = 0.003) with a 30% axial load column capacity are presented in . In (b), the 5% decrease of the flexural strength was observed based on the equivalent confining factor of 1.5 at maximum load limit state when the buckling for the rebars in compression is considered.
Table 3. Flexural capacities of the columns tested by Chen and Lin (Citation2006) at the maximum and design load and design load limit states (εc = 0.003) with 30% axial load column capacity, Ke;1.105 (140 mm, 29.5 MPa); 1.23 (75 mm, 28.1 MPa); and 1.5 (35 mm, 29.8 MPa)
6. Fracture criteria based on the three-dimensional P-M interaction diagrams
6.1. Three-dimensional P-M diagrams and the fracture criteria
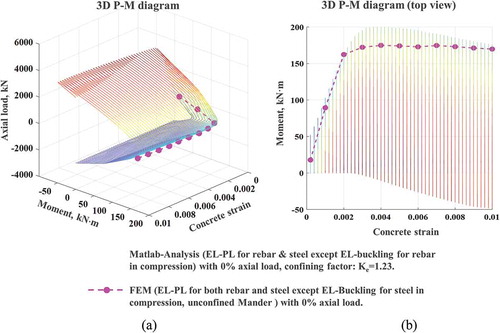
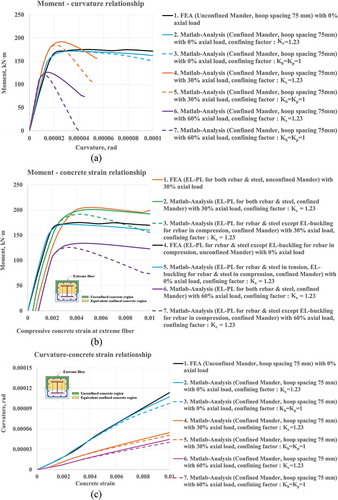
Three-dimensional P-M diagrams are presented in for the column proposed by (Chen and Lin Citation2006) (), where the three axes represent the axial force, the moment and the compressive concrete strains in the extreme fiber. Fracture surfaces are identified for the strains between 0.001 and 0.01 shown in ). The material properties, dimensions and geometry used in the construction of the three-dimensional P-M diagrams in ,b) were identical to the test specimen used in . The hoops spaced at 75 mm with the double confinement based on the equivalent confining factors provided by both the transverse reinforcements and the wide flange steel section in the compression zone was considered in the three-dimensional P-M diagrams. In the FEA model, an elasto-buckling relationship for the rebar in compression was implemented whereas the elasto-plastic relationship for both the rebars and steel sections in tension was used. The buckling model introduced in ) was implemented to account for the compressive fracture of the rebars due to the flexural bending of the sections. For the concrete strains between 0.001 and 0.01, the equivalent confining factors of 1.5, 1.23 and 1.105 for the hoop spacings of 35 mm, 75 mm and 140 mm, respectively, were found to reflect the confinement effect due to the wide steel flange. The analytical fracture curves with the confining effects by the steel section were consistent with the FEA results, as shown in . ,b) illustrates the evolution of the fracture criteria for the strains from 0.001 to 0.01. The moment–curvature relationships for the columns proposed by (Chen and Lin Citation2006) for the varied compressive concrete strains (curvatures) and the axial loads are presented in ,b) with results that account for the confining effects (Ke = 1.23) by the steel sections. The moment-concrete strain relationships were obtained for the specified axial loads. The moment-concrete strain relationships were well compared to the nonlinear finite element analysis accounting for the concrete damage plasticity with no axial loads. The finite element model used in ,b) considers elasto-plastic for rebars and steel sections except for implementing rebar bucking in compression zone, verifying the evolution of the fracture criteria. The P-M diagrams shown in –g) are summarized in the three-dimensional P-M diagrams shown in ) and moment-concrete strain (axial) relationships shown in ). The flexural moment capacity from the finite element study were well compared with those from the analytical model developed in this study for the strain ranges between 0.001 and 0.01 when were no axial loads.
Figure 12. Three-dimensional fracture surfaces; columns with compressive strength of 28.1 MPa tested by Chen and Lin (Citation2006) (, SRC2). (a) Three-dimensional P-M diagrams (b) Moment-concrete strain (axial) relationships
6.2. Influence of the confining effect by the steel section with the buckling of rebars
In , the concrete strains were evaluated at the extreme fiber in the compressive concrete region. The influence of the axial load and the confining effects provided by the steel sections on the flexural strength of the composite columns were evaluated. In ), the influence of the confinement provided by steel sections was identified at varying curvatures and axial loads with considering the buckling of the rebars. As seen by comparing the moment–strain relationships indicated by Legends 4/5, and 6/7 in ) where the rebar bucking in the compression zone was considered, the flexural strength substantially decreased for the strains greater than ones corresponding to the maximum flexural strength when the confinement effect was neglected. In ), influence of the rebar buckling was identified at varying compressive concrete strains and axial loads. It is worth noting in ) that, the flexural moment capacity of the composite sections degraded rapidly as the axial load increases as shown in the flexural moments indicated by Legends 2 and 3 for 30% axial loads and by Legends 6 and 7 for 60% axial loads, respectively, when the rebar bucking in the compression was considered. This tendency became even more significant as the axial load increases. However, the differences were no longer significant for the flexural moments indicated by Legends 2 and 3 without the axial loads. The curvature–strain relationships shown in ) demonstrate that the curvatures were underestimated when the confinement effects of the steel sections were ignored. The analytical model was well verified by the nonlinear FEA analysis, as illustrated in –c).
Figure 13. Moment–curvature relationships for results that either account for or ignore the confining effects from steel sections encased in columns with compressive strength of 28.1 MPa tested by Chen and Lin (Citation2006) (, SRC2). (a) Influence of confining effect by steel section with buckling of rebars (EL-PL for both rebar & steel except EL-buckling for rebar in compression) (moment vs. concrete curvature). (b) Influence of rebar buckling with confining effect by steel section (hoop spacing 75 mm). (c) Curvature vs. compressive concrete strains identifying the influence of confining effect by steel sections (EL-PL for both rebar & steel except EL-buckling for rebar in compression)
6.3. Idealized equivalent confining factors for the double confinement
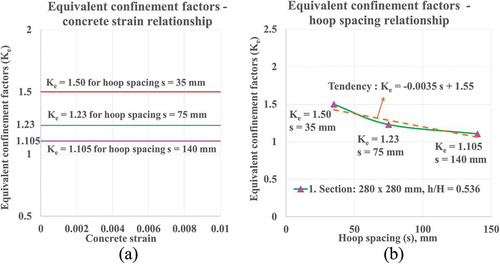
The equivalent confining factors do not vary relative to the compressive concrete strains, as shown in ). The equivalent confining factors are idealized in ) as a function of the hoop spacing. The equivalent confining factors decreased with increasing the hoop spacing distance, suggesting that the confining factor was approximately 1.5 at a hoop spacing of 35 mm decreasing to 1.1 at a hoop spacing of 140 mm.
Figure 14. Idealized equivalent confining factors for the double confinements without lateral loads; columns with a compressive strength of 28.1 MPa tested by Chen and Lin (Citation2006) (, SRC2). (a) Equivalent confining factors at varying concrete strains. (b) Equivalent confining factors with varying hoop spacing
7. Conclusions
Traditionally, the investigation of the confinement effect offered by the steel sections has not received an appropriate amount of attention. This may cause an underestimate of the flexural load bearing capacity of steel columns encased in structural concrete at the ultimate limit state, leading to conservative estimation of their performance-based capacity. The confining effects of the steel sections should not be ignored for the strains greater than 0.003 when the axial loads are applied. The moment–curvature relationships accounting for the confining effects by the steel sections obtained with the proposed analytical model agreed well with the results of the FEA study at limit states including the yield, maximum load and ultimate load limit state. The following conclusions were drawn from the present analytical and experimental studies.
7.1. Analytical model based on the equivalent confining factors
The analytical model in which the concrete confinements provided by the rebars and steel sections were implemented was developed to obtain the interactions between the moments and axial forces based on the concrete confinements by the rebars and steel sections. The equivalent confining factors accounting for the double confinement were idealized based on the concrete encased steel composite columns with a wide flange steel having different hoop spacings (35 mm, 75 mm and 150 mm) tested by (Chen and Lin Citation2006). The equivalent confining factor decreased to 1.105 at a hoop spacing of 140 mm from a value of 1.5 at a hoop spacing of 35 mm for the specimen described by (Chen and Lin Citation2006). The equivalent confining factors decreased with increasing hoop spacing, indicating that the confinement by the steel section was less influential as the hoop spacing increased. The equivalent confining factors did not change for the concrete strains between 0.001 and 0.01. The more reliable relationships between the confining effects and the spacing of hoop reinforcements need to be obtained based on the additional test data. The equivalent confining factors (Ke,) introduced to consider the confinements provided by steel sections were verified with FEA.
7.2. Performance and the fracture surfaces of the concrete columns encasing steel sections
The elasto-buckling constitutive relationships for the rebar and steel sections in the compression, and the elasto-plastic relationship in the tension were implemented. The concrete was modeled based on the confined Mander constitutive equations, whereas the unconfined constitutive equation was used to represent the concrete outside the hoop rebars. It seemed that the amount of the confinements was very sensitive to the post-yield behavior of the composite columns, especially when the buckling in the compression region degraded the columns. The buckling of both the rebars and steel sections was considered in the computation developed in this study, which demonstrated the post-yield structural behavior similar to that reported by (El-Tawil and Deierlein Citation1999). The flexural strengths at the large strain levels were significantly underestimated without considering the confining effects provided by the steel sections when the axial forces were applied. This tendency became more significant when the buckling of the rebars and steel sections in the compression zone occurred. The traditional P-M diagrams under the axial force and moments were recommended to be modified for the concrete strains greater than 0.003 to account for the confinement provided by the wide steel flange. This study showed how the accurate prediction of the flexural strength and performance of the composite columns encasing steel sections at the ultimate limit state were performed based on the confinement offered by the steel sections encased in concrete. For the highly axially loaded columns, the flexural strengths substantially different from those based on no consideration of the confinements offered by the encased steel sections occurred in the range of the concrete strains between 0.003 and 0.01. It was noteworthy that, for the highly confined columns, ACI code (El-Tawil and Deierlein Citation1999) can underestimate the P-M diagram at the large concrete strains when the confining effects provided by the steel sections were ignored. The design application and the use of the confinement offered by the encased steel sections should be implemented based on the accurate performance of the steel-concrete composite columns. This study presented the fracture surfaces of the columns based on the interaction of the moments with axial forces. The analytical model takes into consideration of the confinement by the transverse hoops and the steel sections with wide flanges. The constitutive relationships of the composite columns based on the appropriate confining factors determined by the double confining effect were verified with the nonlinear finite element analysis considering the concrete plasticity.
Nomenclature
| Ari | = | area of rebar layer i (i=1-4), mm2; |
| Asi | = | area of part i of H-steel section, mm2; |
| B | = | width of the concrete section, mm; |
| Bi | = | width of unconfined, equivalent confined concrete area (i =1 - 2), mm; |
| ci | = | height of concrete compression zone of unconfined, equivalent confined concrete area (i =1 - 2), mm; |
| Cci | = | compressive force given by unconfined, equivalent confined concrete area (i=1,2), kN; |
| C’c1 | = | compressive force given by equivalent confined concrete area inside, kN; |
| D | = | height of the concrete section, mm; |
| di | = | distance from rebar layer i (i=1-4) to top of concrete section, mm; |
| dc | = | distance from centroid to top of the concrete section, mm; |
| ds | = | distance from top flange of H-steel to top of the concrete section, mm; |
| dsi | = | distance from the force given by the part i of H-steel to top of the concrete section, mm; |
| Es | = | Young’s modulus of steel, MPa; |
| Er | = | Young’s modulus of rebar, MPa; |
| Fri | = | force given by rebar layer i (i=1,4), kN; |
| Fsi | = | force given by part i of H-steel section (i=1,4), kN; |
| εcmi | = | strain at fiber of unconfined, equivalent confined concrete area (i =1- 2); |
| εyR | = | yield strain of rebar; |
| εyS | = | yield strain of steel; |
| εri | = | strain of rebar layer i (i=1-4); |
| εsi | = | strain respect to part i of H-steel section; |
| fyR | = | yield strength of rebar, MPa; |
| fyS | = | yield strength of steel, MPa; |
| f’c | = | compressive strength of unconfined concrete, MPa; |
| f’cc | = | compressive strength of equivalent confined concrete, MPa; |
| fc1 | = | concrete compressive stress in term of concrete strain of unconfined area, MPa; |
| fc2 | = | concrete compressive stress in term of concrete strain of equivalent confined area, MPa; |
| h | = | depth of H-steel section, mm; |
| Kh | = | confinement factors for highly confined concrete; |
| Kp | = | Confinement factors for partially confined concrete; |
| Ke | = | confinement factors for equivalent confined concrete; |
| tf1 | = | top flange thickness of H-steel section, mm; |
| tf2 | = | bottom flange thickness of H-steel section, mm; |
| tw | = | web thickness of H-steel section, mm; |
| x1 | = | distance from the edge of the concrete equivalent confined areas to the top of the concrete section, mm; |
| w | = | width of H-steel section, mm; |
| αi | = | stress factors for the concrete areas i (i=1,2); |
| α’1 | = | Stress factors for the concrete areas inside; |
| = | uniaxial tensile stress, MPa; | |
| γ i | = | centroid factor for the concrete areas i (i=1,2); |
| γ’ 1 | = | centroid factor for the concrete areas inside; |
| = | eccentricity; | |
| fb0 | = | initial equibiaxial compressive yield stress of concrete, MPa; |
| fc0 | = | initial uniaxial compressive yield stress of concrete, MPa; |
| Kc | = | the ratio of the second stress invariant on the tensile meridian; |
| G(σ) | = | non-associated plastic flow potential, Druker-Prager formulation; |
| = | the plane in which plastic potential function is defined; | |
| = | dilation angle. |
Disclosure statement
No potential conflict of interest was reported by the authors.
Correction Statement
This article has been republished with minor changes. These changes do not impact the academic content of the article.
Additional information
Funding
Notes on contributors
Dinh Han Nguyen
Dinh Han Nguyen is currently enrolled as a Ph.D. candidate in the Department of Architectural Engineering at Kyung Hee University, Republic of Korea. His research interest includes precast composites structures.
Won-Kee Hong
Dr. Won-Kee Hong is a Professor of Architectural Engineering at Kyung Hee University. Dr. Hong received his Master’s and Ph.D. degrees from UCLA, and he worked for Englelkirk and Hart, Inc. (USA), Nihhon Sekkei (Japan) and Samsung Engineering and Construction Company (Korea) before joining Kyung Hee University (Korea). He also has a professional engineering license from both Korea and the USA. Dr. Hong has more than 30 years of professional experience in structural engineering. His research interests include a new approach to construction technologies based on value engineering with hybrid composite structures. He provided many useful solutions to issues in current structural design and construction technologies as a result of his research that combines structural engineering with construction technologies. He is the author of numerous papers and patents both in Korea and the USA. Currently, Dr. Hong is developing new connections that can be used with various types of frames including hybrid steel–concrete precast composite frames, precast frames and steel frames. These connections would contribute to the modular construction of heavy plant structures and buildings as well. He recently published a book titled as “ Hybrid Composite Precast Systems: Numerical Investigation to Construction” (Elsevier).
References
- Bayrak, O., and S. A. Sheikh. 2001. “Plastic Hinge Analysis.” Journal of Structural Engineering 127 (9): 1092–1100. doi:10.1061/(ASCE)0733-9445(2001)127:9(1092).
- Brettle, H. J. 1973. “Ultimate Strength Design of Composite Columns.” Journal of the Structural Division, ASCE 99: 1931–1951.
- Bridge, R. Q., and J. W. Roderick. 1978. “Behavior of Built-up Composite Columns.” Journal of the Structural Division, ASCE 104: 1141–1155.
- Chen, C. C., and N. J. Lin. 2006. “Analytical Model for Predicting Axial Capacity and Behavior of Concrete Encased Steel Composite Stub Columns.” Journal of Constructional Steel Research 62 (5): 424–433. doi:10.1016/j.jcsr.2005.04.021.
- Dassault Systèmes Simulia Corp. 2014. “ABAQUS Analysis User’s Manual 6.14-2.” Providence, RI.
- El-Tawil, S., and G. G. Deierlein. 1999. “Strength and Ductility of Concrete Encased Composite Columns.” Journal of Structural Engineering 125 (9): 1009–1019. doi:10.1061/(ASCE)0733-9445(1999)125:9(1009).
- Furlong, R. W. 1974. “Concrete Encased Steel Columns-design Tables.” Journal of the Structural Division, ASCE 100: 1865–1882.
- Hong, W. K. 2019. Hybrid Composite Precast Systems: Numerical Investigation to Construction. Woodhead Publishing, Elsevier.
- Hong, W. K., Y. Lee, S. Kim, S. I. Kim, and Y. J. Yun. 2015. “Analytical Investigation of Hybrid Composite Precast Beams with Modified Strain Compatibility for Entire History of Nominal Flexural Capacity.” The Structural Design of Tall and Special Buildings 24 (13): 835–852. doi:10.1002/tal.1214.
- Hu, J. Y., W. K. Hong, and S. C. Park. 2017. “Experimental Investigation of Precast Concrete Based Dry Mechanical Column–column Joints for Precast Concrete Frames.” The Structural Design of Tall and Special Buildings 26 (5): e1337. doi:10.1002/tal.1337.
- Jiang, H., Y. Li, and J. Zhu. 2017. “Numerical Simulation of Mega Steel Reinforced Concrete Columns with Different Steel Sections.” The Structural Design of Tall and Special Buildings 26 (1): e1304. doi:10.1002/tal.1304.
- Lai, B., J. R. Liew, and A. Le Hoang. 2019. “Behavior of High Strength Concrete Encased Steel Composite Stub Columns with C130 Concrete and S690 Steel.” Engineering Structures 200: 109743. doi:10.1016/j.engstruct.2019.109743.
- Lai, B., J. R. Liew, and T. Wang. 2019. “Buckling Behaviour of High Strength Concrete Encased Steel Composite Columns.” Journal of Constructional Steel Research 154: 27–42. doi:10.1016/j.jcsr.2018.11.023.
- Lai, B., J. R. Liew, and M. Xiong. 2019. “Experimental Study on High Strength Concrete Encased Steel Composite Short Columns.” Construction and Building Materials 228: 116640. doi:10.1016/j.conbuildmat.2019.08.021.
- Lu, X., X. Lu, H. Guan, W. Zhang, and L. Ye. 2013. “Earthquake-induced Collapse Simulation of a Super-tall Mega-braced Frame-core Tube Building.” Journal of Constructional Steel Research 82: 59–71. doi:10.1016/j.jcsr.2012.12.004.
- Lu, X., X. Yin, and H. Jiang. 2014. “Experimental Study on Hysteretic Properties of SRC Columns with High Steel Ratio.” Steel and Composite Structures 17 (3): 287–303. doi:10.12989/scs.2014.17.3.287.
- Malm, R. 2006. “Shear Cracks in Concrete Structures Subjected to In-plane Stresses.” PhD diss., KTH Royal Institute of Technology
- Mander, J. B., M. J. N. Priestley, and R. Park. 1988. “Theoretical Stress–strain Model for Confined Concrete.” Journal of Structural Engineering 114 (8): 1804–1826. doi:10.1061/(ASCE)0733-9445(1988)114:8(1804).
- Mirza, S. A., V. Hyttinen, and E. Hyttinen. 1996. “Physical Tests and Analyses of Composite Steel–concrete Beam–columns.” Journal of Structural Engineering 122 (11): 1317–1326. doi:10.1061/(ASCE)0733-9445(1996)122:11(1317).
- Mirza, S. A., and B. W. Skrabek. 1992. “Statistical Analysis of Slender Composite Beam–column Strength.” Journal of Structural Engineering 118 (5): 1312–1332. doi:10.1061/(ASCE)0733-9445(1992)118:5(1312).
- Nzabonimpa, J. D. 2018. “Development of Lego-type Column-to-column Connections.” PhD diss., Kyung Hee University.
- Sheikh, S. A., and S. M. Uzumeri. 1982. “Analytical Model for Concrete Confinement in Tied Columns.” Journal of the Structural Division, ASCE 108: 2703–2722.
- Zhang, S. A., Z. Z. Zhao, and X. G. He. 2012. “Flexural Behavior of SRC Columns under Axial and Bilateral Loading.” Applied Mechanics and Materials 166: 3383–3390. Trans Tech Publications Ltd. doi:10.4028/www.scientific.net/AMM.166-169.3383.
- Zhang, W. K., X. Lu, X. Z. Lu, L. P. Ye, and J. R. Qian. 2012. “Collapse Simulation for a Super-Tall Mega-braced Frame Core-tube Building.” In 15thWorld Conference on Earthquake Engineering, Lisboa, Portugal.
- Zhu, W. Q., G. Meng, and J. Q. Jia. 2014. “Experimental Studies on Axial Load Performance of High-strength Concrete Short Columns.” Proceedings of the Institution of Civil Engineers-Structures and Buildings 167 (9): 509–519. doi:10.1680/stbu.13.00027.
Appendix
Figure A1. Geometric configuration of the steel column encased in the structural concrete
EquationEquations (A2)(A2)
(A2) –Equation(A4)
(A4)
(A4) and Equation(A5)
(A5)
(A5) –Equation(A7)
(A7)
(A7) were provided to evaluate the mean stress factors (α) and centroid factors (γ) for the two zones, respectively. These equations are based on the Mander confining curve.
The mean stress factors (α) for the two zones are obtained by;
The centroid factors are given as;