
ABSTRACT
The purpose of this study is to examine the relationship between urban built environment factors and the travel behaviours of visually impaired people. Using mobile phone data containing information on the movements of people with visual impairment, the association between their traffic volume and the built environment factors of land uses, public transit, and pedestrian facilities for visually impaired people were analysed. The results indicated that some of the urban built environment factors were significantly associated with the travel of people with visual impairments. The model results showed that the associations between their traffic volume and the factors of pedestrian infrastructure for visually impaired people were much higher than the association with all other factors considered in the analysis. Commercial, civic, and cultural uses were also significantly related to their traffic volume. Proximity to the subway was positively associated with an increase in the traffic volume of people with visual impairments. The current study contributes to the ongoing discussion on the mobility of people with disabilities by taking afirst step towards constructing amethod whereby mobile phone data can be utilised to examine the relationship between the built environment and the travel patterns of visually impaired people.
1. Introduction
Designing built environments that support people’s mobility has been one of the major interests of urban studies (Saelens and Handy Citation2008; Sung, Go, and Choi Citation2013). An important finding in the large body of transportation research is that built environment factors, including the land use mix, proximity to transit, street connectivity, and accessibility, are significant factors affecting people’s mobility (Cervero and Kockelman Citation1997; Hajrasouliha and Yin Citation2015; Saelens and Handy Citation2008; Taylor and Józefowicz Citation2012; Troped et al. Citation2003).
Despite recent achievements on mobility and disability (Botticello, Rohrbach, and Cobbold Citation2014; Bromley, Matthews, and Thomas Citation2007; Clarke et al. Citation2008), little attention has been paid to the travelling behaviours of individuals with visual impairments (Frazila and Zukhruf Citation2018). Many visually impaired people have mobility concerns and face difficulties with independent travel, which results in a lack of social communication and exclusion (Baris and Uslu Citation2009; Wong Citation2018). For this reason, previous studies on blindness and travel focused on identifying physical barriers that restrict the movements of visually impaired people and lead to immobility (Baris and Uslu Citation2009; Loomis, Klatzky, and Golledge Citation2001; Marston and Golledge Citation2003; Marston, Golledge, and Costanzo Citation1997). Although these studies highlight the ways in which urban built environments present different levels of difficulty and impose restrictions on visually impaired people, they predominantly depend on the use of surveys, interviews, and observations for data collection (Weerasinghe and Dissanayake Citation2017), which either reflect the travel behaviours of visually impaired people indirectly (surveys and interviews) or they are limited by the number of participants (interviews and observations) (Diao et al. Citation2015).
Compared with traditional travel survey data, mobile phone data have unique capabilities to allow for quantitative analyses of an unprecedentedly large population and geographic area (Wang, He, and Leung Citation2018). Mobile phone data record the movements of larger populations for an extended period at little cost and also automatically capture the objectively measured spatial travel patterns of a large population in a city (Chen et al. Citation2016; Wang, He, and Leung Citation2018). Because of these advantages, in recent years mobile phone data have been widely applied to investigate individual mobility patterns within urban settings (Calabrese et al. Citation2013; Toole et al. Citation2015). This type of big data resource, however, has not been utilised for research on the urban travel indicators of people with visual impairment.
Using mobile phone data generated from phones owned by visually impaired people, this study aims to explore whether the environmental factors associated with travel, such as mixed land use, accessibility to transit, and pedestrian infrastructure, are effective in promoting their mobility. Considering that the public sector’s capability to improve infrastructure for the mobility of this segment of people is limited, understanding the specific characteristics of their travel behaviours and how built environment factors influence their mobility patterns can provide valuable insights into finding ways that can encourage their movements outside of their homes. By combining mobile phone data with GIS data for spatial statistical analysis, this study seeks to take a first step towards building a quantitative methodology whereby mobile phone data can be effectively used for the analysis of the effect of built environment factors on the travel of people with visual impairments.
1.1. Mobility of people with visual impairment in the urban environment
Studies examining the relationship between built environments and the mobility of the disabled suggest that various physical factors play a significant role in reducing the independent travel of these people. For example, Clarke et al. (Citation2008) examined the effect of block-level built environment characteristics on mobility disability using face-to-face interview data. The results indicated that the street and sidewalk conditions significantly influenced the walking trips of those with severe impairments of neuromuscular and movement-related functions. Matthews and Vujakovic (Citation1995) and Boodlal (Citation2003) reported that a lack of dropped kerbs, uneven or rough surfaces, narrow or congested paths, and steep gradients are the most immediate types of barrier for wheelchair users. Similarly, a lack of kerb cuts (i.e. depressed kerbs that act as ramps in sidewalks), barrier-free sidewalks, pedestrian amenities (e.g. benches, shade trees), and four-way cross signals were considered as environmental barriers that prevent independent travel by disabled pedestrians (Beard et al. Citation2009; Bowling and Stafford Citation2007).
Compared to the large body of research on mobility and disability (Imrie Citation1996; MOLIT, Citation2017; Montarzino et al. Citation2007; Oliver Citation1996; Smith Citation2009), studies specifically focusing on the effect of the urban built environment on travellers with visual impairments are scarce (Montarzino et al. Citation2007). Montarzino et al. (Citation2007) investigated the relationship between the environmental and transportation factors that affect visually impaired people’s walking behaviour. Their findings indicated that the degree of mobility among people with vision loss was significantly influenced by certain aspects of the built environment, such as controlled road crossings and the location of bus stops. As part of a detailed investigation into the obstacles faced by blind pedestrians during road crossing, Barlow, Bentzen, and Bond (Citation2005) tested their crossing behaviours at complex signalised intersections and found that the participants had great difficulties in detecting crosswalks, aligning to cross, and determining when to cross. Hersh (Citation2014) also pointed out that road crossings present a barrier to independent travel for visually impaired people and can cause considerable stress and anxiety.
Research on the mobility of visually impaired people has revealed how people with visual impairments rely on their remaining senses to gain spatial knowledge while walking in an urban environment. The use of sounds has been considered one of the most significant cues for wayfinding (Emerson et al. Citation2011). Pedestrian crossing signals with audio output, in particular, have been found to be a reliable and useful resource for this group of people (Hersh Citation2014; Koutsoklenis and Papadopoulos Citation2011). According to Koutsoklenis and Papadopoulos (Citation2011), traffic controls with accessible pedestrian signals were viewed as significant for way-finding among blind pedestrians, as they used the sound coming from the traffic controls not just to locate the traffic light or to cross the street but also to orient themselves to their location in the city. Auditory information provided on public transits such as buses and subways is also crucial for blind passengers (Marston and Golledge Citation1997).
Tactile guidance paths with surface differentiation are another useful source of spatial information for blind pedestrians (Kim, Lee, and Kim Citation2009; Norgate Citation2012). Tactile paving has been suggested as a significant physical attribute for constructing a walkable street for people with visual impairments (Frazila and Zukhruf Citation2018). Considering that surface tactility provides rich environmental information for those with vision loss, it is suggested the value of tactile paving needs to be emphasised in new urban development so that visually impaired individuals are not spatially marginalised (Wong Citation2018).
Accessibility to public transit is another built environment factor that can promote or hinder the outdoor mobility of visually impaired pedestrians (Glass and Balfour Citation2003; Marston, Golledge, and Costanzo Citation1997). Duckett and Pratt (Citation2010) emphasised that improving access to public spaces by providing adequate transport for visually impaired people can greatly affect their active mobility in urban environments. Compared to buses, however, there is a paucity of research investigating the use of other transport modes (e.g. trains and subways), with only a few exceptions (Kim, Lee, and Kim Citation2009; Montarzino et al. Citation2007).
Researchers have also considered land use mix as another important factor affecting the travel behaviour of people with disabilities (Botticello, Rohrbach, and Cobbold Citation2014; Crudden, McDonnall, and Hierholzer Citation2015). Crudden, McDonnall, and Hierholzer (Citation2015) noted that visually impaired people’s decisions to travel to a certain destination are more likely to be affected by the level of land use mix in the neighbourhood, especially when the travel is non-obligatory (e.g., not for commuting). In addition, it has been reported that shopping malls and retail destinations located near the homes of people with limited mobility may promote their outdoor activities (Eisenberg, Vanderbom, and Vasudevan Citation2017).
1.2. Mobility research and mobile phone data
In terms of data collection, research on the mobility of disabled people has relied heavily on the use of surveys, interviews, and observations. This has also been the case for investigations of human walking behaviours in built environments (Weerasinghe and Dissanayake Citation2017). With the advent of new technologies such as GPS, Wi-Fi, and accelerometers and magnetometers, various sources of “big data” that capture the dynamic movements of people are receiving much attention for their objective measurement of human mobility (Rundle et al. Citation2016; Toole et al. Citation2015). Mobile phone data, in particular, has recently gained the interest of researchers investigating human travel behaviours. Unlike the conventional ways of collecting data (survey questionnaires, interviews, trip diaries, etc.), which are not only costly but also limited in terms of sample size (Diao et al. Citation2015), mobile phone data can record the movements of larger populations for an extended period at little cost (Chen et al. Citation2016). Another advantage of collecting data through mobile sensors is that it puts little burden on the participants because the data is generated while they simply carry a mobile phone (Wang and Chen Citation2018). More importantly, it automatically collects extensive data on actual travel movements, which can provide new insights into the interactions between travel behaviour and various built environment attributes in a way that may not have been possible using participants’ self-reported data.
As noted by Wang, He, and Leung (Citation2018), mobile phone data can help to identify the travel behaviours of some “hard-to-reach groups” (p. 150). Most previous studies on visually impaired people relied on recruiting participants through visual impairment organisations (Kim, Lee, and Kim Citation2009; Koutsoklenis and Papadopoulos Citation2011; Montarzino et al. Citation2007). The use of mobile phone data enables the inclusion of people not enlisted in these organisations and those in younger generations, who are less likely than older people to participate in research that uses traditional recruitment methods. Considering that visually impaired people are often reluctant to discuss mobility issues related to their disability (Duckett and Pratt Citation2010), the passively generated nature of mobile phone data, which puts little or no burden on the participants, may provide more accurate evidence on their reactions to various built environment factors and the resulting choices on their routes.
A recent report on the use of smartphones by people with visual impairments in Korea showed that 74.2% of them use smartphones, and those without a smartphone use other types of mobile phone such as flip phones (Seo Citation2018). Since most visually impaired people in Korea are customers of mobile telecom operators, the data collected through their phones by these companies are expected to represent the travel behaviours of visually impaired people better than previous studies that relied on more traditional methods of data collection.
The purpose of this study, therefore, is to identify built environment factors that affect the travel behaviours of visually impaired people in Seoul, South Korea, by using mobile phone data collected by SK Telecom, the largest wireless telecommunications operator in South Korea. These data contained information on the movement of visually impaired people within the city boundary of Seoul. To investigate the association of the mobility of visually impaired people with the built environment, various measures of the built environment were constructed using GIS data on land use, public transit, and pedestrian facilities for this group of people. The analysis focuses on examining the effects of urban land use patterns, transit accessibility, and inclusive street design elements for visually impaired people on their travel patterns.
2. Research design
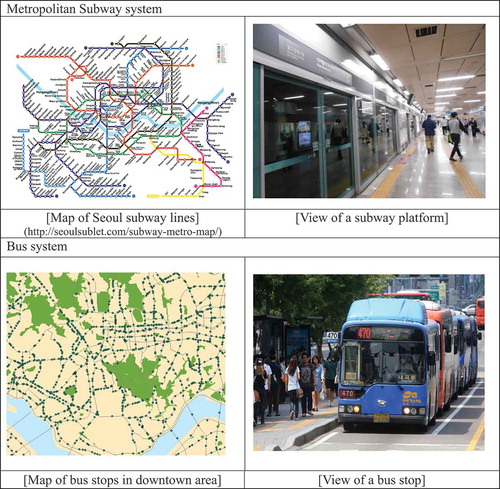
The study area for this research was Seoul, the capital and largest city of South Korea. Its population was approximately 10 million in 2017, including 250,000 people with visual impairments. The statistics of building capacity in Seoul indicate that approximately 54% of the total building area is used for residential use, followed by commercial (13%) and office use (10%) (see ). The city is considered to be the most accessible and convenient place to travel in Korea, with well-connected transit networks of subways and buses (). We chose Seoul as the study area for the research because it has the most up-to-date and precise built environment data on the pedestrian infrastructure for visually impaired people, which were gathered through an extensive field investigation conducted by the city government in 2017.
Table 1. The summary statistics of the building area by land use type in Seoul
Figure 1. Transit systems of Seoul
A statistical analysis of the relationship between urban built environment factors and the travel behaviour of people with visual impairments was conducted using 1) traffic volume data on visually impaired people that were derived from their mobile phone data and 2) GIS data on land use, transit facilities, and the pedestrian infrastructure for visually impaired people in an urban built environment.
2.1. Data
The traffic volume data generated from the mobile phones of visually impaired people, showing the total number of travellers in specific locations at a given period, were used to examine their travel behaviour. The data were produced by SK Telecom, the largest wireless telecommunications operator in South Korea, with the intention of analysing the movement patterns of mobile phone users. SK Telecom provides specialised customer services for people with visual impairments, one of which is a mobile phone plan called SoriSarang. Those who join this plan are diagnosed as legally blind. Legal blindness in Korea categorises people with visual impairments into six groups based on their level of vision loss, ranging from total blindness (category 1) to low vision in only one eye (category 6). The participants in this study were people subscribing to this plan; thus, the mobility data covered those with complete blindness to those suffering from partial loss of sight.
With permission to use the data from SK Telecom, we analysed the traffic volume data generated by people with visual impairments between 1/9/2015 and 31/9/2015 (for a month). One of the main advantages of mobile phone data on human mobility is its longitudinal nature (Wang and Chen Citation2018). Tracking the movements of this particular group of people for a relatively long period within a large city was made possible through the cellular networks built by SK Telecom in and around the area. These cellular networks help mobile phone users enjoy mobile communication services that the telecom company offers by keeping a connection with the subscriber’s phone and the network (Wang, He, and Leung Citation2018). In this process, the location of the subscriber is recorded regularly through a triangulation positioning technique; that is, the phone’s location is derived from the triangulation of the locations of cell phone towers surrounding the phone (Chen et al. Citation2016). The network-driven traffic volume data were in a raster GIS format with a cell size of 50 m by 50 m. The allocated number for each grid cell of the raster data represented the total number of people with visual impairments travelling in the cell area at the given period.
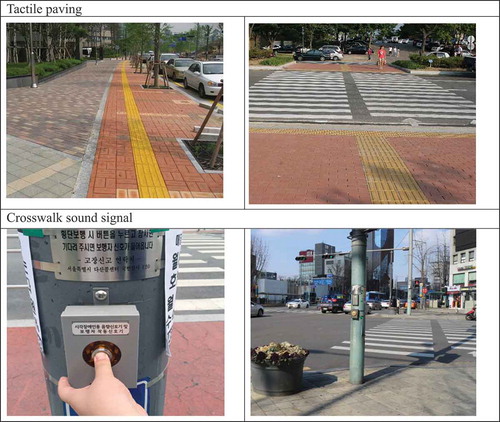
The GIS datasets used to measure the characteristics of the urban built environment came from various sources. The parcel GIS data for measuring the development density (floor area ratio) of specific land use types were obtained from the national building data archive (open.eais.go.kr) in July 2017. The GIS data on transit facilities and the road network containing information on the physical features of individual road segments such as width, length, and the total number of vehicle lanes were obtained from the national public data archive (www.data.go.kr). The data on the pedestrian facilities were obtained from a field investigation on pedestrian infrastructure conducted by the city of Seoul in 2017. The data provided information on the sidewalk elements associated with visually impaired people’s travels, such as tactile paving (e.g., tactile cues for directional guidance and tactile warnings on crosswalks), crosswalk sound signals (i.e., accessible pedestrian signals at crossings telling pedestrians when it is safe to cross, ), and physical barriers such as bumpy pavements and stairs.
Figure 2. Pedestrian infrastructure for visually impaired people in Seoul
2.2. Statistical modelling of the relationship between the urban built environment and travel by people with visual impairments
Ordinary least squares (OLS) regression is, probably, the most extensively used statistical model in travel research, but it has the risk of producing biased results when the data are spatially correlated (Anselin and Bera Citation1998). The spatial dependency test (Moran’s I test) for the dependent variable – the traffic volume of people with visual impairments – indicated that the data were spatially correlated (Moran’s I: 0.98); thus, OLS regression seemed to be inappropriate. In such a case, applying spatial models is recommended in order to control the spatial dependency in the data (Anselin Citation1988).
This study used a spatial regression model (spatial lag model) in which the traffic volume of visually impaired people in the neighbourhood was regressed on the built environment factors describing the neighbourhood’s land use, transit, and walkway characteristics. In order to control the spatial dependency of the traffic volume data, the model included an autoregressive term of the form pWy, where p was a spatial autoregressive parameter, W was an n x n matrix of spatial weights, and y was n x 1 vectors of observations on the dependent variable (Smirnov and Anselin Citation2001). For the weight matrix, the minimum distance assuring each location has at least one neighbour was applied to produce the spatial lag variable. The spatial regression model was estimated using GeoDa software (Anselin, Syabri, and Kho Citation2006).
2.3. Measurement of the variables
An operational definition of a neighbourhood as a 400 m-radius airline buffer was used as the spatial unit of analysis in order to measure the traffic volume of people with visual impairments in a neighbourhood (dependent variable) and the measures of the neighbourhood’s built environment factors (independent variables). The 400 m buffer area was chosen because it is more effective in capturing people’s perceptions of a neighbourhood based on walking and transit uses than the conventional concept of a neighbourhood based on administrative spatial units such as census tracts, census blocks, and police precincts (Coulton, Jennings, and Chan Citation2013; Sohn, Moudon, and Lee Citation2012).
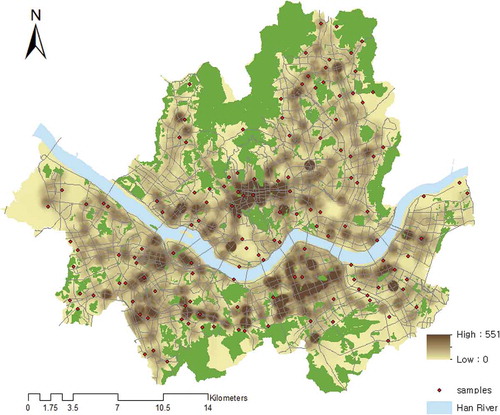
The dependent variable – the traffic volume (number of travellers) in the neighbourhood (400 m airline buffer) – was estimated using GIS raster data analysis techniques. As shown in , the highest traffic volume in the neighbourhood was 551, and the lowest was 0. After the estimation of the traffic volume of visually impaired people in the neighbourhood, 133 neighbourhood samples were randomly selected to be used in the analysis. Each sample was at least 400 m away from the others in order to reduce the data redundancy from the overlapping of the neighbourhoods’ boundaries.
Figure 3. Map of the sample points and the traffic volume of visually impaired people in a neighborhood
The measures of the built environment were developed on the basis of the findings in the travel behaviour literature, which indicates that travel behaviours are significantly associated with built environment factors such as land use mix, proximity to transit, and accessibility to amenities (Cervero and Kockelman Citation1997; Kim, Sohn, and Choo Citation2017; Marston, Golledge, and Costanzo Citation1997; Saelens, Sallis, and Frank Citation2003; Schmöcker et al. Citation2012). Land use mix is one of the main built environment factors affecting the travel demand of all modes, including vehicles, transit, and walking (Cervero and Kockelman Citation1997). The literature suggests that land use diversity can act as a promoter of mobility among people with disabilities (Botticello, Rohrbach, and Cobbold Citation2014). Accessibility to public transit is also important for visually impaired people because their independent travel for participation in employment, education, social, and cultural opportunities mainly depends on the available public transit systems (Jonnalagedda et al. Citation2014). In addition, the characteristics of walkways are also critical to improving the urban mobility of visually impaired people (Norgate Citation2012; World Health Organization, Citation2007). The key components of walkways for people with visual impairments include sidewalk width (Frazila and Zukhruf Citation2018; Kirchner, Gerber, and Smith Citation2008), tactile paving (Gual, Puyuelo, and Lloveras Citation2011), and crossing facilities such as sound signals (Emerson et al. Citation2011; Marston and Golledge Citation2000).
Using the GIS data on parcels, transit facilities, and pedestrian infrastructure, 13 measures of urban built environments were developed. All built environment measures were estimated at the neighbourhood level (400 m airline buffer). First, the building area ratios of five non-residential land use types (commercial, office, civic, cultural, and religious) to the residential use in a neighbourhood were estimated to examine the effects of land use mix on the travel of visually impaired people using the building area information from parcel GIS data. The five types of non-residential use were identified using the building land use description codes provided in the parcel GIS data. Second, the Euclidean distance between the closest bus stop and subway station were estimated to examine the effects of proximity to transit on the travel of visually impaired people. Third, the measures of walkway characteristics in a neighbourhood such as the proportion of road segments with sidewalks, the average width of sidewalks, the proportion of road segments with tactile paving, and the percentage of road segments with a sound signal in the crosswalk in a neighbourhood were estimated using the field investigation data. presents the descriptive statistics of the dependent and all independent variables used in the model.
Table 2. The descriptive statistics of the dependent and independent variables
3. Model results
A spatial lag model was estimated to control the spatial autocorrelation in the dependent variable. The statistics of the model fit for the spatial lag model with the reference values for the OLS regression model indicated an improvement in model fit for the spatial lag specification (): log likelihood increased from −35971 (for OLS) to −31565 (for spatial lag); the AIC value decreased from 71972 (for OLS) to 63162 (for spatial lag); and the Schwarz criterion value decreased from 72069 (for OLS) to 63265 (for spatial lag). The results of Moran’s I test confirmed that the spatial dependency of the residuals significantly decreased from 0.98 (for OLS) to 0.01 (for spatial lag).
Table 3. Statistics of the model fits
summarises the results of the spatial lag model. Among the five land use mix variables, three – the ratio of commercial, civic, and cultural to residential use – were statistically significant. The increases in the ratio of commercial, civic, and cultural uses to residential use in the neighbourhood increased the traffic volume, suggesting that these three uses increase the traffic of visually impaired people. The effects of office use (the ratio of office to residential use) and religious use (the ratio of religious use to residential use) on the traffic volume were not statistically significant.
Table 4. Model results for the traffic volume of visually impaired people
The results for the two proximity to transit measures (the distance to the closest bus stop and the distance to the closest subway station) indicated that the traffic increased as the distance to the closest subway station decreased, suggesting that traffic volume was higher in areas with higher proximity to a subway station. The significance of the effect of the proximity to a bus stop (the distance to the closest bus stop) was not proven by the statistics.
Several walkway-related variables were also significantly associated with the traffic volume of people with visual impairments. The results indicated that neighbourhoods with more road segments with sidewalks, tactile paving, and crosswalks with a sound signal were likely to have a higher traffic volume of visually impaired people. Their traffic decreased with the increase in the level of street obstacles on the streets. The effect of the average slope of walkways in the neighbourhood was not statistically significant.
4. Discussion & conclusion
The purpose of this study was to investigate the travel behaviour of people with visual impairments to identify built environment factors that affect their mobility using data obtained from their mobile phones. The analysis focused on examining the effects of urban land use patterns, transit facilities, and inclusive street design elements for visually impaired people on their travel patterns. The findings indicated that some of the urban built environment factors were significantly associated with the travel behaviours of people with visual impairments.
Among the five non-residential land use types, commercial, civic, and cultural uses were found to be significantly related to their traffic volume. The results suggested that the traffic volume of people with visual impairments in neighbourhoods was likely to increase when the neighbourhood had a higher building area ratio of these land uses to residential uses. To date, few studies have examined the association of land use with the travel behaviours of visually impaired people. Theoretically, however, the accessibility of services and necessities of daily life, such as government offices for people with disabilities, medical care, and grocery stores, are considered as one of the important factors in making a community liveable for visually impaired people (Gerber and Kirchner, Citation2003). Land use mix is supportive of non-motorized travel because an area with land use diversity generally offers more non-residential destinations for walking journeys, and thus may facilitate more transport-related physical activity by residents (Duncan et al. Citation2010). The results of this study provides empirical evidence indicating that a neighbourhood with better access to services and destinations for daily living offers a significant built environment factor that can play a positive role in promoting mobility among people with visual impairments.
With respect to the effect of transit on the travel of visually impaired people, the results indicated that proximity to subways was positively associated with an increase in their traffic volume, whereas the effect of the proximity to bus stations was not statistically significant. These findings are different from the reports in previous studies carried out in western countries, which showed that bus transits were more favoured than rail transits by the visually impaired for better accessibility, diversity of travel route, and convenience of boarding (Golledge, Costanzo, and Marston Citation1995; Jolly, Priestley, and Matthews Citation2006; Marston, Golledge, and Costanzo Citation1997). Subway transits in Seoul are relatively well equipped with facilities and support for visually impaired people (Kim, Lee, and Kim Citation2009). For example, each subway station provides easy vertical access to the platform through elevators and escalators. The “subway helper service for the handicapped” initiated by the city of Seoul may also have contributed to the high preference for subways among visually impaired people (Choi and Jung Citation2014). On the other hand, reasons for their infrequent use of buses may include the simultaneous arrival of multiple buses at a bus stop, which is very common in Seoul (Lee, Park, and Ye Citation2018). In addition, it can be difficult for visually impaired people to locate the bus they are looking for as buses usually load/unload passengers while standing in a long line (Kim et al. Citation2016). Considering these factors, in the local context of Seoul, subway transits may support the mobility of the visually impaired more effectively than bus transits.
Pedestrian infrastructure for visually impaired people was found to be the most critical factor affecting the travel of visually impaired people. The results of the spatial lag model indicated that the associations of their traffic volume with the factors of pedestrian infrastructure for visually impaired people were much higher than the associations with all other factors considered in the analysis. In the comparison of the coefficients for the independent variables, the level of street obstacles showed the highest coefficient value (649.95), followed by the percentage of road segments with tactile paving (413.82), the percentage of road segments with sidewalks (222.72), and the percentage of crosswalks with a sound signal (110.86), while those for land use mix and proximity to transit variables were lower than 1. These results confirmed the importance of improving pedestrian infrastructure for the mobility of visually impaired people, which has been emphasised in previous studies (Emerson et al. Citation2011; Frazila and Zukhruf Citation2018; Koutsoklenis and Papadopoulos Citation2011).
The contributions of this study to the disability literature are three-fold. First, it introduces a new method for investigating the travel patterns of disabled people by utilising information provided by mobile phone sensors. The use of mobile phone data made it possible to analyse the actual movements of visually impaired people, which is difficult when data are collected through participants’ self-reports using surveys and interviews. In addition, the data used in this study were reliable in terms of their spatial accuracy, and they were cost-effective and time-saving. The vast amount of data collected automatically over a relatively long period allowed for a systematic analysis of the travel behaviours of a large number of people, which was not possible in most previous studies that relied on qualitative analyses of the relationship between the built environment and the travel behaviours of visually impaired people. The availability of similar data collected in other cities may stimulate comparative studies examining the interconnection between the built environment and mobility.
Second, the findings of this study present ways to improve neighbourhood environments to enable visually impaired people to become more physically active. Increasing accessibility to destinations that they visit for employment or services (e.g. shopping, clinics, or community centres) is a significant built environment factor affecting the travel behaviours of this group. Increasing commercial, civic, and cultural land use around a limited area may be vital in supporting the non-commuting travel of visually impaired people. Since the lack of transportation may limit their travel to these destinations (Crudden, McDonnall, and Hierholzer Citation2015), housing policies that help visually impaired residents to reside in neighbourhoods with a diversity of land use that can be reached on foot could also be effective in improving their mobility.
Third, it is noteworthy that the accessibility of subways plays an important role in promoting mobility among visually impaired people. The accessibility of public transit is a major factor in their independent mobility because of their inability to drive (Montarzino et al. Citation2007). Improving accessibility to subways, in particular, can contribute to increasing the movement of visually impaired people to a great extent. Given the limited capability of the public sector to invest in infrastructure for visually impaired people, it is suggested that prioritising the improvement of the pedestrian networks around subway stations might be an effective way to support the mobility of this segment of people.
This study is limited in three respects. First, the data may be limited in the representation of the travel behaviour of visually impaired people because of the different market penetration of the various telecom companies. Although SK Telecom is the largest wireless communications operator in Korea, data obtained from other companies may have demonstrated different spatial patterns of travel by people with visual impairments in the study area. Second, the results of this study might not be relevant to the mobility of visually impaired people living in other cities or countries. The findings may not be particularly transferable to individuals living in urban areas with a lower development density and more convenient accessibility to bus transits than Seoul. Finally, this study is limited in examining the causal relationship between the traffic volume of visually impaired people and urban environmental factors due to the nature of the statistical model. Further research comparing the effects of urban physical factors on the travel behaviors of physically abled people with those of the visually impaired would be helpful in further developing urban design strategies that can support the mobility of people with visual impairments.
Disclosure statement
No potential conflict of interest was reported by the authors.
Additional information
Funding
Notes on contributors
Hyungkyoo Kim
Hyungkyoo Kim is an Assistant Professor in the Department of Urban Design and Planning at Hongik University and the directing faculty of the Environmental City Research Group. His research focuses on climate-responsive urban design and planning, microclimate and thermal comfort, urban heat island, walkability and livability, and suburbanization. He holds a doctoral degree in City and Regional Planning from the University of California, Berkeley.
Dongwook Sohn
Dongwook Sohn is an Associate Professor in the Department of Architecture & Architectural Engineering at Yonsei University. His research focuses on urban morphology, incorporating GIS technologies into human behavior research. Current work includes collaboration with the City of Seoul to develop Universal Design strategies for the city, research on the relationship between built environment and crime, and urban design experiments using building energy consumption data. He has done research, teaching, and professional development in South Korea and the US.
References
- Anselin, L. 1988. Spatial Econometrics: Methods and Models. Dordrecht: Kluwer Academic.
- Anselin, L., and A. Bera. 1998. “Spatial Dependence in Linear Regression Models with an Introduction to Spatial Econometrics.” In Handbook of Applied Economic Statistics, edited by A. Ullah and D. E. A. Giles, 237–289. New York: Marcel Dekker.
- Anselin, L., I. Syabri, and Y. Kho. 2006. “Geoda: An Introduction to Spatial Data Analysis.” Geographical Analysis 38: 5–22. doi:10.1111/j.0016-7363.2005.00671.x.
- Baris, M., and A. Uslu. 2009. “Accessibility for the Disabled People to the Built Environment in Ankara, Turkey.” African Journal of Agricultural Research 4: 801–814.
- Barlow, J., B. Bentzen, and T. Bond. 2005. “Blind Pedestrians and the Changing Technology and Geometry of Signalized Intersections: Safety, Orientation, and Independence.” Journal of Visual Impairment & Blindness 99: 1–13. doi:10.1177/0145482X0509901003.
- Beard, J., S. Blaney, M. Cerda, V. Frye, G. Lovasi, D. Ompad, A. Rundle, and D. Vlahov. 2009. “Neighborhood Characteristics and Diability in Older Adults.” The Journals of Gerontology 64B: 252–257. doi:10.1093/geronb/gbn018.
- Boodlal, L. 2003. Accessible Sidewalks and Streets Crossings- an Informational Guide. Washington, DC: US Department of Transportation, Federal Highway Administration.
- Botticello, A. L., T. Rohrbach, and N. Cobbold. 2014. “Disability and the Built Environment: An Investigation of Community and Neighborhood Land Uses and Participation for Physically Impaired Adults.” Annals of Epidemiology 24: 545–550. doi:10.1016/j.annepidem.2014.05.003.
- Bowling, A., and M. Stafford. 2007. “How Do Objective and Subjective Assessments of Neighbourhood Influence Social and Physical Functioning in Older Age? Findings from a British Survey of Ageing.” Social Science & Medicine 64: 2533–2549. doi:10.1016/j.socscimed.2007.03.009.
- Bromley, R., D. Matthews, and C. Thomas. 2007. “City Centre Accessibility for Wheelchair Users: The Consumer Perspective and the Planning Implications.” Cities 24: 229–241. doi:10.1016/j.cities.2007.01.009.
- Calabrese, F., M. Diao, G. Lorenzo, J. Ferreira Jr, and C. Ratti. 2013. “Understanding Individual Mobility Patterns from Urban Sensing Data: A Mobile Phone Trace Example.” Transportation Research, Part C 26: 3101–3313. doi:10.1016/j.trc.2012.09.009.
- Cervero, R., and K. Kockelman. 1997. “Travel Demand and the 3Ds: Density, Diversity and Design.” Transportation Research, Part D 2: 199–219. doi:10.1016/S1361-9209(97)00009-6.
- Chen, C., J. Ma, Y. Susilo, Y. Liu, and M. Wang. 2016. “The Promises of Big Data and Small Data for Travel Behavior (Aka Human Mobility) Analysis.” Transportation Research Part C 68: 285–299. doi:10.1016/j.trc.2016.04.005.
- Choi, S., and Y. Jung. 2014. “A Study on the Anlaysis and Improvement of Subway from the Perspective of Universal Design.” In AIK Fall conference. Vol. 34, 151–152. Seoul, South Korea.
- Clarke, P., J. Ailshire, M. Bader, J. Morenoff, and J. House. 2008. “Mobility Disability and the Urban Built Environment.” American Journal of Epidemiology 168 (5): 506–513. doi:10.1093/aje/kwn185.
- Coulton, C. J., M. Z. Jennings, and T. Chan. 2013. “How Big Is My Neighborhood? Individual and Contextual Effects on Perceptions of Neighborhood Scale.” American Journal of Community Psychology 51: 140–150. doi:10.1007/s10464-012-9550-6.
- Crudden, A., M. McDonnall, and A. Hierholzer. 2015. “Transportation: An Electronic Survey of Persons Who are Blind or Have Low Vision.” Journal of Visual Impairment & Blindness 109: 445–456. doi:10.1177/0145482X1510900603.
- Diao, M., Y. Zhu, J. Ferreira, and C. Ratti. 2015. “Inferring Individual Daily Activities from Mobile Phone Traces: A Boston Example.” Environment and Planning B: Planning and Design 43: 920–940. doi:10.1177/0265813515600896.
- Duckett, P., and R. Pratt. 2010. “The Researched Opinions on Research: Visually Impaired People and Visual Impairment Research.” Disability & Society 16: 815–835. doi:10.1080/09687590120083976.
- Duncan, M. J., E. Winkler, T. Sugiyama, E. Cerin, L. duToit, E. Leslie, and N. Owen. 2010. “Relationships of Land Use Mix with Walking for Transportation: Do Land Uses and Geographical Scale Matter?” Journal of Urban Health 87: 782–795. doi:10.1007/s11524-010-9488-7.
- Eisenberg, Y., K. Vanderbom, and V. Vasudevan. 2017. “Does the Built Environment Moderate the Relationship between Having A Disability and Lower Levels of Physical Activity? A Systematic Review.” Preventive Medicine 95: S75–S84. doi:10.1016/j.ypmed.2016.07.019.
- Emerson, R., K. Naghshineh, J. Hapeman, and W. Wiener. 2011. “A Pilot Study of Pedestrian with Visual Impairments Detecting Traffic Gaps and Surges Containing Hybrid Vehicles.” Transportation Research Part F 14: 117–127. doi:10.1016/j.trf.2010.11.007.
- Frazila, R., and F. Zukhruf. 2018. “Exploring Physical Attributes of Walkability from Perspective of Blind Pedestrians.” MATEC Web of Conferences 147: 1–5.
- Gerber, E., and Kirchner, C. 2003. “Livable Communities Throughout the Life Course.” Disability Studies Quarterly 23: 41-57.
- Glass, T., and J. Balfour. 2003. “Neighborhoods, Aging, and Functional Limitations.” In Neighborhoods and Health, edited by I. Kawachi and L. Berkman, 303–334. New York: Oxford University Press.
- Golledge, R., C. Costanzo, and J. Marston. 1995. “Public Transit Use by Non-driving Disabled Persons: The Case of the Blind and Vision Impaired.” In Annual PATH Conference, 1–25. Gregory, USA.
- Gual, J., M. Puyuelo, and J. Lloveras. 2011. “Universal Design and Visual Impairment: Tactile Products for Heritage Access.” In Proceedings of the 18th International Conference on Engineering Design, Impacting Society through Engineering Design, 155–164. Denmark: Lyngby/Copenhagen.
- Hajrasouliha, A., and L. Yin. 2015. “The Impact of Street Network Connectivity on Pedestrian Volume.” Urban Studies 52: 2483–2497. doi:10.1177/0042098014544763.
- Hersh, M. A. 2014. “Improving Deafblind Travelers’ Experiences: An International Survey.” Journal of Travel Research 55: 380–394. doi:10.1177/0047287514546225.
- Imrie, R. 1996. Disability and the City: International Perspectives. London, UK: SAGE Publications.
- Jolly, D., M. Priestley, and B. Matthews. 2006. Secondary Analysis of Existing Data on Disabled People’s Use and Experiences of Public Transport in Grreat Britain. Centre for Disability Studies. Leeds: University of Leeds.
- Jonnalagedda, A., L. Pei, S. Saxena, M. Wu, B. Min, E. Teves, A. Steinfeld, and B. Dias. 2014. “Enhancing the Safety of Visually Impaired Travelers in and around Transit Stations.” US Department of Transportation Univerisity Transportation Center Program report, CMU-RI-TR-14-28. Pittsburgh, USA: Carnegie Mellon University.
- Kim, K., J. Kim, K. Kim, Y. Ko, H. Jung, and S. Kim. 2016. “Design Direction of Bus and Bus Stop for the Blind and the Physically Challenged.” In KSDS Fall International Conference, 56–57. Seoul, South Korea.
- Kim, T., D. Sohn, and S. Choo. 2017. “An Analysis of the Relationship between Pedestrian Traffic Volume and Built Environment around Metro Stations in Seoul.” KSCE Journal of Civil Engineering 21: 1443–1452. doi:10.1007/s12205-016-0915-5.
- Kim, W., Y. Lee, and S. Kim. 2009. “Examination of Public Transit Use Patterns and Development of High-tech Walking-aid System at Public Transit Facilities for the Blind and Visually Impaired.” Seoul Studies 10: 97–114.
- Kirchner, C., E. Gerber, and B. Smith. 2008. “Design to Deter: Community Barriers to Physical Activity for People with Visual or Motor Impairments.” American Journal of Preventive Medicine 34: 349–352. doi:10.1016/j.amepre.2008.01.005.
- Koutsoklenis, A., and K. Papadopoulos. 2011. “Auditory Cues Used for Wayfinding in Urban Environments by Individuals with Visual Impairments.” Journal of Visual Impairment & Blindness 105: 703–714. doi:10.1177/0145482X1110501016.
- Lee, W., S. Park, and K. Ye. 2018. “A Study on the Quality of Life Depending on the Degree of Visual Impairment: With Activities of Daily Living and Instrumental Activities of Daily Living.” Journal of Korean Ophthalmic Optics Society 23: 203–212. doi:10.14479/jkoos.2018.23.3.203.
- Loomis, J., L. Klatzky, and R. Golledge. 2001. “Navigating without Vision: Basic and Applied Research.” Optometry and Vision Science 78: 282–289. doi:10.1097/00006324-200105000-00011.
- Marston, J., and R. Golledge. 1997. “Removing Functional Barrier: Public Transit and the Blind and Vision Impaired.” In Proceedings of the 1997 Society for Disability Studies 10th Annual Meeting, Minneapolis, Minneapolis: Society for Disability Studies.
- Marston, J., and R. Golledge. 2000. Toward an Accessible City: Removing Functional Barriers for the Blind and Vision Impaired: A Case for Auditory Signs. Berkeley, CA: University of California Transportation Center.
- Marston, J., and R. Golledge. 2003. “The Hidden Demand for Participation in Activities and Travel by Persons Who are Visually Impaired.” Journal of Visual Impairment & Blindness 97: 475–488. doi:10.1177/0145482X0309700803.
- Marston, J., R. Golledge, and C. Costanzo. 1997. “Investigating Travel Behavior of Nondriving Blind and Vision Impaired People: The Role of Public Transit.” Travel Behavior of Blind and Vision Mipaired People 49: 235–245.
- Matthews, M., and P. Vujakovic. 1995. “Private Worlds and Public Places - Mapping the Environmental Values of Wheelchair Users.” Environment and Planning A 27: 1069–1083. doi:10.1068/a271069.
- Ministry of Land, Infrastructure, and Transport. 2017. 2016 Survey on Transportation Environment for Mobility Disabilities. South Korea: Ministry of Land, Infrastructure and Transportation.
- Montarzino, A., B. Robertson, P. Aspinall, A. Ambrecht, C. Findlay, J. Hine, and B. Dhillon. 2007. “The Impact of Mobility and Public Transport on the Independence of Visually Impaired People.” Visual Impairment Research 9: 67–82. doi:10.1080/13882350701673266.
- Norgate, S. 2012. “Accessibility of Urban Spaces for Visually Impaired Pedestrians.” Municipal Engineer 165: 231–237. doi:10.1680/muen.12.00019.
- Oliver, M. 1996. Understanding Disability: From Theory to Practice. Basingstoke, UK: Macmillan.
- Rundle, A. G., D. M. Sheehan, J. W. Quinn, K. Bartley, D. Eisenhower, M. M. D. Bader, G. S. Lovasi, and K. M. Neckerman. 2016. “Using GPS Data to Study Neighborhood Walkability and Physical Activity.” American Journal of Preventive Medicine 50: e65–e72. doi:10.1016/j.amepre.2015.07.033.
- Saelens, B. E., J. F. Sallis, and L. D. Frank. 2003. “Environmental Correlates of Walking and Cycling: Findings from the Transportation, Urban Design, and Planning Literatures.” Annals of Behavioral Medicine 25: 80–91. doi:10.1207/S15324796ABM2502_03.
- Saelens, B. E., and S. L. Handy. 2008. “Built Environment Correlates of Walking: A Review.” Medicine and Science in Sports and Exercise 40: S550. doi:10.1249/MSS.0b013e31817c67a4.
- Schmöcker, J., M. Quddus, R. Noland, and M. Bell. 2012. “Mode Choice of Older and Disabled People: A Case Study of Shopping Trips in London.” Journal of Transport Geography 16: 257–267. doi:10.1016/j.jtrangeo.2007.07.002.
- Seo, I. 2018. “Checking the Use of Internet Shopping among the Visually Impaired.” The Ablenews, March 12.
- Smirnov, O., and L. Anselin. 2001. “Fast Maximum Likelihood Estimation of Very Large Spatial Autoregressive Models: A Characteristic Polynomial Approach.” Computational Statistics & Data Analysis 35: 301–319. doi:10.1016/S0167-9473(00)00018-9.
- Smith, S. 2009. “Social Justice and Disability: Competing Interpretations of the Medical and Social Models.” In Arguing about Disability: Philosophical Perspectives, edited by Kristjana Kristiansen, Simo Vehmas and Tom Shakespeare, 15–29. Oxon, UK: Routledge.
- Sohn, D., A. V. Moudon, and J. Lee. 2012. “The Economic Value of Walkable Neighborhoods.” Urban Design International 17: 115–128. doi:10.1057/udi.2012.1.
- Sung, H. G., D. H. Go, and C. G. Choi. 2013. “Evidence of Jacobs’s Street Life in the Great Seoul City: Identifying the Association of Physical Environment with Walking Activity on Streets.” Cities 35: 164–173. doi:10.1016/j.cities.2013.07.010.
- Taylor, Z., and I. Józefowicz. 2012. “Intra-urban Daily Mobility of Disabled People for Recreaional and Leisure Purposes.” Journal of Transport Geography 24: 155–172. doi:10.1016/j.jtrangeo.2011.12.008.
- Toole, J. L., Y.-R. Lin, E. Muehlegger, D. Shoag, M. C. González, and D. Lazer. 2015. “Tracking Employment Shocks Using Mobile Phone Data.” Journal of the Royal Society Interface 12: 20150185. doi:10.1098/rsif.2015.0185.
- Troped, P. J., R. P. Saunders, R. R. Pate, B. Reininger, and C. L. Addy. 2003. “Correlates of Recreational and Transportation Physical Activity among Adults in a New England Community.” Preventive Medicine 37: 304–310. doi:10.1016/S0091-7435(03)00137-3.
- Wang, F., and C. Chen. 2018. “On Data Processing Required to Derive Mobility Patterns from Passively-generated Mobile Phone Data.” Transportation Research Part C: Emerging Technologies 87: 58–74. doi:10.1016/j.trc.2017.12.003.
- Wang, Z., S. Y. He, and Y. Leung. 2018. “Applying Mobile Phone Data to Travel Behaviour Research: A Literature Review.” Travel Behaviour and Society 11: 141–155. doi:10.1016/j.tbs.2017.02.005.
- Weerasinghe, S., and D. Dissanayake. 2017. “Understanding Human Walking Behaviour in Relation to Built Environment: A Mobile GIS Approach.” In GIS Research UK. University of Manchester. http://huckg.is/gisruk2017/GISRUK_2017_paper_46.pdf
- Wong, S. 2018. “Traveling with Blindness: A Qualitative Space-time Approach to Understanding Visual Impairment and Urban Mobility.” Health & Place 49: 85–92. doi:10.1016/j.healthplace.2017.11.009.
- World Health Organisation. 2007. Global Age-friendly Cities: A Guide. France: WHO.