
 ?Mathematical formulae have been encoded as MathML and are displayed in this HTML version using MathJax in order to improve their display. Uncheck the box to turn MathJax off. This feature requires Javascript. Click on a formula to zoom.
ABSTRACT
Architectural style positioning is an important part in the process of residential building design and project planning. However, in practice, due to the complexity and ambiguity of styles, style positioning often relies more on the subjective judgement of the designers and lacks scientificity. This paper proposes a method for the classification and prediction of residential building styles. Through structured interviews and questionnaire surveys on front-line designers and project planners, it refines the key morphological elements and the site economic factors that influence architectural style classification and positioning. Based on machine learning, after analysing the data of 372 newly built real estate projects in Hangzhou, the research finds t|TABE_A_1779728|TABE_A_1779728hat the current real estate styles can generally be divided into 8 categories. Whether it is a curved volume, the shape of the roof and the richness of the tones are the most important morphological variables that differentiate style categories, and the building height is the most important economic factor for style positioning. When using the selected five economic factors as independent variables to train a neural network model and predict the morphological elements and style categories, the average accuracy reaches 77.2%.
1. Introduction
Style is a label that expresses the morphological characteristics and cultural connotations of architecture (Baker Citation2018; Cragoe Citation2008; Poppeliers and Chambers Citation2003; Bridge Citation2015). Architectural style could be reflected in aspects of appearance, space composition, colour matching, material selection and indoor environment (Edwards Citation2016; Kanleaf Citation2015; Hiroyuki Citation2013; Qian Citation2005). The exterior appearance style not only reveals the use, value and culture background of architectures (Abbas and Sulaiman Citation2010) but is also an important aspect for people to perceive and evaluate the city (Nasar, Stamps, and Hanyu Citation2005). That is why the positioning of architectural appearance style draws concerns in the planning of residential projects.
However, the determination of style is complicated and vague in practice. First, the concept of style is subjective (Rasmussen Citation2008; Giedion Citation2009). There are uncertainties in styles classification and their elements extraction (Cragoe Citation2008). Second, the style determination could be affected by various external conditions (Roth and Roth Clark Citation2013; Rossi Citation1984). Yet little research has been found on the systematic extraction method of architecture style based according to different design conditions with scientific methods. In addition, the style of an actual design project is usually a mix, particularly for the residential building. Because it is more vulnerable to considerations from business and market (Jeong et al Citation2013), the style of residential buildings can not strictly conform to the historical or academic definition. It is freer and more diverse (Guangzhou Tangyi Culture Communication Co. Citation2013). So in many projects, we can see the style characteristics do not match the implication of the name (Wu Citation2011; Xu and Yan Citation2006). This chaotic situation causes obstacles to professional communication and leads to misunderstandings among ordinary people. Therefore, there is an imperative need to propose a novel method for the better understanding of the linkage between morphological elements and styles, and how they are influenced by design conditions. It contributes to the innovation of distinctive and suitable architectural styles for designers and planners.
The aims of this research are as follows: 1) Refine key morphological variables that form the style of residential buildings. 2) Propose style classification methods of residential buildings and compare different styles. 3) Find out the key site economic factors that influence the determination of residential building styles and judge their relevance with architectural styles and morphological variables. 4) Establish a prediction model that can be used to predict the style of residential buildings.
2. Literature review
2.1. General analysis
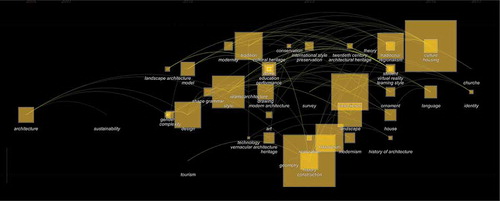
Although style is always a central topic of architectural research, the related researches are still insufficient. We use the keywords “architecture” and “style” to search in the architectural field in the Web of Science. It is a total of 489 articles before 2019, including journal articles and proceeding papers. Through co-word analysis () in CiteSpace (Chen Citation2016) and critical reading of key literature, the study finds that: 1) Research themes are mainly on style features and history; 2) Research contents concentrate on the historical background, morphological characteristics, analytical comparison and subjective evaluation; and 3) Research methods mainly include history, sociology, typology and basic morphology. Generally, the research topics are relatively fragmented, the case data sources are relatively unitary. Quantitative studies are few, and the attentions paid on determining style in the design practice are insufficient.
Figure 1. Co-keywords network analysis concerning architectural styles
2.2. History dimension of architectural style
The basic style of architectural art is a product of history (Glancey Citation2017; Cragoe Citation2008); it is a comprehensive reflection of the culture, economy and politics of a region in certain historical period, which represents the common tendency of artists in form creation (Fernie Citation2014). The basic classification methods of style are based on times (Ching, Jarzombek, and Prakash Citation2017; Harris Citation1983), cultural circles (Hansen Citation2017; Fletcher Citation2018) and geographical scope (Canleaf Citation2015; Wang Citation2018; Hopkins Citation2014). For example, by ages, there are Classicism, Gothic, Renaissance, Rationalism, Decorativeism, Modernism. By regions, there are British, German, American, Nordic, and Mediterranean styles. The style recognition is based on different features in space, details, materials and construction technology. Among them, basic building elements such as roofs, doors, windows, columns, domes, towers, arches, are the most salient (Calloway et al. Citation2012; Coho Citation2006; Roth and Roth Clark Citation2013).
Historical styles are often associated with their aesthetic meaning. The accumulation of architectural images leads to the formation of a style, and its repetition deepens people’s aesthetic perception on it. The link of form and its implications are constantly reflected in practice and ultimately lead to the inseparability of the two (Hillenbrand Citation2004; Rossi 1984). Thus, through type deduction and a pictorial thought process (White Citation1975) architectural typology (Kerier Citation2016; Tian Citation2014; Semper, Mallgrave, and Robinson Citation2004) analyses, refines and reorganizes style elements (Lowe and Koetter Citation1984; Jacoby Citation2016) to realize the critical inheritance of the traditional styles.
However, such a qualitative classification method is inevitably subjective and fuzzy. First, most styles are overlapped which makes it difficult to distinguish their differences. For example, both minimalism and modernism use simple rectangular forms, and both Baroque and Rococo use complex curves (Claudia and Daniela Citation2019). Second, architectural historians have proposed different theoretical and philosophical views, such as constructivism (Frampton and CavaCitation2001), deconstructivism (Xue Citation2019) and functionalism (Gao Citation2009). There is no uniform standard. Moreover, these theories do not match the current design practice. Most residential designs do not follow a certain historical style but borrow and restructure elements from various styles (Yang Citation2012). The well-known architects also tend to create their own styles.
2.3. Perception cognition of architectural style
The perception of style is subjective. Studies on people’s visual and perceptual evaluation on styles can help urban designers and planners consider more on the public’s willingness to in urban development (Askari et al. Citation2014). The key visual elements of styles and what they mean can be identified through subjective evaluations, such as clarity, complexity, friendliness, originality, sturdiness, significance and some other cognitive factors (Brown and Gifford Citation2001). These factors are usually combined with cognitive responses, such as reference (like – dislike), awake (awake – sleepy), natural (natural – artificial) and relaxed (relaxed – pain) (Cubukcu and Kahraman Citation2008), or even brain wave response (Cheng and Li Citation2018). The visual quality of a project or an urban district can be enhanced by combining these elements suitably, such as legibility, coherence and harmonious repetition (Akalin et al. Citation2010; Imamoglu Citation2000). Zhao, Ge, and Hua (Citation2009; Xu, Chen, and Gu et al. Citation2011) determined the architectural styles of the city through the steps of choosing the influencing factors of the architectural styles, assigning weights to the factors, and comprehensive weighted-overlay. This kind of quantitative analysis method transforms the consciousness in the individual’s architectural style cognition into an unconscious objective existence of the group.
2.4. Rational cognition of architectural style
Unlike perceptual evaluation research, shape grammar interprets style problems by an abstract mathematical means from the view of geometry (Li Citation2011). Stiny (Stiny Citation1980) defined style analysis as a set problem. Formal grammar can not only create new designs but also be used to evaluate style similarity and other issues by establishing the logic of the combination of style elements (grammar). Duarte’s research on Siza’s work has proven its feasibility (Duarte Citation2005). Other researchers have developed similar analysis techniques, e.g. using box-counting of fractal geometry to evaluate the visual complexity of building facades (Samper and Herrera Citation2016; Ostwald and Ediz Citation2015; Vaughan and Ostwald Citation2014; Lee, Ostwald, and Gu Citation2017; Lorenz Citation2014), applying graph theory principles and between centrality to reveal the existence of different hierarchies controlling the facade system (Boussora Citation2015), using spatial syntax indicators to compare and analyse the similarity of the layouts of different buildings (Behabahni et al. Citation2016). Some mathematical analysis models and tools, such as fuzzy inference systems (Abracioglu Citation2010), neural networks (Hsiao and Tsai Citation2005), genetic algorithms (Pal, Tigga, and Kumar Citation2005), region segmentation algorithms (Sunil and Pande Citation2008) have also been used to analyse morphological features. Their analysis results by mathematical model have an auxiliary reference value indeed. But it should be emphasized that the understanding and evaluation of style are ultimately of human subjective judgement. It can not absolutely independent of architects’ experience and intuition. Hence, how to integrate subjective judgement and objective logic is an important issue in style research. In this regard, Banaei et al. manually marked indoor space images and used AI algorithms to classify indoor architectural styles of different historical periods (Banaei, Ahmadi, and Yazdanfar Citation2017). Han (Han Citation2018) explored the calculation method of measuring the similarity of morphology through a similarity model weighted by experts.
3. Methodology
3.1. Research framework
Compared with previous studies, the innovation of this research is to comprehensively use machine learning techniques to construct a systematic research framework for analyzing, comparing, and predicting the style of residential buildings, which is usually ambiguous defined in design practice.
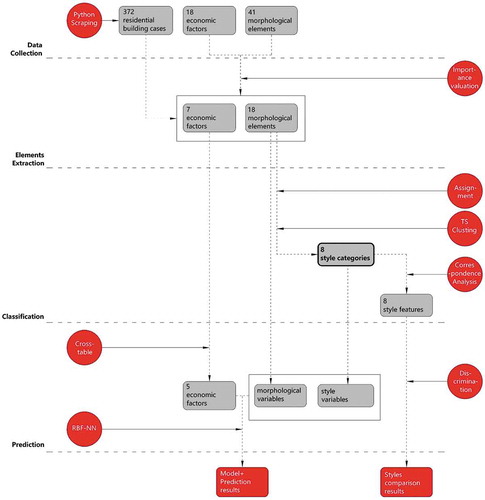
The research first extracts key morphological elements and site economic factors affecting style by literature review and questionnaire surveys. Then based on variable assignment of the morphological elements, 372 residential cases completed in Hangzhou from 2009 to 2019 are divided into 8 categories by two-step clustering. The features of each style category are revealed by correspondence analysis. Further, it uses discriminant analysis to establish eight formulas in order to validate the accuracy of styles categorizing by two-step clustering and recognize style categories for unknown cases. In addition, through cross-tabulation analysis, the research identifies five site economic factors which are significantly correlated with morphological elements and style categories. Taking them as the inputs and outputs, respectively, it finally constructs a neural network model and explores the possibility of style prediction ().
Figure 2. Research framework
3.2. Structure interview and hypotheses
The study selected 13 relevant practitioners from five institutions in Hangzhou, including architects, project managers and university teachers, to conduct face-to-face or telephone interviews. The survey period was from May to June 2019. Based on interview feedback () and literature reviews, the research proposes that the basic assumptions are as follows:
The residential building design should express a certain characteristic of style.
The style of residential buildings is composed of different morphological elements.
The formation of style is not only derived from the subjective ideas of architects or project planners but can also be potentially affected by objective conditions.
Table 1. Examples of questions and answers in structured interview
3.3. Elements selection and questionnaire survey
Morphological elements refer to various aspects and levels. We first conducted preliminary summary and selection from the literature on historical style and modern residential design cases (). From the historical-style literature (Cragoe Citation2008; Roth and Roth Clark Citation2013; Coho Citation2006; Roth and Roth Clark Citation2013), we have refined basic components or aspects (such as whether to use a lot of curvilinear styling) which can distinguish different historical styles, rather than the unique characteristic of a certain style (such as rose windows for Gothic); For the cases of modern architecture (Guangzhou Tangyi Culture Communication Co., Ltd Citation2013), we have summarized the morphological strategies commonly used in residential building design. In this way, a total of 41 morphological elements are obtained in three aspects of facade, volume and details; For the economic factors, we took interviews and invited designers and practitioners to propose the site economic factors that may influence design decision based on their own experience and intuition. After removing some non-universal factors (such as special requirements for styling in regulations.) and merging similar and identical factors, a total of 18 items were obtained. Afterwards, a ranking investigation was conducted on these style elements and economic factors to evaluate their importance. The survey was carried out from 15 May 2019 to 10 June 2019, and 3 July 2019 to 6 August 2019. A total of 132 questionnaires were distributed. Invalid questionnaires such as professional mismatch and insufficient work experience of respondents were eliminated. Finally, we got 113 valid questionnaires, and the effective rate was 85.6%. The respondents consisted of design professionals, real estate planners, and non-professionals. The questionnaire evaluated the importance of the elements and factors in scores: Very important was 2; Generally important was 1; And uncertain was 0. If the elements or factors whose scores from each of three kinds of respondents and total scores from all three were above the average, they were selected as important.
Table 2. Preliminary morphological elements of residential building style
3.4. Cases and data collection
Python crawler technology was used to collect the data and photos of a total of 1,024 newly constructed properties in Hangzhou from 2009 to 2019 on the Anjuke website (https://hangzhou.anjuke.com/) and then randomly selected 390 of them as research objects for manual annotation. The annotation was performed by three architectural professionals with simple training. Excluding incomplete data samples, the total number was 372. For labelling objectivity, a clear dichotomy was applied to most options. The annotated content and assignment rules are shown in . The economic data, such as price, location, floor area ratio, building height, density, and greening ratio, were from the online data of the 5i5j website (https://hz.5i5j.com/) and Baidu Maps (https://map.baidu.com/).
Table 3. The site economic factors affecting style positioning
Table 4. Assignment method of key style morphological elements
3.5. Two-step clustering
Binarized data of 372 cases are calculated using a two-step clustering method to obtain style categories. Compared with the traditional clustering method, the advantages of two-step cluster (TSC) are compatible with discrete variables and automatically suggesting the optimal number of categories according to certain statistical standards which makes the classification results more reliable. The TSC calculation method has two main steps:
1) Building a cluster feature (CF) tree, place the first record in the dataset on a leaf node initiated by the root of the tree, and then use distance measurement as a similarity criterion. According to its similarity with the existing nodes, it merges with the existing nodes to generate new nodes. The distance measurement model uses logarithmic similarity. The calculation formula is as follows (Chiu et al. Citation2001):
In the formula, represents the sum of all the continuous variables.
represents the sum of all the categorical variables. Lk represents the category number of the No.k categorical variable.
represents the record number of Category k.
represents the estimated variance in the No.k continuous variable in the entire dataset.
represents the estimated variance in the No.k continuous variable in Category k.
represents the estimated mean of the No.k continuous variable in Category j.
represents the record number of No.k categorical variables of the first category in Category j.
represents record number for the No.k categorical variable in Category 1.
represents the distance between Category j and s. <j,s> represents the joint index of Category j and s.
2) The merge clustering algorithm can be used to combine the leaf nodes to generate a clustering scheme with a different number of clusters. Then, various clustering schemes are compared depending on the standard Bayesian information criterion (BIC) for automatically selecting the number of clusters. The calculation formula of BIC is (Bogdan, Ghosh, and Doerge Citation2004):
In the formula, N represents the number of records in this dataset. is the maximum of the likelihood function. mj is the number of model parameters.
3.6. Correspondence analysis
Two-Step Clustering shows the importance of variables for classification, but it can identify which variables are essential to a certain category. Correspondence analysis is employed to explain the intrinsic relationship between the variables by the analysis of the interactive summary data composed of attribute variables; it can also reveal the differences between the various categories of the same variable and the corresponding relationship between different variables. The more categories the variables are divided into, the more obvious the advantages of this method have. The main calculation process is as follows:
First, assume there are n samples, every sample observes m variable values, then the original data are:
In the formula: xij represents the jth variable of the No.i sample.
Second, calculate the sum by row Xi and column Xj, and the sum of all T.
Third, calculate the probability matrix P of the original data,
Fourth, calculate the data transformation matrix Z,
Fifth, calculate the covariance matrix of the variables,
Calculate the covariance matrix of samples
Sixth, R-type factor analysis: calculate the eigenvalues of variable covariance matrix, λ1> λ2> … λm; take the first k eigenvalues whose cumulative contribution values are greater than 70% ~ 90% to calculate the corresponding feature vectors u1, u2., uk, then obtain the loading matrix of R-type factor, F = [F1,F2 … Fk], in that, Fk = uk.λk
Q-type factor analysis: For the first k eigenvalues obtained by R-type factor analysis, calculate the eigenvalues corresponding to matrix B, v1 = Zu1, v2 = Zu2, …, vk = Zuk, and then unitize it to obtain the load matrix of the R-type factor, G = [G1,G2 … Gk], in that, Gk = vk λk.
Seventh, plot on a two-dimensional factor axis. R-type analysis and Q-type analysis are reflected in one graph at the same time.
3.7. Discrimination analysis
This research adopts discriminant analysis to establish discriminant functions based on TSC classification. These discriminant functions can be used to determine which style category a new case belongs to. So the popular styles from the current real estate market and the styles from TSC in this research can be compared. Among all discriminant methods, the Fisher discriminant method has no special requirements on the distribution and variance in the population. Its basic idea is first to calculate the coordinates of the centre of gravity of each category in the low-dimensional space using the typical variables, then calculate the coordinate values of each sample by discriminant functions to make a judgement about the category of the sample. The general form of the linear discriminant function in the Fisher discriminant method is:
In the formula: ;
; y is the discriminant value.
are the variable values that reflect the characteristics of the study object;
represents the discrimination coefficient of the corresponding variable; k is the number of variables.
For the discriminant function to distinguish samples from different populations well, it is necessary to make the difference between groups from different populations as large as possible and maintain the intra-group dispersion of each group as small as possible, which means λ should be as large as possible:
In the formula: ,
is the total mean vector; m is the total number; ni is the sample number of the ith population;
and
, respectively, are the sample mean and sample variance in discriminant values in the ith population.
3.8. RBF-NN
The radial basis function neural network (RBF-NN) is an artificial neural network that uses local acceptance domains to perform function mapping based on the knowledge of local regulation and overlapping acceptance areas of living organisms. As RBF-NN can approximate arbitrary nonlinear functions and learning speed is very fast, it has been successfully applied to nonlinear function approximation, pattern recognition, and information processing (Seshagiri and Khalil Citation2000). RBF-NN is a typical three-layer forward network consisting of an input layer, a hidden layer, and an output layer ().
Figure 3. RBF-NN model Structure
Assume the input of the RBF-NN is a k-dimensional vector x = [x1,x2 …, xk], a radial basis function is used to realize the nonlinear transformation of input information from the input layer to the hidden layer. The most common RBF Gaussian functions: , parameter σ is the width of RBF. Finally, the network output is a weighted output of the hidden layer, and its linear mapping relationship is
. In the formula, x is the input vector,
is the RBF function;
represents the Euclidean norm,
is the network weight; N is the number of neurons in the hidden layer;
is the RBF centre of the input vector space.
This research site economic factors and morphological elements are taking as the input and output to establish the RBF-NN model to explore the morphological elements and style categories of residential buildings.
3.9. SPSS modeler
IBM SPSS Modeler is a leading data mining platform with graphical grammar as the user interface. It encapsulates the most advanced statistics and data mining technology to obtain prediction knowledge, and can provide data mining related full-process functions as data understanding, conversion, analysis, modeling, evaluation. SPSS Modeler uses a simple drag-and-drop method to quickly build data mining analysis models, including analysis algorithms from statistics, machine learning, artificial intelligence and other aspects, such as cluster analysis, discriminant analysis, neural networks, etc. (Xue and Chen Citation2019). It can achieve association and classification, prediction and other comprehensive mining and analysis functions.
4. Analysis results
4.1. Differentiation and comparison of style features
4.1.1. Key variables
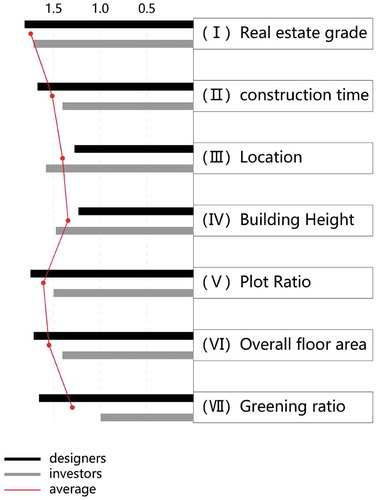
According to the survey results (, ), the average scores of the importance of 41 style morphological elements are 1.05 (designers), 1.15 (investors) and 1.11 (non-professional). There are 18 style elements of 41 whose importance scores are all above the average scores for three kinds of respondents: material type (F1), Hue (F2), color brightness (F3), colour richness (F4), directionality of decorative lines (D1), balcony type (D2), balcony shape (D3), window type (D4), bay window (D5), sunshade (D6), with or without complicated stitching (D7), decorative framework (D8), planar complexity (V1), whether the shape is curved (V2), whether the volume is segmented (V3), roof type (V4), whether the roof is staggered (V5) and corner treatment (V6). Of 18 site economic factors, there are 7 items whose importance scores are above the average for two kinds of respondents (designers and investors). They are property grade (I), construction time (II), location (III), building height (IV), plot ratio (V), overall floor area (VI), and greening ratio (VII).
Figure 4. Importance scores of morphological elements
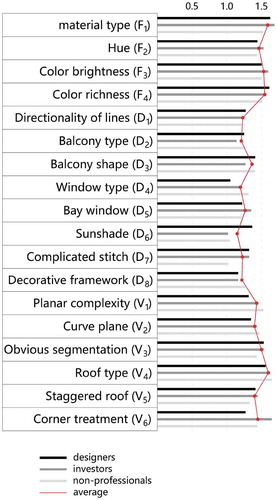
Figure 5. Importance scores of site economics factors
4.1.2. Style categories
The selected 18 morphological elements of 372 cases are assigned certain values, respectively, in accordance with the rules in , then TSC analysis is performed. is the automatic clustering table for TSC, which represents the process of selecting the number of clusters. According to the rule of automatic determination on the number of clusters, the determination of the optimal number of clusters not only requires the minimal BIC value but also requires the change rate of BIC and the change rate of distance measures to be the largest. Thus, the cluster number of 8 is the optimal choice, with a contour coefficient of 0.25 which indicates that the classification effect is acceptable (Generally, when the contour coefficient is greater than 0.2, it means that the clustering result is good.). Of the 372 cases, 35 are allocated to category 1 (9.4%), 48 to category 2 (12.9%), 37 to category 3 (9.9%), 76 to category 4 (20.4%), 82 to category 5 (22.0%), 35 to category 6 (9.4%), 30 to category 7 (8.1%), and 29 to category 8 (7.8%), with no missing values.
Table 5. Automatic clustering process
shows the clustering importance of variables, of which whether the shape is curved (V2) is the most important with a value of 1.0. Secondary is roof type (V4), color richness (F4), tone (F2), balcony form (D2), whose importance values are 0.95, 0.88, 0.73, and 0.72, respectively. Other variables, such as material type (F1), corner treatment (V6), balcony shape (D3), color brightness (F3) and decorative framework (D8), influence classification result to some extent.
Figure 6. Clustering importance ranking of variables
4.1.3. Categorical features
reflects the quantitative distribution according to different variables for the eight styles. For the three most important variables, the shape without curve accounts for 97.1% in the first category, nearly all of which are of flat roof and rich colour appearance. In the second category, the shape without a curve accounts for 89.6%, 95.8% is flat roof, and 75% is a single colour. In the third category, the shapes are all non-curved and rich in colour, and 97.3% are flat roofs. In the fourth category, there is no curve in the shape, and flat roof and rich colour are 98.7%. The colour in the fifth category is all single, and most of which are of curved shape and flat roof (98.8%, 92.7%). The sixth category are featured in sloped roof, and the most are of non-curved shape. Half of the cases are combined colors. In the seventh category, 96.7% has a curve. The flat roof accounts for 90%. And most of them are in single colour. In the eighth category, the shapes have no curve. And most of them are flat roofs. More than half (58.6%) are rich in colour.
Table 6. Quantitative distribution of variables in eight styles
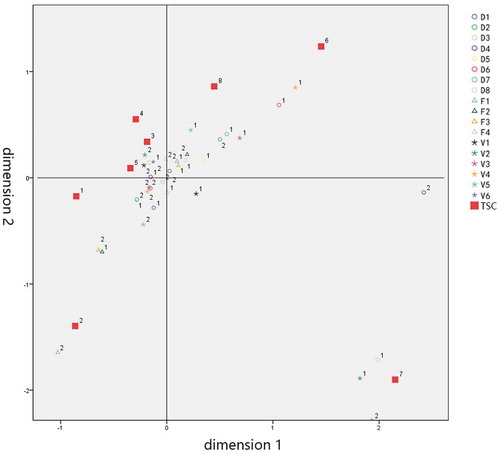
Corresponding analysis further explores the characteristics of eight styles. It reflects the variables and the relationships between variables on a two-dimensional scatter plot (the corresponding distribution map). The map concentrates the closely related category points and scatters the weakly related category points. Two principles need the following when reading multiple correspondence analysis diagram: 1) different classes of the same variable that are located in the same orientation or area from the origin (0,0) have similar properties, and 2) different variables that are located in the same direction and area from the origin may have a connection. On these bases, the results can be obtained from as follows: 1) the main feature of the first category is the concave balcony; 2) the second category is featured in the external material of the glass curtain wall; 3) the third and fourth types have non-curved shapes; 4) the fifth category is of uniform opening and regular plan; 5) the sixth category is characteristic of sloping roof and obvious sunshade components; 6) the seventh category is curved shape and balcony; 7) for the eighth category is the staggered roof; 8) from , it can be seen that category three, four, and five are closer, while the seventh category is considerably different from the others.
Figure 7. Two-dimension corresponding analysis
In are the visualization of eight styles based on the results of both TSC and corresponding analysis.
Table 7. The feature sample of eight style categories
4.1.4. Style comparisons
The study uses the style morphological elements as independent variables to perform discriminant analysis on different style categories and tests the effect of the discriminant effects. It is not better to input more variables into discriminant analysis. Too many variables not only increase the amount of calculations, but the overall discrimination effect is also affected by the interference of variables of weak discrimination ability. Based on the TSC results, 372 sets of data are used as training samples, and the corresponding style categories are used as the grouping variable. The stepwise discriminant method is used to select the analysis variable. Fifteen variables are entered into the discriminant functions, and three variables are eliminated. Finally, eight discriminant functions are obtained in . For example, the discriminant function for category 1 is:
Table 8. Coefficients of Fisher’s linear discriminant functions
f(1) = 30.893*F1 + 15.765*F2 + 10.221*F3 + 32.137*F4 + 15.480*D2 + 51.152*D3 + 26.537*D5 + 17.876*D6 + 11.413*D7 + 20.275*D8 + 11.413*V1 + 168.115*V2 + 15.679*V3 + 58.181*V4 + 2.142*V5-358.266
The variance test for discriminant functions shows P < 0.005, which means that the functions have significant effects on discrimination and that the reliability of category results can be tested by the discriminant functions with 15 variables. For any case of unknown style, when substituting the value of the variables of the sample into these eight discriminant functions to calculate the function value, the style category of the case belongs to the one of which function value is the largest. Overall, the group identification obtained by discriminant analysis is basically the same as the clustering result. For the 372 cases, the overall consistency rate of the discrimination to the clustering result reaches 89.5%. For all the variables in this study are discrete variables, this discrimination effect is quite acceptable. This also proves that the eight types of classification by TSC are reasonable. Fisher’s discrimination functions obtained can effectively identify the style category to which a new case may belong.
The study selects several standard cases of popular styles from the works of China’s largest real estate development companies. Compared with small companies, their style naming methods are relatively stable and mature. By discriminant functions, it calculates their style categories of TSC to help us understand their numerical relationships. As shown in , among the popular styles examined, Modern style belongs to category 1, the Modern Minimalism style to category 2, and Modern Elegance to category 3. International, International Elegant, and European Minimalism are relatively similar to category 4. Classical Minimalist corresponds to category 5. Continental, Chinese Modern and French are in category 6, while Modern Minimalism and Post-modern are in categories 7 and 8, respectively.
Table 9. Comparison of popular styles
4.2. Style prediction
4.2.1. Relationship between morphological elements and economic factors
As most of the style factors are categorical variables and most of the site economic factors are continuous variables, we use Chi-square test in cross-tabulation to analyse the correlation of the two. In the process, the continuous variables involved are converted into interval variables (nominal by interval). The analysis results are shown in . Overall, site economic factors have some influence on morphological elements. There are five site factors that are significantly related to the style category: construction time, location, building height, plot ratio and green ratio. Among the seven site factors, building height and construction time are most influential on the morphological elements and style category. The cross-tabulation analysis of these two economic factors and the style categories show that there are more sixth category style in low rise and multi-stories buildings, and the other style categories are mostly concentrated in high-rise buildings. Style categories four and five appear later, while categories seven and eight appear earlier. In the seven site factors, real estate grade and total building area have no correlation with style morphological elements and style category. Second, it can be seen that different morphological elements are affected to varying degrees by economic factors. Roof type (V4) is mostly affected, mainly from the four economic factors of construction time, location, building height and plot ratio. While bay window (D5) is barely affected by site conditions.
Table 10. Correlation matrix of economic factors and morphological elements
4.2.2. Prediction accuracy
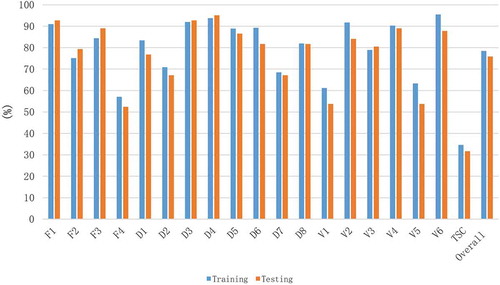
According to the results of Chi-square test, the five economic factors of construction time, location, building height, plot ratio and greening ratio are selected as inputs to predict style morphological elements and style category with RBF-NN. Training and testing groups account for 80% and 20%, respectively. The layer number and number of neurons in training are automatically optimized by the machine according to the situation. It can be seen from that the average prediction accuracy for the 18 elements and style categories is 77.2% (78.5% for the training group and 75.9% for the prediction group). However, the prediction capabilities of the model for each element are different. For material type (F1), balcony shape (D3), and window type (D4) the model has higher predictive power. The accuracy of training and testing groups are both above 90%. Comparatively, the predictability for colour richness (F4), planar complexity (V1), and whether a staggered roof (V5) are low. Overall, the RBF-NN model with the five site economic factors as inputs have a certain prediction ability for the style categories. The accuracy rates of the training group and the test group are 34.6% and 31.7%, respectively. Although it does not reach a very high prediction rate, this model can still offer a good reference for design practice, considering the ambiguity and uncertainty of the style determination.
Figure 8. RBF-NN prediction accuracy
5. Discussion
The purpose of the research is not to overthrow the existing style classification methods, but to propose a new understanding and interpretation of the style issues from a scientific and quantitative perspective, so as to support the design practice. Based on the results of data analysis and comparison, we consider the following aspects worthy of further discussion.
5.1. Importance ranking of style elements
The survey results show that ( and ): First, designers and project planners have high degrees of recognition of the importance of facade and volume aspects, and a relatively low degree in detail. Among the elements of facade and volume, the “material type” (F1), “color richness” (F4) and “roof type” (V4) show relatively high degree of importance. This indicates that professionals pay more attention to the elements of overall vision significance than non-professionals.
Besides, although three groups of respondents make an agreement on the importance of most of the elements, there are still exceptions for a few elements. Taking the “sunshade” for instance, designers consider it more important than the other two groups of respondents. It might be the professional experience that makes designers more sensitive to the overall effect of the shading components on the building appearance .
For site economic factors, two kinds of respondents both believe that “real estate grade” (I) is the most important external factor for determining style. The designers choose “plot ratio” (V) as the second most important factor, while project planners believed that “location” (III) is more important than “plot ratio”. However, this is not in line with the results in the cross-tabulation. It indicates that it is a common misconception that the quality of real estate can be conveyed by a certain style. In fact, a marked style itself is a manifestation of high-quality real.
5.2. Category and features
The principle of TSC aims to lead to the largest inter-group difference and the smallest intra-group difference. Theoretically, 18 morphological elements can form a total of 218 combinations. The study finally obtains 8 categories, indicating that within the research scope of the 372 cases, the style tendency of residential building is relatively concentrated. That is to say, in a certain area and time period, there may exist consensuses and similar patterns on styles during the real estate development, as it is not completely random and arbitrary. Based on the results of TSC analysis, “whether the building shape has a curve” (V2), “roof type” (V4) and “colour richness” (F4) are the most important morphological elements to differentiate categories. This shows that in order to form a certain style, the designer should give these three elements the primary attention.
The correspondence analysis illustrates the most salient features unique to each category. But they are not identical to the aforementioned three important classification elements. This is because the classification factor is to maximize the difference among the eight categories, as the corresponding analysis mainly aims to reveal the biggest difference between a certain category and the rest. Therefore, the combination of the two techniques can summarize the characteristics of a certain style category more comprehensively.
5.3. Styles comparison
The popular styles in the real estate market do not necessarily strictly conform to the definition of academia. There are many hybrid, collaged or newly created styles due to promotions by market and advertising. One of the purposes of this research is to re-understand and re-think the existing styles based on quantitative analysis with data. In this sense, the functions obtained through the discriminant analysis can reveal the actual morphological fitness of the building style that is designated. As seen in , styles with different designation may share relatively similar morphological characteristics, such as Chinese modern and French, whereas the popular styles that sound relevant may actually belong to different categories, such as Modern and Modern elegant, according to the results of TSC.
Some further implications could be made as follows: First, the existing classification methods are based on different understandings of morphological elements. There is overlapping between them, and their definitions are ambiguous. So scientific and quantitative comparison is necessary which can make it easier for administrators and non-professionals to recognize the true implications under the names of various styles. Second, sometimes the naming of popular style categories is based on one or several features of high visual significance, which are usually having historical sources. Nevertheless in a comprehensive data analysis, these features are not so significant when compared with other factors. It reminds us that the judgment of a certain style involves an integral consideration of facades, details and volume aspects, rather than only few factors with strong visual recognition.
5.4. Reflection correlation mechanism
The RBF-NN model shows that the site economic factors have predictive ability for morphological elements to some extent, but it does not mean that the determination of style is caused by these factors. In fact, there are many uncertainties and human factors in style determination. Although it is almost impossible to include all factors, we can alternatively choose those factors that are relatively objective and for which the data is feasible to obtain in the initial design phase, in order to precede design decisions with the rational auxiliary reference.
Although the correlation analysis by cross-tabulation is insufficient to reveal the correlation mechanism between morphological elements and economic factors, we can still make reasonable estimation. For example, when the building gets higher (IV), it is more likely the site is of high density, or perhaps it is in the urban center area where the building has to be strictly subject to the surrounding environment and city regulations. Therefore, the morphology becomes more concise, resulting in less convex balcony (D2), more unified the window opening form (D4), less obvious the shade (D6), less obvious the complex stitch (D7), and less significant the segmentation (V3), as is different from the building in low-density area. In addition, the structural design sheds greater influence once the building gets higher. So the flat shape (V1) is simpler, instead with a more flat roof (V4) and less staggered roof (V5). Similarly, if a case is located (III) in the urban center area, designers tend to adopt a form with uniform window (D4) and flat roof (V4), so as to make it harmonious with surrounding building featured with different shapes and styles. While the greening rate of site gets higher (VII), it means the environment is more natural and agreeable. Obviously, a building with stone exterior wall (F1) and of warm (F2) and bright (F3) colors is easier to be coordinated with the environment than one of dark and cold color glass exterior wall. The above issues are consistent with the reality of design practice, indicating that the selected site economic factors are credible as inputs to the RBF-NN model.
5.5. Limits and prospects
Overall, the conclusions of the study prove the three hypotheses we have proposed. But to make the conclusion more universal, the research also has the following limitations: First of all, the choice of style elements and site economic factors depends partly on artificial judgment. Secondly, the architectural morphology is ever-changing. Different aspects of the same morphological elements proposed in this study may not be complete. Thirdly, due to the limited number of samples, whether the methods and conclusions of the style classification and prediction proposed by the study are also applicable to other building types and different regions is still to be explored. Fourthly, the understanding of style is closely related to human subjective feelings after all, so if the classification method of machine learning used in this research can be further combined with the study of people’s perception, the conclusion can be more complete and valuable. In addition, although the external morphology has the greatest influence on style, space is the protagonist of architecture, and the organization of space is the essential difference of various styles (Ching Citation2014). Therefore, the best way to distinguish various architectural styles should be combined facade with space.
Despite the above deficiencies, this research still has a high contribution. It proposes a framework for understanding style issues by rational quantitative means. In order to make up for the shortcomings, future research needs to be combined with new technical means and methods for extension and expansion:
Cognitive science (e.g. brain wave detection) could clarify the correlation between environmental psychological variables and spatial morphological variables. It helps to evaluate people’s feelings on the objective composition of different shapes and spatial elements. that will deepen the integration of subjective and objective aspects of style research.
Computer science especially image identification technology provides a fast processing method for large quantity architectural style recognition (Bao, Schwarz, and Wonda Citation2013; Fan, Musialski, and Liu et al. Citation2014; Yu, Cai, and Xiaodong et al. Citation2019; Xu, Tao, and Zhang et al. Citation2014). The style measurement and comparison at urban scale become possible. The environment context should be considered when determining the style of a single building (Doersch, Singh, and Gupta et al. Citation2012).
6. Conclusion
The determination of style is an important but vague part of current architectural design. Based on 372 residential cases in Hangzhou, this study uses machine learning to scientifically explore the classification and prediction of styles and obtains the following conclusions:
1) According to the questionnaire survey, after ranking 41 style morphological elements, and 18 site economic factors that influence style determination, 18 important morphological elements and 7 economic factors are extracted.
2) Through TSC analysis, the 372 cases are generally divided into 8 categories. The important classification factors are whether the building shape has a curve, roof type and colour richness. In the eight categories, the fifth category are the most. It is characterized by a single colour, flat roof, uniform window openings and regular planes without a curve.
3) Through discriminant analysis, it finds that among the popular styles in current real estate market, international style, international elegant style, and European contracted style are relatively close, belonging to category four. Classical minimalist style belongs to category five. Chinese modern, continental style, and French style are in category six.
4) It finds that there is a certain correlation between site economic factors and style morphological elements. Among them, building height has the greatest influence, while real estate grade and total building area have no effect on morphological elements and style categories.
5) Finally, the RBF-NN model has been established to predict the 18 style morphological elements and style categories by using the remaining five site economic factors as independent variables. The average accuracy rate reaches 77.2%.
Acknowledgments
Specially thanks to experts and professionals who participated in this research.
Disclosure statement
No potential conflict of interest was reported by the authors.
Additional information
Funding
Notes on contributors
Bing Xia
Bing Xia got M.Arch. and PhD. Degree from Tongji university and now is a full-time lecturer at the College of Civil Engineering and Architecture of Zhejiang University. He is also the National First Class Registered Architect and member of Architectural Society of China. His primary research areas is performance analysis of urban environment and architectural morphology. He has hosted and participated several important research projects in this field and published more than 15 articles, including 5 international journals or book chapters.
Xin Li
Xin Li is currently an Associate Professor at the School of Architecture and Civil Engineering of Xiamen University, China. He received M. Arch. degree in Architecture from Iowa State University, and PhD. degree from Wuhan University. He worked at the School of Urban Design at Wuhan University since 2011-2020. He was the visiting scholar at the chair of information architecture of ETH Zurich in Switzerland. He is the member of Architectural Society of China. His main research interest involves architecture, urban studies and design.
Hui Shi
Hui Shi Currently studies in School of civil engineering and architecture, Zhejiang university, majoring in architecture. She has got awards as the title of outstanding academic model, the third-class scholarship of Zhejiang university, etc. Herresearch interests include space construction, architectural form, planning programming, data processing, etc.
Sichong Chen
Sichong Chen is a student from the department of architecture, zhejiang university. She is particularly interested in how to turn fuzzy architectural principles into corresponding mathematical models.
Jiamei Chen
Chen Jiamei is senior student of School of civil engineering and architecture, Zhejiang university, majoring in architecture. Her research interest is green building technology, landscape architecture, etc.
References
- Abbas, Z. F., and A. B. Sulaiman. 2010. “Dynamic Street Environment.” Justice and Sustainability 15 (5): 433–452.
- Akalin, A., K. Yildirim.,C. Wilson, and A. Saylan. 2010. “User’s Evaluation of House Facade: Preference, Complexity and Impressivenes[J]”. Open House International ,35(1), 57–65.
- Rossi, A. 1984. The Architecture of the city[M]. Cambridge, MA: MIT Press.
- Arabacioglu, B. C. 2010. “Using Fuzzy Inference System for Architectural Space Analysis.” Applied Soft Computing 10 (3): 926–937.
- Askari, A. H., K. B. Dola, and S. Soltani. 2014. “An Evaluation of the Elements and Characteristics of Historical Building Facades in the Context of Malaysia[J].” Urban Design International 19 (19): 113–124. doi:10.1057/udi.2013.18.
- Baker, J. M. 2018. American House Styles: A Concise Guide[M]. New York, NY:Courtryman Press.
- Banaei, M., A. Ahmadi, and A. Yazdanfar. 2017. “Application of Al Methods in the Clustering Of architecture interior forms[J].” Frontiers of Architectural Research, no. 6: 360–373. doi:10.1016/j.foar.2017.05.002.
- Bao, F., M. Schwarz, and P. Wonda. 2013. “Procedural Facade Variations from a Single layout[J].” ACM Transactions on Graphics 32 (1): 1–13.
- Behbahani, P. A., M.J.Ostwald,and G. Ning. 2016. “A Syntactical Comparative Analysis of the Spatial Properties of Prairie style and Victorian domesticarchitecture[J].” Journal of Architecture 21 (21): 348–374. doi:10.1080/13602365.2016.1179661.
- Bogdan, M., J. K. Ghosh, and R. W. Doerge. 2004. “Modifying the Schwarz Bayesian Information Criterion to Locate Multiple Interacting Quantitative Trait loci[J].” Genetics Society of America 167 (2): 989–999.
- Boussora, K. 2015. “Formal Style of Medersas Buildings in North Africa[J].” Nexus Network Journal 17 (17): 103–115. doi:10.1007/s00004-015-0236-x.
- Bridge, N. 2015. “Architecture 101: From Frank Gehry to Ziggurats, an Essential Guide to Building Styles and Materials[M].” Avon, MA: Adams Media.
- Brown, G., and R. Gifford. 2001. “Architects Predict Lay Evaluations of Large Contemporary Buildings: Whose Conceptual Properties?” Environmental Psychology 21 (1): 93–99. doi:10.1006/jevp.2000.0176.
- Calloway, S. H., K. A. Powers, and E. Cromley. 2012. The elements of style: an encyclopedia of domestic architectural detail. Richmond Hill,ON:Firefly Books.
- Canleaf, S. 2015. World Architecture Style Tour from Classic Temple to Modern Ferris Wheel [M]. Beijing: Machinery Press.
- Chen, C. 2016. CiteSpace: A Practical Guide for Mapping Scientific Literature[M]. Suite N Hauppauge,NY:Nova Science Pub Inc, UK ed..
- Cheng, C., and H. Li. 2018. “A Comparative Study of Chinese and Foreign Architectural Styles Based on EEG Technology[J].” Huazhong Architecture, 36(4): 39–42.
- Ching, F. D. K. 2014. Architecture: Form, Space, & Order[M]. New York: Wiley.
- Ching, F. D. K., M. M. Jarzombek, and V. Prakash. 2017. A Global History of architecture[M]. Hoboken, NY: Wiley.
- Chiu, T., D. Fang, J. Chen, Y. Wang, and C. Jeris. 2001. “A Robust and Scalable Clustering Algorithm for Mixed Type Attributes in Large Database environment[J].” Proceedings of the 7th ACM SIGKDD International Conference on Knowledge Discovery and Data Mining, 263–268, San Francisco.
- Claudia, Z., and T. Daniela. 2019. Baroque and Rococo Architecture [M]. Beijing: Beijing Art Photography Press.
- Coho, W. 2006. Architectural Style [M]. Shenyang: Liaoning Science and Technology Press.
- Cragoe, C. D. 2008. How to Read Buildings: A Crash Course in Architectural Styles. New York, NY: Rizzoli.
- Cubukcu, E., and I. Kahraman. 2008. “Hue, Saturation, Lightness, and Building Exterior Preference: An Empirical Study in Turkey Comparing Architects’ and Non Architects’ Evaluative and Cognitive judgments[J].” Color Research and Application 33 (5): 395–405. doi:10.1002/col.20436.
- Doersch, C., S. Singh, A. Gupta, J. Sivic, and A.A. Efros. 2012. “What Makers Paris Look paris?[J].” ACM Transactions on Graphics 31 (4): 1–9.doi:10.1145/2185520.2185597.
- Duarte, J. P. 2005. “Towards the Mass Customization of Housing: The Grammar of Siza’shouses at Malagueira[J].” Environment and Planning. B, Planning & Design 32 (3): 347–380. doi:10.1068/b31124.
- Edwards, A. T. 2016. Style and Composition in Architecture - an Exposition of the Canon of Number Punctuation and Inflection[M]. Jersey City, NJ:Forbes Press.
- Fan, L., P. Musialski, L. Liu, and P. Wonka. 2014. “Structure Completion for Facade layouts[J].” ACM Transactions on Graphics 33 (6): 1–11.
- Fernie, E. 2014. Romanesque Architecture: The first Style of the European age[M]. New Haven, CT: Yale university press.
- Fletcher, B. 2018. A History of Architecture on the Comparative Method: For the Student, Craftsman, and Amateur[M]. Seattle, WA: CreateSpace Independent Publishing Platform.
- Frampton, K., and J. Cava. 2001. Studies in Tectonic Culture: The Poetics of Construction in Nineteenth and Twentieth century[M]. Cambridge, MA: MIT Press.
- Gao, F. 2009. Functionalist Architecture [M]. Tianjin: Tianjin University Press.
- Jeong,J.S., García-Moruno L, Hernández-Blanco, J.2013.A site planning approach for rural buildings into a landscape using a spatial multi-criteria decision analysis methodology [J].Land Use Policy, 2013,32:108-118.
- Giedion, S. 2009. Space, Time and Architecture: The Growth of a New Tradition, Fifth Revised and Enlarged Edition[M]. Cambridge, MA: Harvard University Press.
- Glancey, J. 2017. Architecture: A Visual History[M]. London:DK.
- Guangzhou Tangyi Culture Communication Co., Ltd. 2013. Fusion and Innovation of Styles 1. Wuhan: Huazhong University of Science and Technology Press.
- Han, S. 2018. Research on Evaluation Method of Similarity of Product morphology[D]. Lanzhou: Lanzhou Univeristy of Technology.
- Hansen, L. 2017. Culture and Architecture: An Integrated history[M]. San Diego, CA:Cognella academic publishing.
- Harris, C. M. 1983. Illustrated Dictionary of Historic architecture[M]. Mineola, NY: Dover Publications.
- Hillenbrand, R. 2004. Islamic Architecture: Form, Function, and Meaning[M]. New York: Columbia University Press.
- Hiroyuki, S. 2013. Illustrated Western Architectural Style chronology[M]. Beijing:Tsinghua University Press.
- Hopkins, O. 2014. Architectural Style: A Visual guide[M]. London: Laurence king publishing.
- Hsiao, S., and H. Tsai. 2005. “Applying a Hybrid Approach Based on Fuzzy Neural Network and Genetic Algorithm to Product Form design[J].” International Journal of Industrial Ergonomics 35 (5): 411–428. doi:10.1016/j.ergon.2004.10.007.
- Imamoglu, Ç. 2000. “Complexity, Preference and Familiarity: Architecture and Non-architecture Turkish Students’ Assessments of Traditional and Modern House façades[J].” Journal of Environmental Psychology, 20(1): 5–16.
- Jacoby, S. 2015. “Typal and Typological Reasoning: A Diagrammatic Practice of architecture[J].” The Journal of Architecture, 20(6): 938–961.
- Kanleaf, S. 2015. World Architectural Style Roaming from Classic Temples to Modern skyscrapers[M]. Beijing: Mechanical Industry Press.
- Kerier, R. 2016. Town space[M]. Nanjing: Jiangsu Science and Technology Press.
- Lee, J. H., M. J. Ostwald, and N. A. Gu. 2017. “Combined Plan Graph and Massing Grammar Approach to Frank Lloyd Wright’s Prairie Architecture[J].” Nexus Network Journal 19 (19): 279–299. doi:10.1007/s00004-017-0333-0.
- Li, A. 2011. “Computing Style[J].” Nexus Network Journal 13 (13): 183–193. doi:10.1007/s00004-011-0053-9.
- Lorenz, W. E. 2014. “Measurability of Loos’ Rejection of the Ornament Using Box-counting as a Method for Analysing facades//[C].” 32nd International Conference on Education and Research in Computer Aided Architectural Design in Europe (eCAADe) Place: Northumbria Univ, Fac Engn & Environm, Dept Architecture & Built Environm, Newcastle upon Tyne, ENGLAND, September 10-12. sponsor: Autodesk; Bentley; Northumbria Univ FUSION: DATA INTEGRATION AT ITS BEST, VOL 1 page: 495-504 year: 2014
- Lowe, C., and F. Koetter. 1984. Collage city[M]. Cambridge, MA: MIT Press.
- Nasar, J. L., A. E. Stamps III, and K. Hanyu. 2005. “Form and Function in Public buildings[J].” Environmental Psychology 25 (2): 159–165. doi:10.1016/j.jenvp.2005.03.004.
- Ostwald, M. J., and O. Ediz. 2015. “Measuring Form, Ornament and Materiality in Sinan’s Kilic¸ Ali Pasa Mosque: An Analysis Using Fractal Dimensions[J].” Nexus Network Journal 17 (1): 1, 5–22.
- Pal, P., A. M. Tigga, and A. Kumar. 2005. “Feature Extraction from Large CAD Databases Using Genetic algorithm[J].” Computer-aided Design 37 (5): 545–558. doi:10.1016/j.cad.2004.08.002.
- Poppeliers, J. C., and S. A. Chambers. 2003. What Style Is It?: A Guide to American Architecture. Revised ed., Vol. 6. Hoboken, NJ: Wiley. October.
- Qian, Z. 2005. History of World Architectural Style. Shanghai: Shanghai Jiaotong University Press.
- Rasmussen. 2008. Experiential Architecture [M]. Beijing: Intellectual Property Press.
- Rossi, A. 1984. The Architecture of the city[M]. Cambridge, MA: MIT Press.
- Roth, L. M., and A. C. Roth Clark. 2013. Understanding Architecture: Its Elements, History, and meaning[M]. Boulder, CO:Westview Press.
- Samper, A., and B.Herrera. 2016. “A Study of the Roughness of Gothic Rose Windows[J].” Nexus Network Journal 18 (18): 397–417. doi: 10.1007/s00004-015-0264-6.
- Semper, G., H. Mallgrave, and M. Robinson. 2004. Style in the Technical and Tectonic arts[M]. Los Angeles, LA:Getty Research Institute.
- Seshagiri, S., and H. K. Khalil. 2000. “Output Feedback Control of Nonlinear Systems Using RBF Neutral networks[J].” Ieee Transactions on Neural Networks 11 (1): 69–79. doi:10.1109/72.822511.
- Stiny, G. 1980. Pictorial and Formal Aspect of Shape and Shape grammars[M]. Basel: Birkhauser.
- Sunil, V. B., and S. S. Pande. 2008. “Automatic Recognition of Features from Free Form Surface CAD models[J].” Computer-aided Design 40 (4): 502–517. doi:10.1016/j.cad.2008.01.006.
- Tian, Y. 2014. Urban Morphology, Typology of Buildings and Cities in Transition [M]. Beijing: Science Press.
- Vaughan, J., and M. J. Ostwald. 2014. “Measuring the Significance of Facade Transparency in Australian Regionalist Architecture: A Computational Analysis of 10 Designs by Glenn Murcutt[J].” Architectural Science Review 57 (4): 249–259. doi:10.1080/00038628.2014.940273.
- Wang, R. 2018. History of World Architecture [M]. Beijing: China Construction Industry Press.
- White, E. T. 1975. Concept Source Book: A Vocabulary of Architectural Forms[M]. Tucson, Ariz, USA: Architectural Media.
- Wu, J. 2011. Research on Stylization of Collective Residence&Related Structural Application[D]. Beijing: Tsinghua University.
- Xu, X., H. Chen, T. Gu, A. Chen, and H. Liu. 2011. “Rational Method for the Orientation of Urban Architectural style[J]”. Journal of Hefei University of Technology 34(2): 282–285.
- Xu, Y., and J. Yan. 2006. “Thoughts on the Crisis of Chinese Urban Characteristics in the Perspective of Globalization [J].” Urban Issues, 130: 12–15.
- Xu, Z., D. Tao, Y. Zhang, J.J. Wu, and A.C. Tsoi. 2014. “Architectural Style Classification Using Multinomial Latent Logistic Regression[C].” In Computer Vision–ECCV 2014, edited by David Fleet, Tomas Pajdla, Bernt Schiele and Tinne Tuytelaars, 600–615. Berlin and Heidelberg: Springer.
- Xue, E. 2019. Deconstruction and Dynamic Composition: Architectural Modeling and Exploration of Space [M]. Beijing: China Construction Industry Press.
- Xue, W., and H. G. Chen. 2019. SPSS Modeler: Methods and Applications of Data mining[M]. Beijing: Publishing House of Electronics Industry.
- Yang, F. 2012. Breakthrough Style and Reproduction——Super High Level, High Level [M]. Nanjing: Jiangsu People’s Publishing House.
- Yu, K., Y. Cai, H. Xiaodong, and H.R. Guo. 2019. “Recognition Algorithms of Architectural Style Image Classification of the university[J]”. Journal of Fujian Computer 35(5): 8–11.
- Zhao, N., D. Ge, and C. Hua. 2009. “Application and Exploration of Quantitative Analysis Methods for Determining the Architecture styles[J].” Journal of Zhejiang University(Science Edition) 36 (1): 109–115. doi:10.1631/jzus.A0820397.