
 ?Mathematical formulae have been encoded as MathML and are displayed in this HTML version using MathJax in order to improve their display. Uncheck the box to turn MathJax off. This feature requires Javascript. Click on a formula to zoom.
ABSTRACT
The aim of this paper was to present the fracture criteria of the SRC columns based on the nonlinear analytical model. This study explored the flexural behavior of the SRC columns confined by the cross-shaped flange sections encased in the structural concrete which are subjected to the flexural loads and the axial loads with 40% of the axial loads relative to the nominal axial load capacity. The confinements of the concrete columns in the compression zone provided by both the transverse reinforcements and the cross-shaped wide steels were evaluated based on an analytical model under axial and lateral loads. The increased flexural strength of the SRC columns by the confined effects offered by steel cores was also calculated. The composite actions of the cross-shaped flange sections that interacted with concrete were found to increase the flexural strength from 20% to 55%, depending on the spacing of the hoop reinforcement of the columns, compared with when composite actions were not accounted. The flexural capacities were underestimated substantially as the axial loads increased when the confinement provided by steel section was not accounted.
Graphical Abstract
1. Introduction
1.1. Significance of the steel-concrete composite
The numerous experimental and analytical studies have been performed on the composite frames. Dundar et al. (Citation2008) performed an experimental investigation of the behavior of the reinforced concrete columns. They developed a theoretical procedure for the analysis of both short and slender reinforced and SRC columns of the arbitrarily shaped cross-sections subjected to a biaxial bending and axial load. The proposed procedure demonstrated good correlations with test results. An analytical model for predicting the axial capacity and the behavior of the concrete-encased steel-concrete stub columns was proposed by (Chen and Lin Citation2006), from which the numerous test data were available to verify the present study. However, their test specimens were not subjected to flexural loadings. Researchers (El-Tawil and Deierlein Citation1999) provided the valuable test data that were obtained with both axial and lateral loads. However, they did not investigate the SRC columns with the cross-shaped steel sections, which can be used at corner frames. Qi et al. (Citation2019) studied the flexural response in the strain hardening cementitious composites based on the proposed parametric model. In this study, the parameter of the transition strain, post-cracking tensile stiffness, and strain softening stiffness were found to have the significant influence on the moment-curvature response whereas the compressive parameters did not affect the moment-curvature responses and the flexural behavior. Li et al. (Citation2016) performed an experimental investigation to find the effects of the stirrup volume ratio, stirrup yield strength and concrete strength on the damage evolution of the stirrup-confined concrete, concluding that the strength and ductility of the concrete are improved by an appropriate arrangement of the stirrup confinement. These studies, however, did not explore the influence of the secondary confinement provided by the steel sections encased in the concrete columns on the flexural capacity of the SRC columns. The steel-concrete composite frames have been adopted in mid-to high-rise buildings and bridges. Heavy infrastructures, such as warehouses, were traditionally built with the precast concrete members. However, the weight of the precast concrete members can be substantial for the large loadings, requiring lifters that offset a great deal of the advantages provided by the precast technology. It is worth noting that the lifting and installation processes of the heavy precast members have a major impact on construction time and costs (Elliott Citation2016; Elliott and Jolly Citation2013), which are the drawbacks of the precast construction that requires the operation of cranes. This issue can be solved by using a lighter steel section encased in the structural concrete, which is suitable for replacing the large-scale conventional concrete structures, thus reducing the weight of the lifted precast members. The steel-concrete composite frames are associated with a rapid erection process, minimal crane time, and enhanced safety. The precast composite structures also provide the constructability and accessibility from an on-site steel construction.
1.2. Prediction of the nonlinear structural behavior of the SRC columns
The present study is Part I of the two studies devoted to development of the fracture criteria of the SRC columns based on the nonlinear analytical model. The Part II aimed to identify the structural gains of the SRC columns with the cross-, H- and T-shaped steel cores encased in the concrete when the concrete confinement provided by the steel cores is taken into consideration. Many analytical models were available with the only consideration of the confinement offered by the hoop reinforcement, not by the steel cores encased in the structural concrete. The study of Part I presented an analytical model of the composite actions of the cross-shaped flange sections encased in the structural concrete while accounting for the confinement provided by the steel cores when the axial loads are present. The confined area formed by the cross-shaped steel sections resulted in the largest area of the highly confined concrete, whereas the area provided by H-shaped steel sections had the smallest area. presents the measured material properties used to obtain the analytical prediction and the fracture surface of the concrete-encased SRC columns with the cross-shaped flange sections. The effects of three types of steel sections (cross-shaped wide steels, wide flange steels) on the concrete encasing them were compared. The present analytical model considered both the axial and lateral loads to evaluate the confinement effects of the steel cores with such shapes on the strength and ductility of the SRC columns. A strain compatibility-based analytical model for the concrete strain levels up to 0.01 was developed and verified with the test data from previous research. For the structural concrete encasing the cross-shaped wide flange steel, the area inside the confined cores was modeled as an equivalent confined region representing the highly confined and the partially confined regions. Entire confining region was represented by one confining factor and were idealized by the equivalent confining factor. The equivalent confining factors were subsequently correlated with the spacing of hoop rebars. The performance of the SRC columns was underestimated when the confinement provided by the steel core was not implemented. The analytical failure surfaces with the confining effects by the cross-shaped steel section were consistent with finite element analysis (FEA) results.
Table 1. Geometric properties of the SRC columns and tested material properties
2. Materials and methods
2.1. Constitutive models of the concrete confined by the cross-shaped wide flange steel sections
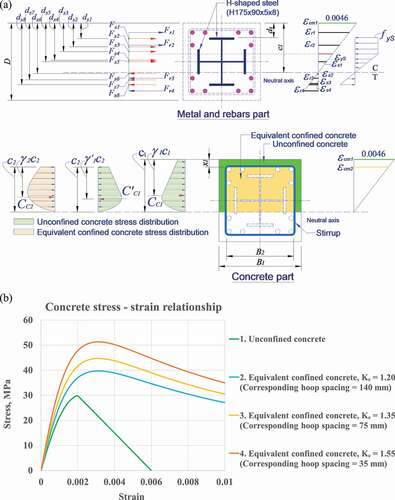
Researchers (Chen and Lin Citation2006) divided the confined regions into the following types: (1) a highly confined region inside the arching formed by the steel section, (2) a partially confined region outside the highly confined concrete region and inside the parabolic arching formed by the longitudinal bars, and (3) an unconfined region outside the parabolic arching formed by the longitudinal bars. (Chen and Lin Citation2006) shows the parabolic arching formed by the longitudinal bars and structural steel cores with the different shapes. The present study classified the confined regions into the two regions represented by the equivalent confining and unconfined regions outside the transverse stirrups, as illustrated in . In ), the strains, stresses, and corresponding force components for the column tested by (Chen and Lin Citation2006) are shown at the maximum load limit state. The equivalent confinement effect representing the confining and unconfined regions provided by cross-shaped steel cores with hoop spacing of 75 mm were evaluated based on 40% of the axial loads of nominal axial strength. ) shows the increased strength of the concrete as a result of the confinement effect provided by the steel cores encased in the structural concrete. The confined stress-strain relationships are illustrated based on the confined Mander curve for the concrete obtained by the equivalent confining factors (Mander, Priestley, and Park Citation1988). The present study demonstrates the concrete strengths in EquationEquation (1)(1)
(1) and ), where Ke is defined as the equivalent confinement factor accounting for the confining effects offered by the steel cores, in which the highly confined and partially confined regions shown in ) are idealized in a combinative way:
Figure 1. Increased concrete strength at the maximum load limit state (cross-shaped steel cores). (a) Strains, stresses, and corresponding force components for the column with 40% of axial load column capacity tested by (Chen and Lin Citation2006) at the maximum limit state; confinement was provided by cross-shaped steel cores with a hoop spacing of 75 mm. (b) Confined stress–strain relationships for the concrete represented by the equivalent confining factors (based on the confined Mander approach)
Ke was determined by trial method. The different Ke values were tried until the calculated results matched the test results. In almost cases, Ke values were between Kp (partially confined factor) and Kh (highly confined factor) (Kp ≤ Ke ≤ Kh).
2.2. Local buckling of the longitudinal bars and structural steel
Bayrak and Sheikh (Citation2001) proposed a constitutive model for the longitudinal reinforcing rebars in the compression zone. In this model, the load-carrying capacity and inelastic buckling of the longitudinal rebars under the compression were observed experimentally. The stress of the rebars began to degrade when the axial strain of the concrete (rebars) reached εco, which corresponds to the peak compressive stress, fco, of the unconfined concrete. This degradation was followed by the rebars buckling, which led to losing their strength when the spalling of the concrete occurred, thus reaching the peak strength. The stress of the rebars decreased to 20% of their yield strength when the axial strain reached a value of four times εco, after which it remained constant. The structural steel section showed a stress–strain relationship similar to that for the longitudinal rebars. The stress degradation was assumed to occur after the axial strain reached εcc,p, representing crushing of the partially confined concrete. The local buckling of the flanges of the structural steel section was assumed to occur at the moment the partially confined concrete reached the crushing strength. The post-peak strength of the steel sections decreased to 20% of their yield strength when the axial strain reached four times εcc,p. The local buckling of the longitudinal rebars and steel cores occurred after the crushing of the partially confined concrete. For the longitudinal reinforcing steels and steel sections, an elasto-plastic constitutive relationship was used to model composite members subjected to a flexural bending moment in the tension zone.
2.3. Formulation of the equations accounting for the confining effects generated by the cross- shaped wide steel flanges
The neutral axes satisfying the equilibrium of the steel-concrete section based on two simplified zones with the concrete stress-strain profiles at the maximum load and ultimate load limit state were formulated based on a strain compatibility, as shown in EquationEquations (12)(12)
(12) and (Equation13
(13)
(13) ). ) shows the neutral axes, which vary according to the lateral loads exerted on the structure. The entire section was explored to locate the neutral axes and establish the strains for all structural components of the steel-concrete section. Additional notation and dimensions shown in the equation are listed in the Appendix. The maximum limit state was defined by the nominal flexural strength of the maximum load, whereas the substantial contribution of the concrete was lost at the ultimate load limit state.
2.4. At the maximum and ultimate load limit state
In this section, the equations calculating the neutral axis at the maximum limit were derived based on a strain-compatibility, with 40% of the axial loads relative to the nominal axial load capacity that was assumed to be exerted on the SRC columns. For the concrete compressive forces based on the Mander curves, the unconfined concrete zone (the green regions in ) and EquationEquations (2)(2)
(2) and (Equation3
(3)
(3) )) and equivalent confined concrete zone (the orange region in ) and EquationEquation (4)
(4)
(4) ) were calculated; c1 is shown in ) and is the neutral axis of the section at the maximum load limit state. The depth of the compressive concrete block is indicated by c2 ()), which represents the equivalent zone confined by the steel section. In ), the compressive forces, Cc1 and C’c1, are shown as the green region for the unconfined concrete based on the Mander curve. The compressive force Cc2 is shown by the orange region for the equivalent confined concrete based on the Mander curves:
The depth of each compressive concrete block was obtained from the neutral axis, in EquationEquation (5)
(5)
(5) :
These equations are based on the Mander confining curve. The mean stress factors (α) and centroid factors (were derived from EquationEquations (6)
(6)
(6) through (Equation8
(8)
(8) ) and (Equation9
(9)
(9) ) through (Equation11
(11)
(11) ), respectively. The mean stress factors (α) for the two zones were obtained by the following (Nguyen and Hong Citation2020):
The centroid factors are given as follows:
The equilibrium equations are given in EquationEquations (12)(12)
(12) and (Equation13
(13)
(13) ), where the neutral axis,
can be calculated:
or
The internal forces contributed by the structural components of the section are shown as follows at a maximum load limit state with 40% axial load column capacity:
Where,
EquationEquation (13)(13)
(13) can be rewritten as below,
The nominal moment strength at the maximum load limit state was then obtained using EquationEquations (20)(20)
(20) –(Equation28
(28)
(28) ):
The flexural moment capacities provided by the structural components, with respect to the centroid, are shown as follows:
The EquationEquation (21)(21)
(21) can be expressed as follows,
Where,
EquationEquation (22)(22)
(22) can be rewritten as below,
EquationEquation (20)(20)
(20) can be rewritten as below,
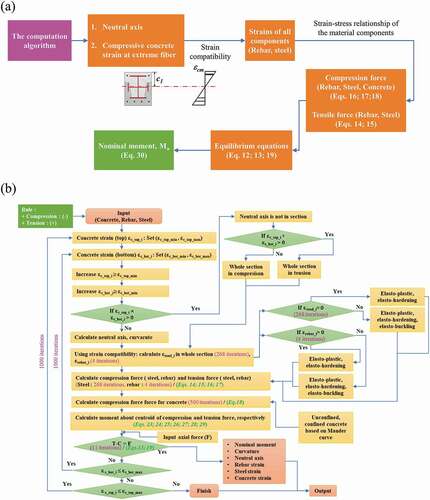
The process of how to get nominal moment of the steel-concrete section was shown in ). In this flowchart, the computation algorithm provided the neutral axis and the compressive concrete strain for these EquationEquations (2)(2)
(2) –(Equation30
(30)
(30) ) above. The computation algorithm used to calculate the neutral axis and the corresponding nominal moment capacity of a steel-concrete composite section with axial loads for entire stress state shown in ). In this algorithm, entire sections from the top to the bottom were automatically investigated to locate the neutral axis of the section, based on the global and sub-iterations of more than 1 billion. The internal loads exerted from the rebars and steel sections were calculated for a given section and the material properties used to design the steel-concrete sections.
Figure 2. Flowchart used to calculate nominal flexural moment capacity. (a) Process of finding nominal moment of the steel-concrete section. (b) Computing algorithm and analytical equations used to calculate nominal flexural moment capacity (Nguyen and Hong Citation2020)
3. Results and discussion
3.1. Verification analysis; study of Chen and Lin with the cross-shaped steel sections and axial loads
Researchers (Chen and Lin Citation2006) tested the concrete-encased steel columns with the cross-shaped steel sections, as can be seen in , where specimens SRC4 (29.8 MPa), SRC5 (29.8 MPa), and SRC6 (29.5 MPa) had concrete with the hoop spacings of 140 mm, 75 mm, and 35 mm, respectively. In the axial load-strain relationships shown in , the tested axial load-concrete strain relationships with a hoop spacing of 140 mm (SRC4) were well correlated with the analytical data presented by (Chen and Lin Citation2006), which are shown in the curve by Legend 2 (SRC4). The axial load-strain relationship analytically proposed in the present study with a hoop spacing of 140 mm (see the curve by Legend 3) also agreed well with the test data (refer to Legend 2 of SRC4) by (Chen and Lin Citation2006). Good correlations were also exhibited by comparing the axial load-strain relationships analytically proposed by (Chen and Lin Citation2006) (see curves by Legends 4 and 6 for columns with a hoop spacing of 75 mm (SRC5) and 35 mm (SRC6), respectively) with those proposed in the present study (see curves by Legends 5 and 7)
Figure 3. Composite concrete column encasing steel sections with cross- shape (Chen and Lin Citation2006)
Figure 4. Verification analysis with cross-shaped steels; axial load-strain relationships for concrete with a hoop spacing of 140 mm (SRC4, 29.8 MPa), 75 mm (SRC5, 29.8 MPa), and 35 mm (SRC6, 29.5 MPa) (Chen and Lin Citation2006)
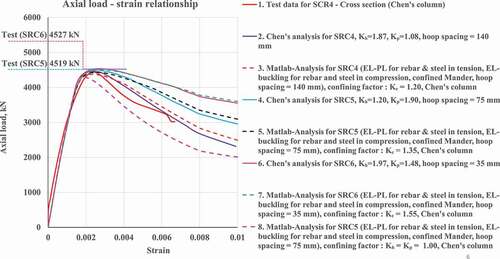
(Chen and Lin Citation2006) stated that the confining effect was enhanced by the structural steel, indicating that the confinement factor Kh for the highly confined concrete and the confining stress on the core concrete were influenced by the shape of the structural steel section. In the present study, the confining effects of the cross-shaped steel sections were identified by the equivalent confining factors of 1.55 (35 mm), 1.35 (75 mm), and 1.2 (140 mm), as shown in . The present analytical model based on the equivalent confining effects predicted both the pre-peak and post-peak behavior, in which the degrading model for the longitudinal bars and structural steel were well established. A substantial discrepancy was demonstrated by the axial load-strain relationship shown in the curve by Legend 8, in which no confining effect by the cross-shaped steel section was considered. The equivalent confining factors of 1.2, 1.35, and 1.55 for the confinement provided by the cross-shaped steel section were greater than those obtained for the confinement provided by the H-shaped steel section (1.105, 1.23, and 1.50) (Nguyen and Hong Citation2020). The fracture criteria with an equivalent confining factor accounting for the confinement provided by the cross-shaped steel section was greater than that based on the confining factor provided by the H-shaped wide flange steel sections.
3.2. Failure criteria based on a three-dimensional P-M interaction diagram
3.2.1. Equivalent confining factors
The failure surfaces of the moments interacting with the axial forces obtained for the columns considering the confinement offered by the cross-shaped flange sections were proposed based on the analytical model. The failure surfaces were compared with those of the H-shaped wide flange sections, with the higher equivalent confining factors (Ke) found for the sections with the cross-shaped flange sections. For a hoop spacing of 35 mm, 75 mm, and 140 mm in the column proposed by Chen and Lin, the equivalent confining factors (Ke) of 1.55 (29.5 MPa), 1.35 (29.8 MPa), and 1.20 (29.8 MPa) for the confinement provided by the cross-shaped steel sections were greater than the equivalent confining factors of 1.50 (29.8 MPa), 1.23 (28.1 MPa), and 1.105 (29.5MPa) provided by the H-shaped wide flange steel sections, respectively, for all concrete strains between 0.001 and 0.01. The steel shapes confining concrete play important roles in increasing the flexural strength of the SRC columns.
3.2.2. P-M interaction diagram based on the double confinement
The SRC columns encased with cross-shaped steel have been investigated by other scholars in recent years. Their studies include the columns subjected to the compressive load only (Chen and Lin Citation2006; Chen and Wu Citation2017) or the columns subjected to the bending-compressive load (El-Tawil and Deierlein Citation1999; Dundar et al. Citation2008; Mirza and Lacroix Citation2004). However, in these papers, the steel-concrete column at the design load limit state (compressive concrete strain at the extreme fiber εc = 0.003) was explored only.
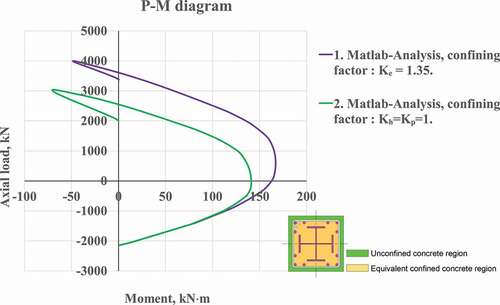
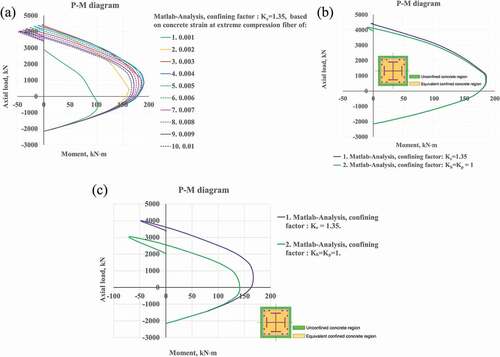
In the present research, the SRC columns encased with cross-shaped steel were subjected to bending-compressive load at all stages of compressive concrete strain (εc = 0 ~ 0.01). P-M diagrams of the steel-concrete column with a hoop spacing of 75 mm were shown in ) for the concrete strain between 0.001 and 0.01. It is important to investigate the capacity of the steel-concrete column at the ultimate load limit state (εc = 0.01) in the seismic region. In ), the influence of the double confinements (provided by both transverse reinforcements and a cross-shaped wide flange steel section in the compression zone) on an axial force-moment (P-M) interaction diagram of the steel-concrete column (SRC5) with 29.8 MPa and hoop spacing of 75 mm (see ) was compared with that of the columns considering the confinements provided by the transverse reinforcements only. The elasto-plastic property was used for the rebars and steel sections, whereas the elasto-buckling property was implemented in the rebars in the compression region. The P-M interaction diagrams calculated with the concrete strains between 0.001 and 0.01 are illustrated in ), based on the equivalent confining factor (Ke = 1.35) representing increased strength of the SRC columns as a result of the confining effect provided by the cross-shaped steel sections. In this study, the fractures of the SRC columns encasing the cross-shaped steel sections were defined at the strain level of 0.01 as the ultimate limit state. The performance limit of the SRC columns was evaluated at this limit state. The selected P-M interaction diagrams at the strains between 0.001 and 0.01 are shown in ) The concrete for the design reached a strain of 0.003 in the axial force and moment (P-M) interaction diagram (refer to )). At the ultimate limit state, the concrete reached a strain of 0.01 shown in the axial force and moment (P-M) interaction diagram shown in ). For the greater strains, the P-M diagrams (refer to ) of the SRC5 column) increased rapidly as the axial loads increased when the confinement provided by the cross-shaped steel flanges was considered compared with those not considering confinement provided by the cross-shaped steel flanges.
Figure 5. P-M diagrams for the strain evolutions (equivalent confining factors) with a hoop spacing of 75 mm, EL-PL for the rebar and steel (except EL-buckling for rebar in compression); the columns with a compressive strength of 29.8 MPa were tested by (Chen and Lin Citation2006) (SRC5). (a) P-M diagrams for the concrete with a hoop spacing of 75 mm for the concrete strains between 0.001 and 0.01. (b) Concrete strain of 0.003. (c) Concrete strain of 0.01
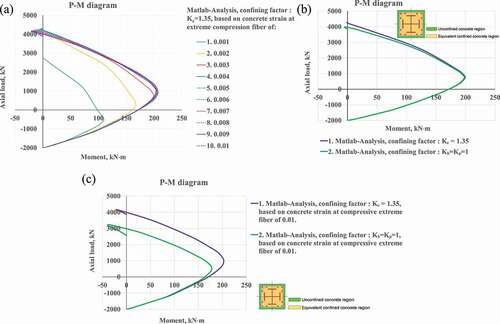
compares the influence of the double confinements in the compression zone on the axial force-moment (P-M) interaction diagram of the steel-concrete column (SRC5) with those considering confinements provided by transverse reinforcements when the buckling of rebars was not implemented. The selected P-M interaction diagrams at strains between 0.001 and 0.01 are shown in ). The concrete for design reached a strain of 0.003 in the axial force and moment (P-M) interaction diagram (refer to )). The axial force and moment (P-M) interaction diagram shown in ) was plotted at the ultimate load limit state with the concrete strain of 0.01. At smaller concrete strains, the interaction diagram with double confinements was similar to those obtained with only transverse reinforcements, whereas the interaction diagram with double confinement was becoming larger than those with single confinement at larger concrete strains, regardless of the buckling of rebars, as shown in ). However, in ), the interaction diagrams not considering the buckling of rebars were greater with the larger concrete strains than those obtained by considering the buckling of rebars. Flexural capacities at the maximum load and design load limit states (εc = 0.003) with 60% axial load column capacity are presented in .
Table 2. Flexural capacities of the columns tested by (Chen and Lin Citation2006) at the maximum and design load limit states (εc = 0.003) with a 60% axial load column capacity, Ke; 1.20 (140 mm, 29.8 MPa); 1.35 (75 mm, 29.8 MPa), and 1.55 (35 mm, 29.5 MPa)
Figure 6. P-M diagrams for the strain evolution (equivalent confining factors) with a hoop spacing of 75 mm (SRC5), EL-PL for both rebar and steel; columns with a compressive strength of 29.8 MPa, Chen and Lin’s column (SRC5) (Chen and Lin Citation2006). (a) P-M diagrams for concrete with a hoop spacing of 75 mm for the concrete strain between 0.001 and 0.01. (b) Concrete strain of 0.003. (c) Concrete strain of 0.01
3.2.3. Three-dimensional P-M diagrams and fracture criteria
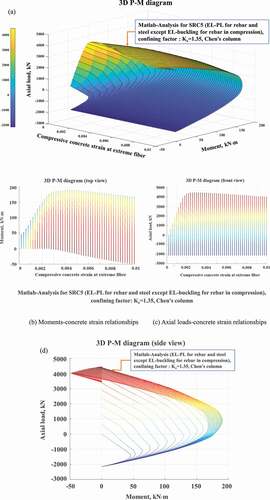
In , the three-dimensional P-M diagrams are presented with the three axes representing the axial force, moment, and the compressive concrete strains at the extreme fibers between 0.001 and 0.01. The elasto-plastic constitutive relationships for the rebars and the cross-shaped flange sections in the compression and tension zones were used, except for the rebars in the compression, for which the elasto-bucking relationship proposed by Bayrak and Sheikh (Citation2001) was implemented. The material properties and geometry shown in were used to obtain the failure surfaces. The confining effects (based on Ke = 1.35) provided by both the hoop reinforcements with a spacing of 75 mm and the cross-shaped wide flange sections were considered in the three-dimensional P-M diagrams. In ), the moments and axial loads relative to the concrete strains are illustrated, along with the evolution of the failure surfaces for the strains between 0.001 and 0.01, respectively. In ), the three-dimensional evolutions of the axial loads interacted with the moments including the confining effects (based on Ke = 1.35) are illustrated for the design of the SRC columns. The flexural capacity and the axial loads of the SRC columns can be also predicted at the ultimate limit state. The current design practices have ignored the confining effects (based on Ke = 1.35) provided by both the hoop reinforcements and the core steel sections.
Figure 7. Three-dimensional fracture surface of SRC5 (rebars with elasto-bucking). (a) Three-dimensional P-M diagrams (surface view). (d) Three-dimensional P-M diagrams (axial load vs. moment)
3.2.4. P-M diagrams with confining effects by steel section
The elasto-buckling constitutive relationship for the rebar and steel sections in the compression zone and the elasto-plastic rebars and steel sections in the tension zone was considered in the model developed in this study. The concrete was modeled based on the confined Mander constitutive equations, whereas the unconfined constitutive curve was used to represent concrete outside the hoop rebars when accounting for the confinement provided by the steel flange. The P-M diagrams in the range of concrete strains larger than 0.003 can be used for a performance-based design. The confinement of the steel section should be included for the accurate prediction of moment-curvature relationships of the SRC columns at the maximum and ultimate limit states. Based on this study, it is recommended that the flexural strengths and performance of the SRC columns at the ultimate limit state be estimated with the confinements offered by steel sections encased in concrete which have been ignored in the current design practices.
3.2.5. Confining effect provided by the buckled reinforcements
The flexural strengths at the large strain levels were significantly underestimated without implementing the confining factors when the axial forces and buckling of the rebars were present. For the highly axially loaded columns, substantial discrepancies were exhibited for the concrete strains ranging between 0.003 and 0.01 when the confining effects provided by the wide steel flange were not considered, leading to an underestimation of the performance of the SRC columns, especially for the large axial loads.
4. Conclusions
To date, the investigations of the confinement effects associated with the steel sections of the SRC columns have not received an appropriate attention. An analytical model for predicting the nonlinear structural behavior of the steel-concrete SRC columns was presented to predict the performance-based flexural strength of the SRC columns including predicting the moment-curvature relationships, considering the confining effects by the core steel sections.
This study does not claim that primary contribution of the cross-shaped steel sections to the SRC columns and their designs is to provide confining effect on the steel-concrete column. This study agrees that the primary goal of the steel sections encased in the structural concrete is to offer stiffness to the column. This paper aimed to demonstrate the hidden role of the steel sections encased in the concrete sections by exploring the additional confining effects (Kh, Kp) provided by the core steel sections. The flexural capacity of the SRC columns confined by the cross-shaped flange sections encased in the structural concrete is underestimated as the axial loads increase when the confinement provided by steel section is not accounted for. Finally, the formulas of flexural capacity which can contribute to the engineering design and practice were provided (Hong Citation2019).
The analytical models to account for the confining effects provided by the transverse reinforcing steels and steel sections with the cross shape subjected to both the axial and lateral loads provided results which were well compared with the results obtained by the experimental investigations of the (Chen and Lin Citation2006).
The analytical equations were derived considering the concrete columns confined by the cross-shaped flange sections, accurately predicting the post-yield structural behavior of the SRC columns when the SRC columns are subjected to the flexural loads and the axial loads with 40% of the axial loads relative to the nominal axial load capacity. In this study, it was found that the confining effects of the steel sections should not be ignored in the estimations of the post-yield structural behavior for the strains larger than 0.003 when the axial loads are applied. An underestimation of the performance-based capacity of the concrete sections might be caused when the confinements offered by the core steel sections encased in the structural concrete are ignored at the ultimate limit state, leading to too much conservative estimation.
Nomenclature
Ari = area of the rebar layer i (i=1–4), mm2
Asi = area of part i of the H-steel section, mm2
B = width of the concrete section, mm
Bi = width of the unconfined, equivalent confined concrete area (i =1,2), mm
ci = height of the concrete compression zone of the unconfined, equivalent confined concrete area (i =1,2), mm
Cci = compressive force given by the unconfined, equivalent confined concrete area (i=1,2), kN
C’c1 = compressive force given by the equivalent confined concrete area inside, kN
D = height of the concrete section, mm
di = distance from the rebar layer i (i=1–4) to the top of the concrete section, mm
dc = distance from centroid to the top of the concrete section, mm
ds = distance from top flange of the H-steel to the top of the concrete section, mm
dsi = distance from the force given by the part i of the H-steel to the top of the concrete section, mm
Es = Young’s modulus of steel, MPa
Er = Young’s modulus of rebar, MPa
Fri = force given by the rebar layer i (i=1–4), kN
Fsi = force given by part i of the H-steel section (i=1–8), kN
εcmi = strain at the fiber of the unconfined, equivalent confined concrete area (i =1,2)
εyR = yield strain of rebar
εyS = yield strain of steel
εri = strain of the rebar layer i (i=1–4)
εsi = strain respect to part i of the H-steel section.
fyR = yield strength of rebar, MPa
fyS = yield strength of steel, MPa
f’c = compressive strength of the unconfined concrete, MPa
f’cc = compressive strength of the equivalent confined concrete, MPa
fc1 = concrete compressive stress in terms of the concrete strain of the unconfined area, MPa
fc2 = concrete compressive stress in terms of the concrete strain of the equivalent confined area, MPa
h1 = depth of the vertical H-steel section of the cross-shape steel section, mm
h2 = depth of the horizontal H-steel section of the cross-shape steel section, mm
Kh = confinement factors for highly confined concrete
Kp = confinement factors for partially confined concrete
Ke = confinement factors for equivalent confined concrete
tf11 = top flange thickness of the vertical H-steel section of the cross-shaped steel section, mm
tf12 = bottom flange thickness of the vertical H-steel section of the cross-shaped steel section, mm
tf21 = top flange thickness of the horizontal H-steel section of the cross-shaped steel section, mm
tf22 = bottom flange thickness of the horizontal H-steel section of the cross-shaped steel section, mm
tw1 = web thickness of the vertical H-steel section of the cross-shaped steel section, mm
tw2 = web thickness of the horizontal H-steel section of the cross-shaped steel section, mm
x1 = distance from the edge of the concrete equivalent confined areas to the top of the concrete section, mm
w1 = width of the vertical H-steel section of the cross-shaped steel section, mm
w2 = width of the horizontal H-steel section of the cross-shaped steel section, mm
αi = stress factors for the concrete areas i (i=1,2)
α’1 = stress factors for the concrete areas inside
= uniaxial tensile stress, MPa
γ i = centroid factor for the concrete areas i (i=1,2)
γ’ 1 = centroid factor for the concrete areas inside
Author contributions
Won-Kee Hong conceived the idea; Won-Kee Hong and Dinh Han Nguyen derived the equations; Won-Kee Hong wrote and prepared the original draft; Won-Kee Hong and Dinh Han Nguyen reviewed & edited the manuscript.
Acknowledgments
The above financial support is greatly appreciated.
Disclosure statement
No potential conflict of interest was reported by the authors.
Additional information
Funding
Notes on contributors
Dinh Han Nguyen
Dinh Han Nguyen is currently enrolled as a Ph.D. candidate in the Department of Architectural Engineering at Kyung Hee University, Republic of Korea. His research interest includes precast composites structures.
Won-Kee Hong
Dr. Won-Kee Hong is a Professor of Architectural Engineering at Kyung Hee University. Dr. Hong received his Master’s and Ph.D. degrees from UCLA, and he worked for Englelkirk and Hart, Inc. (USA), Nihhon Sekkei (Japan) and Samsung Engineering and Construction Company (Korea) before joining Kyung Hee University (Korea). He also has a professional engineering license from both Korea and the USA. Dr. Hong has more than 30 years of professional experience in the structural engineering. His research interests include a new approach to construction technologies based on value engineering with hybrid composite structures. He provided many useful solutions to issues in current structural design and construction technologies as a result of his research that combines the structural engineering with construction technologies. He is the author of numerous papers and patents both in Korea and the USA. Currently, Dr. Hong is developing new connections that can be used with various types of frames including hybrid steel–concrete precast composite frames, precast frames and steel frames. These connections would contribute to the modular construction of heavy plant structures and buildings as well. He recently published a book titled as “Hybrid Composite Precast Systems: Numerical Investigation to Construction” (Elsevier).
References
- Bayrak, O., and S. A. Sheikh. 2001. “Plastic Hinge Analysis.” Journal of Structural Engineering 127 (9): 1092–1100. doi:https://doi.org/10.1061/(ASCE)0733-9445(2001)127:9(1092).
- Chen, C. C., and N. J. Lin. 2006. “Analytical Model for Predicting Axial Capacity and Behavior of Concrete Encased Steel Composite Stub Columns.” Journal of Constructional Steel Research 62 (5): 424–433. doi:https://doi.org/10.1016/j.jcsr.2005.04.021.
- Chen, S., and P. Wu. 2017. “Analytical Model for Predicting Axial Compressive Behavior of Steel Reinforced Concrete Column.” Journal of Constructional Steel Research 128: 649–660. doi:https://doi.org/10.1016/j.jcsr.2016.10.001.
- Dundar, C., S. Tokgoz, A. K. Tanrikulu, and T. Baran. 2008. “Behaviour of Reinforced and Concrete-encased Composite Columns Subjected to Biaxial Bending and Axial Load.” Building and Environment 43 (6): 1109–1120. doi:https://doi.org/10.1016/j.buildenv.2007.02.010.
- Elliott, K. S. 2016. Precast Concrete Structures. Boca Raton: Crc Press.
- Elliott, K. S., and C. Jolly. 2013. Multi-story Precast Concrete Framed Structures. Hoboken: Wiley.
- El-Tawil, S., and G. G. Deierlein. 1999. “Strength and Ductility of Concrete Encased Composite Columns.” Journal of Structural Engineering 125 (9): 1009–1019. doi:https://doi.org/10.1061/(ASCE)0733-9445(1999)125:9(1009).
- Hong, W. K. 2019. “Hybrid Composite Precast Systems: Numerical Investigation to Construction”. Woodhead Publishing, Elsevier.
- Li, Z., Z. Peng, J. Teng, and Y. Wang. 2016. “Experimental Study of Damage Evolution in Circular Stirrup-Confined Concrete.” Materials 9 (4): 278. doi:https://doi.org/10.3390/ma9040278.
- Mander, J. B., M. J. N. Priestley, and R. Park. 1988. “Theoretical Stress–strain Model for Confined Concrete.” Journal of Structural Engineering 114 (8): 1804–1826. doi:https://doi.org/10.1061/(ASCE)0733-9445(1988)114:8(1804).
- Mirza, S. A., and E. A. Lacroix. 2004. “Comparative Strength Analyses of Concrete-encased Steel Composite Columns.” Journal of Structural Engineering 130 (12): 1941–1953. doi:https://doi.org/10.1061/(ASCE)0733-9445(2004)130:12(1941).
- Nguyen, D. H., and W. K. Hong. 2020. “An Analytical Model Computing the Flexural Strength and Performance of the Concrete Columns Confined by Both Transverse Reinforcements and Steel Sections.” Journal of Asian Architecture and Building Engineering. doi: https://doi.org/10.1080/13467581.2020.1775603
- Qi, Z., Z. Huang, H. Li, and W. Chen. 2019. “Study of Flexural Response in Strain Hardening Cementitious Composites Based on Proposed Parametric Model.” Materials 12 (1): 113. doi:https://doi.org/10.3390/ma12010113.