
 ?Mathematical formulae have been encoded as MathML and are displayed in this HTML version using MathJax in order to improve their display. Uncheck the box to turn MathJax off. This feature requires Javascript. Click on a formula to zoom.
ABSTRACT
Most of the design codes for the composite columns including American Concrete Institute do not account for the concrete confinements offered by the steel cores encased in the concrete section. However, the flexural capacities of the axially and laterally loaded composite columns were substantially underestimated as the axial load increases if the concrete confinement provided by a steel core is not considered. The aim of this study was to identify the structural gains of the composite columns with the cross-, H- and T-shaped steel cores encased in the concrete when the concrete confinement provided by the steel cores is taken into consideration. The formulation of the flexural strength considering the confining effects provided by the transverse reinforcements and cross-shaped steel cores for the maximum load limit state was presented with a 50% axial load of the nominal column capacity. The formulation for an ultimate load limit state with a 40% axial load of the nominal column capacity is listed in the Appendix. The design charts were presented for the strain ranges between 0.001 and 0.01, leading to gaining the strengths of the composite columns that have been lost when the confining effects provided by the steel cores were ignored.
1. Introduction
1.1. Previous research and objectives
A design strategy for the composite columns that reduces the likelihood of the collapse under the severe seismic conditions must allow the concrete to absorb as much energy as possible. A composite steel-concrete structure will help achieve the cost-effective construction due to its high stiffness and ductility, strong earthquake resistance, and savings in terms of the construction time (Ricles and Paboojian Citation1994; Griffis and Lawrence Citation1986; Chen, Astaneh-Asl, and Moehle Citation1992). Experimental investigations of the composite elements were performed by (Mirza and Skrabek Citation1992; Mirza, Hyttinen, and Hyttinen Citation1996; El-Tawil and Deierlein Citation1999; Dundar et al. Citation2008;; SSRC Citation1979). The analytical models of the concrete-encased steel composite elements have been developed by (Munoz and Hsu Citation1997; Furlong Citation1968; Kato Citation1996; Virdi and Dowling Citation1973; Roik and Bergmann Citation1990; Chen and Lin Citation2006). A performance-based design is receiving wide attention; however, only a few studies of the axial force and moment interactions that consider the concrete confinements provided by both the transverse reinforcements and steel cores has been performed. The consequently inaccurate results underestimated the flexural strength of the composite columns with the steel cores. According to Chen and Lin Citation2006; El-Tawil and Deierlein Citation1999, the presence of the large steel cores encased in the concrete columns provides an enhanced concrete confinement, leading to an increased strength and ductility. However, the study of the large steel cores and their contributions to the composite columns was limited, and few research results are available. The present study explored the underestimated flexural strengths when the steel cores contributing to confining concrete were neglected. For the composite columns, the nominal axial capacities were computed by summing all forces in the structural components, including reinforcing steel and steel cores encased in concrete. The nominal moment capacities were then calculated by summing the axial forces about the geometric centroid of the composite column sections. The interactions between the axial forces and moments for the concrete are based on a maximum compressive strain of 0.003, which corresponds to the compressive concrete failure. This study found the flexural strengths of the composite columns are not significantly influenced by the confining effect provided by the cross-shaped steel sections at a concrete strain of 0.003 or lower. The present study explored the influence of the concrete confined by cross-shaped steel cores on the flexural strength of the composite columns at the strains between 0.001 and 0.01, which led to identifying the strength gains of the composite columns when the steel cores were considered. (Chen and Lin Citation2006) presented an analytical model for predicting the axial capacity and the behavior of the concrete encasing H/cross-shaped steel cores. They performed the structural tests to validate their study but did not test the performance of the test specimens by the flexural loadings. The present study included the lateral loads to extend a study proposed by (Chen and Lin Citation2006). Valuable test data were also obtained by (El-Tawil and Deierlein Citation1999), who applied both the axial and lateral loads to the composite columns with the H-shaped steel cores. The present study included the cross-, H- and T-shaped steel cores with those proposed by (El-Tawil and Deierlein Citation1999). In this study, the strain distributions between 0.001 and 0.01, and the corresponding neutral axes, were used to analytically calculate the compression block and the stress of the structural components. The strength gains contributed by the confining effects of both the transverse reinforcements and steel cores at their ultimate limit state were discovered based on the axial force and moment interaction.
1.2. Significance for the prediction of the nonlinear structural behavior of the steel-concrete composite columns
At a maximum load limit state, the strength gains of the axially and laterally loaded composite columns based on the concrete confinements provided by the steel cores encased in the structural concrete were explored. The cores formed by the cross-shaped steel sections resulted in the largest area of the highly confined concrete, influencing the strength and ductility of the columns. The measured material properties used to obtain the fracture surfaces of the concrete-encased steel composite columns with the cross-, H- and T-shaped flange sections are presented in . The confinement effects of the steel cores loaded axially and laterally on the strength and ductility of the composite columns were evaluated up to a concrete strain of 0.01. The selected results were verified through the comparison with the test data of the prior researchers. The readers are referred to the authors’ previous studies (Nguyen and Hong Citation2020a) of the structural concrete confinements offered by the encased cross-shaped steel cores, in which the area inside the confined cores was idealized as equivalent to the confined region representing highly confined and partially confined regions proposed by (Chen and Lin Citation2006). The performance-based flexural strength ignoring the steel cores was underestimated. The spacing of hoops was also correlated with the confining effects.
Table 1. Geometrical properties of the composite columns and material properties (SRC5 and CL-TO)
2. Modeling of the concrete confinement offered by the steel cores
2.1. Material properties and boundary condition
The material properties of concrete, steel and rebar including hoops are shown in ). The boundary conditions and loads of the FEM model are indicated in ) which shows the combination between axial load with two cases (30% and 60% axial load column capacity) and the lateral load that applied on the column. However, the lateral load was controlled by the lateral displacement using loading protocol (Nzabonimpa and Hong Citation2019).
Figure 1. Strain compatibility based on equivalent confining factors
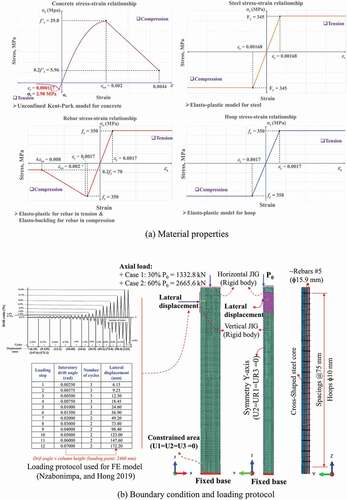
Figure 1. Continued
2.2. Idealization of the concrete confinement
In (Chen and Lin Citation2006), the confined regions were divided into (1) a highly confined region inside the arches formed by the steel section, (2) a partially confined region outside the highly confined concrete region and inside parabolic arches formed by the longitudinal bars, and (3) an unconfined region outside the parabolic arches formed by the longitudinal bars. (El-Tawil and Deierlein Citation1999) proposed parabolic arches formed by the longitudinal bars and structural steel cores with different shapes. However, the authors’ previous study divided the confined regions into the two regions including an equivalent confining region inside the transverse stirrups and an unconfined region outside the transverse stirrups. The columns with the hoop spacings of 75 mm were used with the application of the 50% of the nominal axial strength to determine an equivalent confinement effect representing the confined and unconfined regions provided by the cross-shaped steel cores. The confined equation proposed by Mander, Priestley, and Park Citation1988 for the concrete sections was obtained from the equivalent confining factors. EquationEquation 1(1)
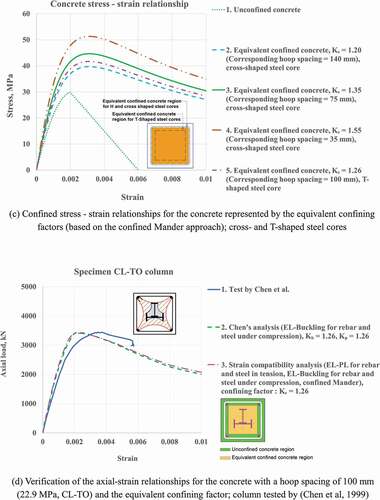
(1) is used to calculate the concrete strengths, for which the equivalent confinement factor (Ke, based on the highly confined and partially confined regions) accounts for the confining effects offered by the steel cores. ) shows the confined stress–strain relationships modified based on the equivalent confining factors when the concrete was confined by the cross-shaped (refer to Legends 2 to 5) and T-shaped (Legend 5) steel cores. The unconfined stress–strain relationship proposed by the Mander is represented by Legend 1. The stress–strain relationship of the T-shaped steel core (Legend 5) with Ke = 1.26 is slightly greater than that of the cross-shaped steel core (refer to Legend 2) with Ke = 1.2. The equivalent confining factor is defined in EquationEquation 1
(1)
(1) .
2.3. Local buckling of the longitudinal bars and structural steel
A constitutive model for the longitudinal reinforcing rebars in the compression zone was proposed by (Bayrak and Sheikh Citation2001), who observed the load-carrying capacity and inelastic buckling of the longitudinal rebars under compression. The longitudinal reinforcing steel and steel sections with an elasto-plastic constitutive relationship were used to model the composite members subjected to a flexural bending moment in the tension zone. The local buckling of the longitudinal rebars and steel cores was assumed to occur after the crushing of the partially confined concrete. ) illustrates the axial-strain relationships for the concrete (refer to columns tested by Chen et al. (Chen et al. Citation1999; Chen and Lin Citation2006)) with a hoop spacing of 100 mm (22.9 MPa) confined by the core steel with T-shaped steel sections (CL-TO) when the equivalent confining factor (Ke) is 1.26.
2.4. Formulation of the flexural strength (Mnd) considering the confining effects provided by both transverse reinforcements and steel cores
The equilibrium and neutral axes of the composite sections based on the two simplified zones with the concrete stress-strain profiles at the maximum load and ultimate load limit state were calculated based on EquationEquations 7(7)
(7) and Equation8
(8)
(8) . The entire composite section was explored to find the neutral axes and strains of all structural components consisting of the composite sections. The nominal flexural strength was defined as the maximum load limit state. The substantial concrete was lost at the ultimate load limit state.
2.5. Maximum load limit
The formulation of the flexural strength (Mnd) considering the confining effects provided by the transverse reinforcements and cross-shaped steel cores for the maximum load limit state with a 50% axial load of the nominal column capacity was presented. The formulation for an ultimate load limit state with a 40% axial load of the nominal column capacity is listed in the Appendix. The unconfined and equivalent confined concrete zones based on the constitutive equation developed by (Mander, Priestley, and Park Citation1988) were calculated using EquationEquations 2(2)
(2) , Equation3
(3)
(3) , and Equation4
(4)
(4) , where c1 is the neutral axis of the section at the maximum load limit state. The depth of the compressive concrete block (c2) represents the equivalent zone confined by the steel section. The compressive forces Cc1 & C’c1 were determined for the unconfined concrete, and the compressive force Cc2 was calculated for the equivalent confined concrete.
Relationships between the compressive concrete blocks and the neutral axes c1 and c2 are also established in EquationEquation 5(5)
(5) .
The compressive concrete block is then calculated by EquationEquation 6(6)
(6) .
The calculations of mean stress factors (α) for the two zones can be found in the previous paper of the authors (Nguyen and Hong Citation2020a).
The neutral axis (c1) was calculated from the equilibrium equations given in EquationEquations 7(7)
(7) and Equation8
(8)
(8) .
or
EquationEquations 9(9)
(9) to 12 were used to determine the internal force capacity, including the c10ontribution from the steel cores at a maximum load limit state with a 50% axial load of the nominal column capacity;
EquationEquation 13(13)
(13) is used to find the nominal moment strength at the maximum load limit state;
The flexural moment capacities provided by the structural components with respect to the centroid are shown in EquationEquations 14(14)
(14) to 20;
An algorithm was developed to calculate the neutral axis and the corresponding nominal moment capacity of the steel-concrete composite section with axial loads.
The entire section from the top to the bottom of the section was explored to locate the neutral axis and was used to calculate the internal loads exerted from the rebars and steel sections to design the composite sections.
3. Verification analysis
3.1. Verification with cross-shaped steel sections and axial loads
(Chen and Lin Citation2006) tested concrete-encased steel columns with cross-shaped steel sections. In ), the authors compared the axial load–strain relationships analytically proposed by (Chen and Lin Citation2006) with those presented by the study of the authors for the columns with the hoop spacings of 75 mm (SRC5; 29.8 MPa with a hoop of 75 mm) and 35 mm (SRC6; 29.5 MPa with a hoop of 35 mm). The confining effects provided by the cross-shaped steel cores were accounted for by equivalent confining factors of 1.55 (35 mm), 1.35 (75 mm) and 1.2 (140 mm), demonstrating a strong correlation with the results of (Chen and Lin Citation2006). The equivalent confining factors of 1.11, 1.23, and 1.50 for the confinement provided by the H-shaped steel sections (Nguyen and Hong Citation2020b) were smaller than those obtained for the confinement provided by the cross-shaped sections (1.2, 1.35, and 1.55).
3.2. A Three-dimensional finite element model for steel-concrete composite column
In most of the three-dimensional FE model, the three modelling techniques are available, and they are cohesive (tie), embedded model and bond-slip model (Nzabonimpa and Hong Citation2017; Delso et al. Citation2011; Hong Citation2019). A cohesive zone model-based cohesive contact is modeled with cohesive constitutive relations indicated by traction-separation law. The contact behavior was identified based on the interface stiffnesses, Knn, Kss, and Ktt, for the uncoupled traction-separation behavior (Nzabonimpa and Hong Citation2017) in which interfacial stiffness parameters are shown for the constant contact resisting strength. Both cohesive and tie model allowed the rotational degrees of freedom contributing to the release of the loads, whereas embedded model yielded greater loads because the rotational degrees of freedom between concrete and rebar, steel sections were not accounted. However, the SRC precast frames tested by the authors in their previous study showed that the bond-slip behavior was not obvious. Hong (Citation2019) showed that the load–displacement relationships are better predicted by the embedded model than by cohesive (tie) and bond-slip models for frames, when neither bond slippage nor rotation takes place between steel section and concrete.
In the finite element model, a tie-modeling approach was introduced to predict the structural behavior of the proposed mechanical joints. Reinforcing bars and cross-shaped steels were tied to the concrete surface using the tie-contact approach (Structural Stability Research Council (SSRC) Task Group 20 Citation1979). The surfaces of the cross-shaped steels and reinforcing bars were defined as a master surface, and the concrete surface was defined as a slave surface. The assigned tie-constraint method fuses these two surfaces together to eliminate the relative motion between them. The tie approach can be used to model the steel beams encased in the concrete members under the seismic loads. The geometrical and material properties of the composite columns and material properties used in the analytical prediction are summarized in . Chen and Lin Citation2006 stated that the confining effect was enhanced by the structural steel, indicating that the confinement factor Kh for the highly confined concrete and the confining stress on the concrete core were influenced by the shape of the structural steel section.
4. Fracture criteria based on three-dimensional P-M interaction diagram
4.1. Idealized equivalent confining factors considering double confinements
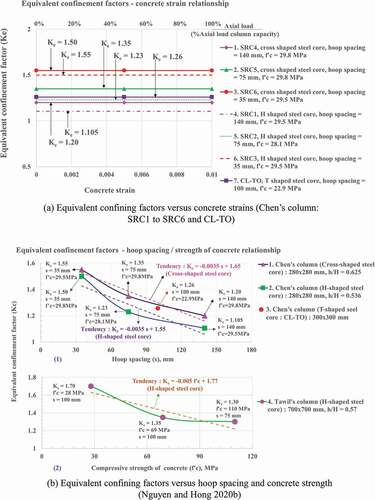
Fracture surfaces of the moments interacting with the axial forces obtained for the cross-shaped columns based on the analytical model developed in the authors’ study (Nguyen and Hong Citation2020a) were obtained for the hoop spacings of 35 mm, 75 mm, and 140 mm proposed by (Chen and Lin Citation2006). In ), the equivalent confining factors (Ke) of 1.55 (29.5 MPa), 1.35 (29.8 MPa), and 1.20 (29.8MPa) accounting for the confinement provided by the cross-shaped steel sections were presented for all concrete strains between 0.001 and 0.01. The equivalent confining factors regardless of the types of the steel cores did not vary over the compressive concrete strains between 0.001 and 0.01 for all axial loads, as illustrated in ) where the equivalent confining factors were identified for the cross-shaped, H-shaped and T-shaped core steels tested by (Chen et al. Citation1999; Chen and Lin Citation2006). The concrete confinements were influenced mostly significantly by the hoop spacing. In ), the relationships between the equivalent confining factors and the spacing of the hoop reinforcements (35 mm, 75 mm and 150 mm) are shown for the varied axial loads. The equivalent confining factors decreased as the hoop spacing increased, indicating that the confining factor was approximately 1.2 at a hoop spacing of 140 mm (Legend 1 of )) whereas the confining factor of 1.55 was calculated at a hoop spacing of 35 mm (Legend 3 of )) when the cross-shaped steel cores were used. The influences of the confinements by the cross-shaped, H-shaped, and T-shaped core steels (refer to the Chen et al. test (Chen et al. Citation1999; Chen and Lin Citation2006) on the equivalent confining factors are idealized in ) as a function of the hoop spacing. The calculated equivalent confining factors of the columns confined by H-shaped steel section (El-Tawil and Deierlein Citation1999) relative to the concrete strength are also shown in Legend 4 of ), which indicates that confining effects decrease when the concrete strengths increase.
Figure 2. Idealized equivalent confining factors considering confinements offered by the steel cores with and without lateral loads
4.2. Fracture criteria
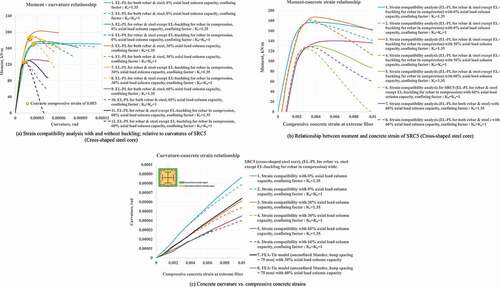
In ), the moment–curvature relationships of the columns proposed by Chen and Lin Citation2006, both with and without rebar buckling, are shown for 0%, 30%, and 60% axial loads of nominal axial load capacity. The concrete strains were evaluated at the extreme fiber in the compressive concrete regions. The moment–curvature relationships relative to the curvatures at the extreme fiber considering the concrete confinements offered by the core steel section were larger than those ignoring the effect of the core steel section. The flexural strengths were larger than those obtained when rebar buckling was considered. In ), the moment-compressive concrete strain relationships at the extreme fiber considering the concrete confinements offered by the core steel section are greater than those obtained without considering the concrete confinements provided by the core steel section. As shown in the failure surfaces depicted in ), the moment strengths indicated by Legends 4 (Ke = 1.0) and 6 (Ke = 1.0) were substantially underestimated compared with the moment strengths represented by Legends 3 (Ke = 1.35) and 5 (Ke = 1.35) for the strains beyond those corresponding to the maximum flexural strength as the axial loads increased (30% to 60%) when the confinement effect was ignored. ) suggests that the rebar buckling be considered when the moment–curvature relationships are evaluated relative to the curvature (or compressive concrete strains), especially when axial loads increase. The underestimates of the moment-compressive concrete strains relationships considering the confinements by the steel cores were more significant than those without considering them when the rebar buckling was considered as the axial loads increased. The concrete curvatures are compared with the compressive concrete strains at the extreme fiber in ). The rebar buckling was considered for the axial loads of 0%, 30% and 60% of nominal axial strength, demonstrating the underestimation of the curvatures when the confinement provided by the steel section is ignored. The curvature–strain relationships indicated by Legends 7 and 8 of ) were obtained numerically based on the finite element analysis considering the concrete plasticity for the axial loads of 30% and 60%, and agreed well with those of the analytical model.
Figure 3. Moment-curvature relationships accounting for vs. ignoring the confining effects by steel sections encased in columns of (cross-shaped column of Chen and Lin Citation2006)
4.3. Performance-based capacity with respect to the strength and ductility
4.3.1. Definition of the capacity reduction ratio (R)
The capacity reduction ratio (R) was defined as the ratio between the flexural strength ignoring the confining effects provided by the steel cores and the strength including the confining effects. In ), the capacity reduction ratio is computed as flexural strength (Mns) without accounting for the confining effects provided by steel sections divided by Mnd considering the confining effects provided by both transverse reinforcements and steel cores.
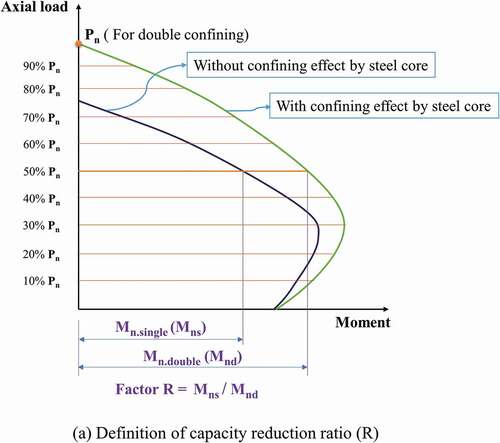
Figure 4. Performance-based capacity of composite columns
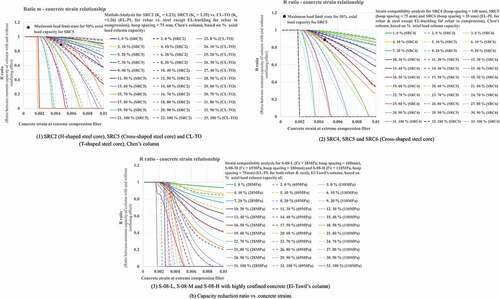
Figure 4. Continued
R indicates the fraction of the interaction diagram of the columns for the specified concrete strains and axial loads. It was obtained at the axial loads between 10% and 100% of the nominal axial strength of the full composite sections which were based on the confining effects provided by the transverse reinforcements and steel sections encased in structural concrete. The elasto-plastic rebars and steel sections encased in the structural concrete were used, permitting the elasto-buckling property for the rebars in the compression region. The Mns indicated a flexural moment capacity for the axial loads of between 10% and 100% of the nominal axial strength obtained from the P-M diagram ()) when the confining effects provided by the steel sections in the concrete were not considered. The flexural nominal moment capacity (Mnd) was calculated similarly to Mns, but accounting for the confining effects provided by the hoops and steel sections in the concrete.
4.3.2. Capacity reduction ratio (R) vs. strain level of the concrete confined by the H-shaped steel core, cross-shaped steel core and T-shaped steel core
)-(1) illustrates R values obtained for a hoop spacing of 75 mm of the column including SRC5 (a hoop spacing of 75 mm with 29.8 MPa) tested by (Chen and Lin Citation2006). In )-(1) and (c)-(1), the flexural capacity was underestimated for the composite columns (refer to the columns tested by Chen and Lin Citation2006 with the cross-shaped (28.1 MPa), H-shaped (29.8 MPa) and T-shaped steel cores). EquationEquations 13(13)
(13) to 20 were used to locate an R of 0.76 corresponding to an axial load of 50% at the concrete strain of 0.006, resulting in the underestimate of 24% with Legend 11 (SRC5; cross-shaped steel, a hoop spacing of 75 mm with 29.8 MPa) and Legend 12 (SRC2; H-shaped steel, a hoop of 75 mm with 28.1 MPa) as shown in )-(1) and (c)-(1). An underestimate of 65% of the flexural strength (R of 0.35) at the higher concrete strain of 0.01 was seen with Legends 11 (SRC5), 12 (SRC2) of )-(1) and 4(c)-(1) when an axial load of 50% was considered. As shown in )-(1), a greater underestimate (83%) was found for the concrete confined by T-shaped steel cores, as shown by the R (0.17) for the same concrete strain (0.01) and axial load (50%). But, for the lower concrete strains, the R value was close to 1 as indicated in Legends 21 and 22 of )-(1). No significant underestimates of the flexural capacity were observed at the concrete strains below 0.002 or 0.003; however, the underestimates increased as the concrete strains increased. The composite columns confined by the cross and H steel cores under the low axial loads (Legends 1 to 8 of )-(1)) showed no significant underestimate of the flexural capacity at the concrete strains below 0.003 whereas the underestimate of the flexural capacity under the low axial loads was significant for the composite columns with the large concrete strains (refer to Legends 1 to 8 of )-(1)).
4.3.3. Capacity reduction ratio (R) vs. axial loads of the composite columns confined by the H-shaped steel core, cross-shaped steel core) and T-shaped steel core
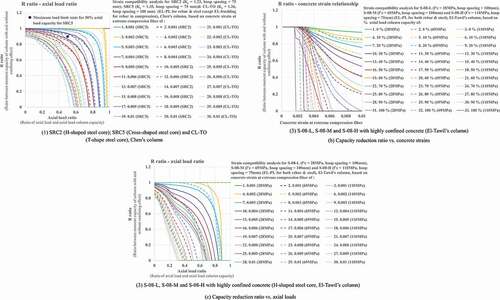
The columns with the cross and H steel cores with the high axial loads were also associated with the underestimates of the flexural strength, and the underestimates increased rapidly as the axial loads increased as shown in )-(1). An R of 0.9 (a flexural capacity underestimate of 10%) is seen for the column with a cross-shaped steel core (Legend 1) at a concrete strain of 0.01, whereas an R of 0.95 (a flexural capacity underestimate of 5%) for the column with an H-shaped steel core (Legend 2) was observed at a concrete strain of 0.01, when no axial load was applied. The underestimates of the flexural capacity became even greater when the axial load increased, indicating that the strain for the concrete columns with the axial loads greater than 50% (Legends 13 to 22) did not reach 0.01.
In )-(1), the columns loaded with a 50% of the nominal axial strength exhibited, 66% (R = 0.34, Legend 11 of the H-shaped wide flange steel) and 62% (R = 0.38, Legend 12 of cross-shaped steel) capacity underestimates, at the strains of 0.01. The underestimate identified for the T steel cores was less than that for the H-shaped wide flange steel and cross-shaped steel cores when the strains were small, as shown in the R values represented by Legends 28 to 30. But for the axial loads exceeding 80% (R values in Legend 31 to 33), the underestimates similar to those of the columns with the H-shaped wide flange steel and cross-shaped steel cores were found. )-(1) shows that the underestimates of the flexural capacity of the columns exerted with a 60% the nominal axial strength are 90% (R = 0.10) and 80% (R = 0.2) for the cross-shaped (Legend 17 of )-(1)) and the H-shaped sections (Legend 18 of )-(1)), respectively, when the strains of 0.009 were reached. R value becomes 0 when the composite columns were loaded with a 64% of the nominal axial strength of the full composite sections. However, the underestimates of a 22% flexural capacity increase to R of 0.78 for both the cross-shaped and H-shaped sections (Legends 9 and 10 of )-(1)) when the strains of the composite columns loaded with 60% of the nominal axial strength reached 0.005. )-(1) and 4(c)-(1) illustrate the underestimates of the flexural capacity increase as the strains of columns and axial loads of the columns increase. The more significant underestimates were found for the composite columns with the cross-shapes steel cores than for those with the columns with the H-shaped steel cores when the large axial loads were applied. The less ductility was demonstrated for the highly loaded columns, as shown in )-(1), whereas the R values decrease rapidly for the large strains as shown in )-(1).
4.3.4. Level of the axial load vs. the ductility demands
)-(1) illustrates that the level of the axial load can be determined once the ductility demands of the composite columns are established. For example, the composite columns should be designed with the axial forces less than the 60% of the nominal axial strength of the full composite sections to reach the concrete strain of 0.01, as shown in )-(1). The charts shown in )-(2) and 4(c)-(2) were for the hoop spacings of 35 mm (SRC6, 29.5 MPa), 75 mm (SRC5, 29.8 MPa) and 140 mm (SRC4, 29.8 MPa) for the cross-shaped steel sections.
4.3.5. Recommendation for the current design practices based on the performance-based capacity of composite columns
The flexural load-bearing capacities of the composite columns can be determined, not only at a concrete strain of 0.003 but at larger strains in the vicinity of the ultimate limit states based on the performance-based strength of the composite columns considering the confinement by the steel cores. The flexural capacity of the steel-concrete composite columns can be greater when the fracture surfaces are based on the confining factors provided by hoop reinforcements and steel sections. The current design practices underestimated the performance-based flexural capacities of the composite columns when the steel sections confining concrete section were not accounted for. This underestimate was more significant when the higher axial loads were applied to the composite columns at the large strains.
4.3.6. Design charts for determining the flexural capacities of the composite columns with the concrete confinement offered by the steel cores
In )-(3) and 4(c)-(3), design charts are presented to help determine the flexural capacities of the columns proposed by (El-Tawil and Deierlein Citation1999) for the various concrete strengths and hoop spacing. The underestimates of the flexural strengths were also identified when the concrete confinement offered by the steel cores encased in the structural concrete was ignored. The strains of the columns of 69 MPa and 110 MPa with the 40% of axial load capacities (Legends 14 and 15 of )-(3)) only reached 0.0084 and 0.0064, respectively, whereas the 28 MPa column reached a strain of 0.01 (Legend 13 of )-(3)) with an R of 0.53 (a strength underestimate of 47%). The R values (referring to the underestimates of flexural strength) decreased significantly as the concrete strengths increased (Legends 16, 17, and 18 of )-(3) and (c)-(3), representing 28 MPa, 69 MPa, and 110 MPa, respectively). The strength and ductility of the high-strength concrete section were underestimated more significantly than in the normal concrete when R was calculated without the consideration of the steel cores encased in the structural concrete. In )-(1), (2), and 4(c)-(1), (2), R values of the specimens shown with the legends are identified at the specified strains and axial loads. R values of the Specimen SRC5 are indicated at the maximum limit state when the columns are loaded with a 50% of axial load capacity.
4.4. Use of high-strength hoops for high-strength concrete
The hoop spacings of 35 mm, 75 mm, and 140 mm of the column proposed by Chen and Lin Citation2006, which yielded the equivalent confining factors of 1.55, 1.35, and 1.2, resulted in congested column sections related to the fabrication and placement of the longitudinal/transverse reinforcements around the structural steel cores. The use of the high-strength hoops may minimize the congestion of hoop reinforcements in the composite sections. (Muguruma and Watanabe Citation1990; Nishiyama, Watanabe, and Muguruma Citation1991), and others suggest that effective confinement by the high-strength concrete be made available via the high-strength hoop reinforcements, even if the confining effects are not fully activated owing to the lower compressive-dilatational characteristics of the higher-strength concrete. However, the high-strength hoop reinforcements were effective in reaching the large strains of the sections when the concrete confinements were provided by the steel cores encased in the structural concrete.
5. Conclusions
The influence of the axial loads and confining effects provided by cross-, H- and T-shaped steel cores on the flexural strength of composite columns resulted in underestimates of capacity when the flexural strength utilizing the confinement provided by the steel cores was neglected. The performance of the steel-concrete composite columns was even more underestimated as the axial loads of the columns increased. The ductility in the high-strength concrete sections was underestimated much more significantly than it was in normal concrete when the steel cores encased in structural concrete were not considered for the concrete confinement. The additional strengths contributed by the concrete confined by the cross-shaped steel cores at the strains larger than 0.003 are available. This study presented the design charts defining the axial load–moment relationships for the composite columns to identify the underestimates of the flexural capacity of the composite columns with the cross-, H- and T-shaped steel cores for the strain ranges between 0.001 and 0.01. The design charts lead to gaining the strengths of the composite columns that have been lost when the confining effects provided by the steel cores were ignored. No significant underestimate of the flexural capacity was observed at concrete strains below 0.002 or 0.003, indicating that the underestimates increased with the concrete strains. The composite columns with the moderate axial loads demonstrated no significant underestimate of the flexural capacity at a concrete strain of around 0.003, whereas then columns with the high axial loads demonstrated substantial underestimates of the flexural strength, which increased rapidly with the axial loads.
The design charts can also be used to size congested column sections with the hoops that make for difficult fabrication and placement of the longitudinal and transverse reinforcements around the structural steel cores. The use of the high-strength hoops can minimize the congestion of the hoop reinforcements in the composite sections, as (Muguruma and Watanabe Citation1990; Nishiyama, Watanabe, and Muguruma Citation1991), and others suggest. According to them, the large strains and ductility of the composite columns with the high-strength concrete can be achieved through the use of the high-strength hoop reinforcements when the concrete confinements provided by the steel cores encased in the structural concrete are included in the strength calculation.
Nomenclature
| Ari | = | area of the rebar layer i (i=1-4), mm2; |
| Asi | = | area of the part i of H-steel section, mm2; |
| B | = | width of the concrete section, mm; |
| Bi | = | width of the unconfined, equivalent confined concrete area (i =1 - 2), mm; |
| ci | = | height of the concrete compression zone of unconfined, equivalent confined concrete area (i =1 - 2), mm; |
| Cci | = | compressive force given by unconfined, equivalent confined concrete area (i=1,2), kN; |
| C’c1 | = | compressive force given by the equivalent confined concrete area inside, kN; |
| D | = | height of the concrete section, mm; |
| di | = | distance from the rebar layer i (i=1-4) to top of the concrete section, mm; |
| dc | = | distance from the centroid to top of the concrete section, mm; |
| ds | = | distance from the top flange of H-steel to top of the concrete section, mm; |
| dsi | = | distance from the force given by the part i of the H-steel to top of the concrete section, mm; |
| Es | = | Young’s modulus of steel, MPa; |
| Er | = | Young’s modulus of rebar, MPa; |
| Fri | = | force given by rebar layer i (i=1,4), kN; |
| Fsi | = | force given by part i of H-steel section (i=1,8), kN; |
| εcmi | = | strain at fiber of the unconfined, equivalent confined concrete area (i =1- 2); |
| εyR | = | yield strain of the rebar; |
| εyS | = | yield strain of the steel; |
| εri | = | strain of the rebar layer i (i=1-4); |
| εsi | = | strain respect to the part i of the H-steel section; |
| fyR | = | yield strength of the rebar, MPa; |
| fyS | = | yield strength of the steel, MPa; |
| f’c | = | compressive strength of the unconfined concrete, MPa; |
| f’cc | = | compressive strength of the equivalent confined concrete, MPa; |
| fc1 | = | concrete compressive stress in term of the concrete strain of the unconfined area, MPa; |
| fc2 | = | concrete compressive stress in term of the concrete strain of the equivalent confined area, MPa; |
| h1 | = | depth of the vertical H-steel section part of the cross-shape steel section, mm; |
| h2 | = | depth of the horizontal H-steel section part of the cross-shape steel section, mm; |
| Kh | = | confinement factors for the highly confined concrete; |
| Kp | = | confinement factors for the partially confined concrete; |
| Ke | = | confinement factors for the equivalent confined concrete; |
| tf11 | = | top flange thickness of the vertical H-steel section part of cross-shape steel section, mm; |
| tf12 | = | bottom flange thickness of the vertical H-steel section part of cross-shape steel section, mm; |
| tf21 | = | top flange thickness of the horizontal H-steel section part of cross-shape steel section, mm; |
| tf22 | = | bottom flange thickness of horizontal H-steel section part of cross-shape steel section, mm; |
| tw1 | = | web thickness of the vertical H-steel section part of the cross-shape steel section, mm; |
| tw2 | = | web thickness of the horizontal H-steel section part of the cross-shape steel section, mm; |
| x1 | = | distance from the edge of the concrete equivalent confined areas to the top of the concrete section, mm; |
| w1 | = | width of the vertical H-steel section part of the cross-shape steel section, mm; |
| w2 | = | width of the horizontal H-steel section part of the cross-shape steel section, mm; |
| αi | = | stress factors for the concrete areas i (i=1,2); |
| α’1 | = | stress factors for the concrete areas inside; |
| γ i | = | centroid factor for the concrete areas i (i=1,2); |
| γ’ 1 | = | centroid factor for the concrete areas inside; |
Author contributions
Won-Kee Hong conceived the idea; Won-Kee Hong and Dinh Han Nguyen derived the equations; Won-Kee Hong wrote and prepared the original draft; Won-Kee Hong and Dinh Han Nguyen reviewed & edited the manuscript.
Disclosure statement
The authors declare that they have no conflict of interest.
Correction Statement
This article has been republished with minor changes. These changes do not impact the academic content of the article.
Additional information
Funding
Notes on contributors
Dinh Han Nguyen
Dinh Han Nguyen is currently enrolled as a Ph.D. candidate in the Department of Architectural Engineering at Kyung Hee University, Republic of Korea. His research interests include precast composite structures.
Won-Kee Hong
Won-Kee Hong is a Professor of Architectural Engineering at Kyung Hee University. Dr. Hong received his Masters and Ph.D. degrees from UCLA, and he worked for Englelkirk and Hart, Inc. (USA), Nihhon Sekkei (Japan) and Samsung Engineering and Construction Company (Korea) before joining Kyung Hee University (Korea). He also has professional engineering licenses from both Korea and the USA. Dr. Hong has more than 30 years of professional experience in structural engineering. His research interests include new approaches to construction technologies based on value engineering with hybrid composite structures. He has provided many useful solutions to issues in current structural design and construction technologies as a result of his research combining structural engineering with construction technologies. He is the author of numerous papers and patents, both in Korea and the USA. Currently, Dr. Hong is developing new connections that can be used with various types of frames, including hybrid steel–concrete precast composite frames, precast frames and steel frames. These connections would contribute to the modular construction of heavy plant structures and buildings as well. He recently published a book titled as “Hybrid Composite Precast Systems: Numerical Investigation to Construction” (Elsevier).
References
- Bayrak, O., and S. A. Sheikh. 2001. “Plastic Hinge Analysis.” Journal of Structural Engineering 127 (9): 1092–1100. doi:https://doi.org/10.1061/(ASCE)0733-9445(2001)127:9(1092).
- Chen, C., A. Astaneh-Asl, and J. P. Moehle. 1992. “Behavior and Design of High Strength Composite Columns.” In Structures Congress 92: 820–823.
- Chen, C. C., and N. J. Lin. 2006. “Analytical Model for Predicting Axial Capacity and Behavior of Concrete Encased Steel Composite Stub Columns.” Journal of Constructional Steel Research 62 (5): 424–433. doi:https://doi.org/10.1016/j.jcsr.2005.04.021.
- Chen, C. C., C. C. Weng, I. M. Lin, and J. M. Li. 1999. “Seismic Behavior and Strength of Concrete Encased Steel Stub Columns and Beam-columns.” Report nº. MOIS 881012-1. Architecture and Building Research Institute.
- Delso, J. M., A. Stavridis, B. Shing, M. Papadrakakis, M. Fragiadakis, and V. Plevris. 2011. “Modeling the Bond-slip Behavior of Confined Large Diameter Reinforcing Bars.” In In III ECCOMAS Thematic Conf. On Computational Methods in Structural Dynamics and Earthquake Engineering COMPDYN (Vol. 14). Corfu, Greece.
- Dundar, C., S. Tokgoz, A. K. Tanrikulu, and T. Baran. 2008. “Behavior of Reinforced and Concrete-encased Composite Columns Subjected to Biaxial Bending and Axial Load.” Building and Environment 43: 1109–1120. doi:https://doi.org/10.1016/j.buildenv.2007.02.010.
- El-Tawil, S., and G. G. Deierlein. 1999. “Strength and Ductility of Concrete Encased Composite Columns.” Journal of Structural Engineering, ASCE 125 (9): 1009–1019. doi:https://doi.org/10.1061/(ASCE)0733-9445(1999)125:9(1009).
- Furlong, R. W. 1968. “Design of Steel-encased Concrete Beam–columns.” Journal of Structural Division, ASCE 94 (1): 267–281.
- Griffis,, and G. Lawrence. 1986. “Some Design Considerations for Composite-frame Structures.” Engineering Journal, AISC 23: 59–64.
- Hong, W. K. 2019. Hybrid Composite Precast Systems: Numerical Investigation to Construction. Woodhead Publishing, Elsevier.
- Kato, B. 1996. “Column Curves of Steel-concrete Composite Members.” Journal of Constructional Steel Research 39 (2): 121–135. doi:https://doi.org/10.1016/S0143-974X(96)00030-2.
- Mander, J. B., M. J. Priestley, and R. Park. 1988. “Theoretical Stress-strain Model for Confined Concrete.” Journal of Structural Engineering 114 (8): 1804–1826. doi:https://doi.org/10.1061/(ASCE)0733-9445(1988)114:8(1804).
- Mirza, S. A., V. Hyttinen, and E. Hyttinen. 1996. “Physical Tests and Analyses of Composite Steel-concrete Beam–columns.” Journal of Structural Engineering, ASCE 122 (11): 1317–1326. doi:https://doi.org/10.1061/(ASCE)0733-9445(1996)122:11(1317).
- Mirza, S. A., and B. W. Skrabek. 1992. “Statistical Analysis of Slender Composite Beam–column Strength.” Journal of Structural Engineering, ASCE 118 (5): 1312–1331. doi:https://doi.org/10.1061/(ASCE)0733-9445(1992)118:5(1312).
- Muguruma, H., and F. Watanabe. 1990. “Ductility Improvement of High-strength Concrete Columns with Lateral Confinement.” Special Publication 121: 47–60.
- Munoz, P. R., and C. T. Hsu. 1997. “Biaxially Loaded Concrete-encased Composite Columns: Design Equation.” Journal of Structural Engineering ASCE 123 (12): 1576–1585. doi:https://doi.org/10.1061/(ASCE)0733-9445(1997)123:12(1576).
- Nguyen, D. H., and W. K. Hong. 2020a. “Part I: Failure Criteria of the Steel-concrete Columns (SRC Columns) Confined by Cross-shaped Flange Sections”. Journal of Asian Architecture and Building Engineering. doi: https://doi.org/10.1080/13467581.2020.1782211
- Nguyen, D. H., and W. K. Hong. 2020b. “An Analytical Model Computing Flexural Strength and Performance of Concrete Columns Confined by Both Transverse Reinforcements and Steel Sections”. Journal of Asian Architecture and Building Engineering. doi: https://doi.org/10.1080/13467581.2020.1775603
- Nishiyama, M., F. Watanabe, and H. Muguruma. 1991. “Seismic Performance of Prestressed Concrete Beam-Column Joint Assemblages.” Proceedings of the Pacific Conference on Earthquake Engineering New Zealand 20: 217–228.
- Nzabonimpa, J. D., and W. K. Hong. 2017. “Evaluation of Hybrid Joints Strengthened by Carbon Plates Connecting New Steel Frames with Existing Concrete Slabs.” Composite Structures 174: 348–365. doi:https://doi.org/10.1016/j.compstruct.2017.04.074.
- Nzabonimpa, J. D., and W. K. Hong. 2019. “Experimental Investigation of Hybrid Mechanical Joints for L-shaped Columns Replacing Conventional Grouted Sleeve Connections.” Journal of Engineering Structure 185: 243–277. doi:https://doi.org/10.1016/j.engstruct.2019.01.123.
- Ricles, J. M., and S. D. Paboojian. 1994. “Seismic Performance of Steel-encased Composite Columns.” Journal of Structural Engineering 120 (8): 2474–2494. doi:https://doi.org/10.1061/(ASCE)0733-9445(1994)120:8(2474).
- Roik, K., and R. Bergmann. 1990. “Design Method for Composite Columns with Unsymmetrical Cross-sections.” Journal of Constructional Steel Research 33: 153–172. doi:https://doi.org/10.1016/0143-974X(90)90046-J.
- Structural Stability Research Council (SSRC) Task Group 20. 1979. “A Specification for the Design of Steel-concrete Composite Columns.” AISC Engineering Journal 16 (4): 101–115.
- Virdi, K. S., and P. J. Dowling. 1973. “The Ultimate Strength of Composite Columns in Biaxial Bending.” Proceedings Institution of Civil Engineers Part 2 (55): 251–272. doi:https://doi.org/10.1680/iicep.1973.4958.
Appendix
At ultimate load limit state with 40% axial load column capacity
The internal forces contributed by the structural components of the composite columns are shown as follows:
The compressive forces Cc1 & C’c1 are obtained by the green region for the unconfined concrete based on the Mander curve (Mander, Priestley, and Park Citation1988) whereas the compressive force Cc2 is obtained by the orange region for the equivalent confined concrete based on the Mander curves (Mander, Priestley, and Park Citation1988).
The depth of each compressive concrete block was obtained from the neutral axis as follows:
The nominal moment strength at the maximum load limit state is then obtained using Equation A7;
where the flexural moment capacities provided by the structural components with respect to the centroid are shown as follows: