
ABSTRACT
The staying activity in shopping street has an inseparable relation with the spatial scale of the street. Neither too narrow nor too wide scale of street could bring a good walking experience to pedestrian, so it is especially important to find a suitable scale. Most of the researches are qualitative investigations related to human psychology, and few of them are about underground shopping street. This research made a quantitative investigation on the relationship between the spatial scale of underground shopping street and the staying activity there, defined the concept of staying activity coefficient to quantify the staying activity in shopping street, and used virtual reality experimental method to study the influence of spatial scale changes on the staying activity in shopping street. The research results show that the height and width of underground shopping street as well as the aspect ratio could significantly affect human activity in the pedestrian spaces of underground shopping street. Meanwhile, the most suitable scale of pedestrian spaces in underground street for people to have staying activity is also derived.
1. Introduction
In shopping streets, appropriate pedestrian spacial scale could bring higher staying for shopper (Xu and Kang Citation2014; Belinda and Chin Citation1998; Painter Citation1996; Zheng Citation2015; Kang et al. Citation2015; Minhas et al. Citation2017). Staying is closely related to the occurrence frequency of shopping activities, shopping duration, activity richness, shopping spatial perception and so on. With higher staying, the shopping activity will frequently occur for a longer duration, with richer activities and better space perception; on the contrary, with lower staying, the shopping activity will occur in a lower frequency, for a shorter duration, with single activity content and worse space perception (Yun and Yang Citation2008; Whitney Citation2009; Yu, Kang, and Liu Citation2012). So, if the scale of pedestrian space in shopping streets can not be well handled, it would have a greater negative impact on people’s shopping activities.
The spatial scale of streets is composed of street length, street width, street building height and street store width. Creating a humanized street scale is the key of street design (Zhang Citation2006). Shen et al. (Citation2017) made a quantitative research of streetscape and proposed that a morphological analysis of street can help city planners to design a higher quality urban space. Ameli et al. (Citation2015) made a statistic analysis of 32 block data and proposed that a better block design could bring more pedestrian. Kang (Citation2018) put forward that, in the urban planning, the importance of street environmental design to pedestrians’ walking quantity can not be ignored. Therefore, a reasonable design of street scale is extremely important. Ashihara (Citation1987) has presented valuable opinions in his book of Aesthetics of Streets. After the investigation of Yokohama Chinatown, Motomachi and Yokohama bridge in Yokohama, Japan, he came to a conclusion that “a street with aspect ratio of 0.8–0.9 can create an Asian-styled bustling atmosphere to the most”. However, today’s buildings are at least three meters high, and even high-rise buildings are dozens of meters. If we use this ratio to figure out street width, the result will be obviously unreasonable (Cheng and Li. Citation2013). Besides, the human perception to space is not only influenced by aspect ratio but also by the size of space (Fang, Song, and Ye Citation2014). When the enclosed degree is the same, the larger the space is, the wider people will feel. So, the viewpoint of Yoshinobu Ashihara would be difficult to adapt to the design of modern urban streets.
For street scale, there are more research on the ground street. But in future city development, the importance of underground space will become increasingly prominent (Zhang, Zheng, and Wang Citation2018). The opinions and research subjects of Yoshinobu Ashihara (Tan Citation2008) are about the above-ground shopping streets. Because the underground space environment is more complex and depressive compared to the above-ground shopping streets, the orientation of pedestrian space in underground shopping streets is weaker and difficult to accurately perceive space (Tian Citation2015), and the closure of underground shopping streets is strong, so it is more difficult to study their pedestrian spatial scale and more factors need to be considered (Wu and Tian Citation2015). In addition, the opinions and research methods of Yoshinobu Ashihara are too qualitative, mainly from personal experience, and lack of judgment on the experience of others. Therefore, it is necessary to apply more effective and systematic methods and tools to conduct in-depth research on the scale of pedestrian space in the underground shopping streets.
Virtual Reality (VR) technology utilizes computer to build a three-dimensional virtual world, and provides users with visual, auditory, tactile and other sensory simulation, enabling them to immerse in the environment and observe the objects in the created space timely and unlimited. VR technology can truly restore the real scene and provide an objective condition for experimental research, and the experimental results are easily to be quantified (Wu and Zhu Citation2016). There have been many successful experiments with VR technology. For example, Yasufuku (Citation2014) used VR to calculate and analyze the visual space of human walking path in architectural space and concluded that it is feasible to analyze and evaluate the architectural space with VR equipment and experiment. Natephra, Motamedi, and Fukuda (Citation2017) built different 3D virtual models and searched for the optimal indoor lighting scheme through VR experiment. Naz, Kopper, and Mcmahan (Citation2017) used VR as a tool to build indoor scenes with different colors and explored the relationship between colors and human emotion. Through the study of three cases, Salman Azhar (Citation2017) proposed that VR technology can be used for safety assessment in construction design so that architects and engineers can intuitively assess the safety of construction site before construction, so as to improve occupational safety. Fangfang Liu and Kang (Citation2018) used VR technology to objectively evaluate the visual environment comfort of street scale. This shows VR technology has been mature and can be fully used in laboratory scene simulation for quantitative analysis. However, at present, the research on the application of VR technology to shopping streets is still limited to the analysis of psychological feelings and with few quantitative research.
In this study, VR experiment was used to quantitatively analyze the relationship between the staying activity coefficient and the scale of pedestrian space in shopping streets, and further inferred the suitable scale of pedestrian space in underground shopping streets. This suitable scale of pedestrian space proposed in the research results will provide more valuable theoretical and quantitative criterion for the design and transformation of underground shopping streets.
2. Principle and method
2.1. Research principle
This paper studied the relationship between the spatial scale and staying of streets. Since street staying is a very vague concept, in order to conduct a systematic research, the paper firstly analyzed the path form of pedestrians when they pass through the shopping street, providing a basis for the follow-up investigations and the selection of experimental method. It also proposed the concept of effective activity area for the quantification and assessment of street staying. Based on the research of this concept, the coefficient of effective staying activity was put forward as the main criterion for evaluating staying. By studying the effective activity coefficient of the streets with different scales, the relationship between street scale and staying was investigated.
2.1.1. Analysis of pedestrian passing path in underground shopping streets
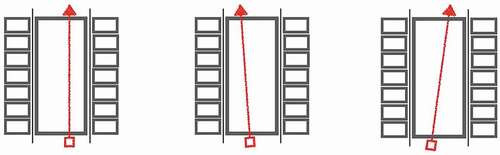
Firstly, the plane form of underground shopping pedestrian streets was abstracted, and a group of figures with big and small square spaces juxtaposed with each other were obtained. When there is no communicative behavior between people and the shop space on both sides (in this case, people’s behavior does not belong to effective staying activity occurred under the influence of environment), it can be considered that people’s walking route in the passage includes two elements: starting point and ending point. The starting and ending points can be anywhere on either side of the passage while the human behavior pattern can be thought of as a connection line between two points. shows human movement trajectory in underground shopping pedestrian street when people are not affected by commercial functions.
Figure 1. The behavior pattern of pedestrians when they are not affected
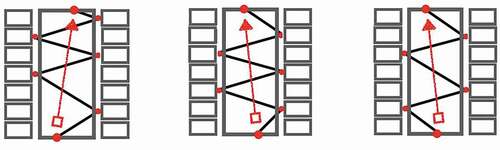
When people contact with commercial interfaces on both sides of underground shopping pedestrian streets, they will pay attention to the stores on both sides; if people are interested in a store, they will inevitably walk towards that store. Then, it can be considered that the store that interests people is a secondary goal between the starting and ending points of people’s journey, and this goal point is infinitely close to the commercial interface. The behavior of approaching the store is the deviation of people’s path when they move, and the path will become more zigzag and complicated compared with the above situation. Because only the behavior of staying activity outside the store is considered, the path stops at a goal point infinitely close to the store interface, and then the next path deviation occurs. shows the analysis of people’s movement pattern in the underground shopping pedestrian street when they are attracted by the commercial functions.
Figure 2. The behavior pattern of pedestrians when they are attracted
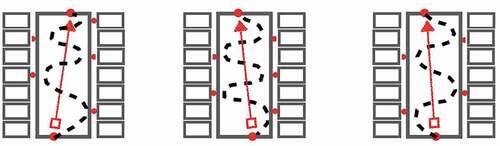
According to Frei Otto’s theory (Otto Citation2009, Citation2009; Schumacher Citation2009) related to path research, the path of pedestrians can be simplified when they pass the underground shopping streets. Frei Otto was very good at studying the natural structures of materials through their properties. It is discovered that matters have the power to self-organize and can help people get the best answer. Later, in the study of path, he proposed three basic forms of path:
1.Direct Path Networks 2. Minimal Path Networks 3. Minimizing Detour Networks
According to the theory of Minimizing Detour Networks, the research can map and demonstrate the paths that people take when they have multiple goals or concerns of interest. In the study of Minimizing Detour Networks, Frei Otto built a wool line model which using water tension between hydrophil wool line to naturally optimize the shape of a mass of wool thread, i.e. the shortest path system connecting all given points in space, so as to cut down the total path length of entire system. In mathematics, finding the shortest connection between the locating points is called a topological problem. In topology, in order to reduce the total length of the generated result, additional control point or control lines need to be added to the path. Every newly increased point has three dimensions in the space, and each edge passing through this point shows an angle of 120° with other adjacent edges (Xing Citation2016). Integrated with Frei Otto’s optimization of streamline form, the research can simplify people’s path in the street, and infer the actual movement trajectory of people when they have multiple concerns of interest in the shopping street interface, i.e. an approximate wave-shaped path form. This path form provides a reference basis for the coefficient of the effective staying activity proposed hereinafter. shows the actual route people take in the underground shopping pedestrian street when they are attracted by commercial functions.
Figure 3. The actual route of pedestrians as they pass the shopping street
2.1.2. Effective staying activity area
The staying activity in the shopping street contains all behavior activity of shoppers when they go window-shopping there, which are complicated and diversified. For example that people stop, stay and ramble freely during shopping are all staying activities. (Yu. Citation2018) It is very difficult for a simple staying or simple activity to completely conform to the behavior state of shoppers during shopping, so the research proposed and defined the concept of staying activity. It is closely related to the spatial quality and the spatial feelings. The staying activity of a space reflects the spatial quality of a space, such as safety level, contact level, prosperity and sense of place. The magnitude of staying activity not only corresponds to the staying activities in different spaces but also determines the excellence of different spatial quality and space feeling.
This research assumed that there is an area in underground shopping street where a staying activity frequently occurs, and this area is called the effective staying activity area (ESAA). Taking a section of the underground shopping street as the boundary, and taking personal staying activities as an example, as long as he/she travels (rambles, walk quickly, runs) or stays (waits and sees, rest) in one area of this pedestrian space, it can be said that this person takes staying activities in this area, and this area is called ESAA.
2.1.3. Effective staying activity coefficient
From the above analysis, it is known that the general path of pedestrian is approximate wave shape when they pass the underground shopping street (see ). In order to quantify the effective staying activities according to the path form of pedestrians, it is necessary to propose a quantifiable parameter as the evaluation criterion.
In , Line α is a straight path through the pedestrian space and used to illustrate that people will not be deviated by the business factor on both sides. Path β is used to indicate that people have deviated from the line α due to attraction on both sides of the street. Path β will interlace with the center line α to enclose a scope, and the area of this scope can be calculated. This scope is ESAA.
Figure 4. Diagram of effective staying activity
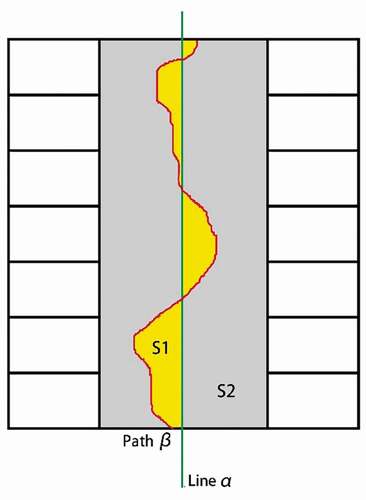
The ratio of the area of ESAA and the total area of pedestrian space is the effective staying activity coefficient (ESAC). S1 is set as the area of ESAA, and S2 is set as the total area of pedestrian space. Thus, S1/S2 means the value of ESAC, which is set as δ. This coefficient δ can be considered as a quantitative index to evaluate whether the staying activity of pedestrian space in an underground shopping street is good or bad (See for details).
2.2. Experimental method
2.2.1. Experimental samples
In the study, in order to simulate the influence of the underground commercial space with difference scales on human staying activities, VR technology was used to build virtual scenes since it is unrealistic to build real scenes. In order to make the experimental scenes built in line with the actual scale of underground commercial space as possible, a survey was conducted in the underground shopping streets across China in the early stage (see survey data in Appendix 1). According to the survey results, a suitable change range of width, height and depth were selected as the data base for the scale of virtual model of underground commercial space. In the experiment, the depth of underground commercial space was taken as a constant, and the width and height as the variables, to investigate the relationship between the spatial scale of underground shopping street and the effective activity staying coefficient. The experiment simulated the actual underground commercial spatial if possible and increased the sample size of width and height, so as to improve experimental accuracy.
2.2.2. Establishment of virtual model of underground shopping street
In order to simulate the real underground commercial space in virtual model better, firstly Sketch up and 3dmax software were used to conduct space modeling and lighting simulation meticulously. Secondly, according to the changes of width, height and other independent variables of underground commercial space, more experimental models were established. Finally, the established model was imported in Vizard 5 for script editing, to generate the VR space of underground shopping street.
2.2.3. Experimental process and data processing
Participants of different ages and genders were selected for experimental simulation. All of them were told to wear the VR helmet Oculus Rift DK2 to simulate passing virtual underground commercial space with difference scales (Zhang Citation2017), and the Precision Position Tracking Studio (PPT Studio) was used to track their paths (Tang Citation2016). After experiment, several path diagrams corresponding to different underground commercial space scale were obtained. Then, the Autodesk Computer-Aided Design software (AutoCAD) was used to calculate the area of path diagram, and ESAC of different underground commercial space scales was obtained and averaged. Finally, the Microsoft office Excel software was used to count ESAC of the underground commercial space with different scales, and the MATLAB software was used to analyze the data.
3. Experimental processes
3.1. Variable value of virtual model
(1) Depth
The survey results show that the depth of underground shopping streets is mainly between 20 ~ 40 m, and the 30 m long underground shopping streets appear most frequently. According to the experiment and site need and limits, the underground shopping street space with standard length of 36 m was particularly selected as the experimental space.
(2) Width
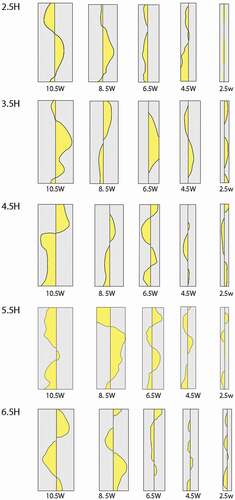
Through investigation, the width of underground shopping street is mainly between 4 m and 8 m. In order to better reflect the influence of the width on human’s staying activities, the research expanded the range of width and selected 2.5 m, 4.5 m, 6.5 m, 8.5 m and 10.5 m of virtual model as the experimental scene ().
(3) Height
Figure 5. Profile diagram of pedestrian space model of underground shopping street
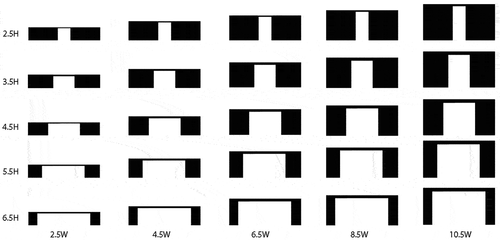
Through investigation, the height of underground commercial space does not change much. So, according to the survey data, the frequently appeared heights of 2.5 m, 3.5 m, 4.5 m, 5.5 m and 6.5 m were selected as the height of experimental scene ().
(4) Other variables
To simulate the underground commercial space scenes in a real sense, white energy-saving lamps with a color temperature of about 6000 K were used for lighting illumination, and yellow energy-saving lamps with a color temperature of about 3000 K were used cooperatively in node position (Luo Citation2012; Huang and Weng Citation2017). To prevent from additional influence of color and material on the psychological perception of the participants, the underground streets and ceilings in the ideal scene are white, with no material texture, and the floor is the frequently used white ceramic tiles in underground streets.
3.2. Establishment of VR scenes
(1) Build mode with Sketch Up
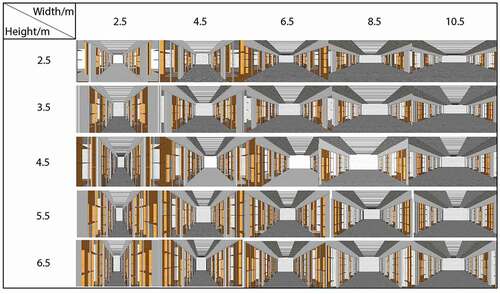
In total, 25 pedestrian space models of underground shopping street with different scales were built by using Sketch Up2015 software. Each model contains the basic elements and materials of the underground shopping street such as floor, shop, counter, suspended ceiling, lamps and so on, as shown in .
Figure 6. Establishment of pedestrian space model of underground shopping street with different scales
(2) Use 3d Max for rendering
The rendering is to import the Sketch Up model established in the previous step in the Autodesk 3D Studio Max (3d Max), to add white lamps with a color temperature of about 6000 K in it, and add yellow lamps with a color temperature of about 3000 K in the node position, for further rendering. OSGB format is then exported (as shown in ).
Figure 7. 3d Max rendering scene
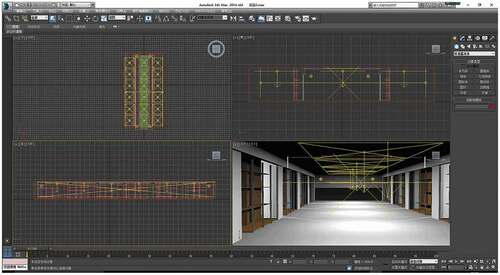
(3) Utilize Vizard5 to build VR scene
The researchers write scripts in Vizard5 (), and imports the previous OSGB file to build VR scene, to provide experimental scene for follow-up experiments.
Figure 8. Write script

Figure 9. Build VR scene
3.3. VR experiment
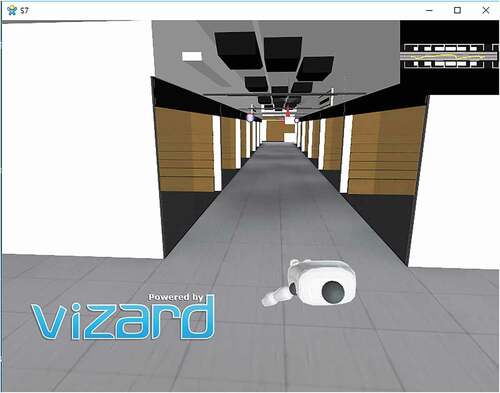
(1) Experimental equipment
Immersive VR technology was used to experience the experimental scenes. This experiment used Vizard 5.4 (Lin and Lin Citation2016), a VR engine based on Python language of Oculus, the VR helmet Oculus Rift DK2 and the motion capture system-PPT Studio, which can realize high-quality optical motion tracking over a wide range (of more than 50 m × 50 m). Optical sensors are installed in the corner of the room to track active LED indicator. Sensors collect data as they pass through the room. Through fast processing, the sensor data was transformed into accurate 3d mark position.
(2) Selection of participants
A total of 47 people participated in the experiment, of which 23 were undergraduates or graduate students majoring in architecture from China University of Mining and Technology, and 24 were undergraduates or graduate students majoring in engineering. Most of the participants had experienced underground shopping street space.
(3) Experimental process
Before the whole experiment begins, there will be a transition period during which participants will wear VR helmets and be placed in a virtual, quiet, bright and open room environment to familiarize them with the sense of space scale in the virtual environment. The entire transition period is 3–5 minutes.
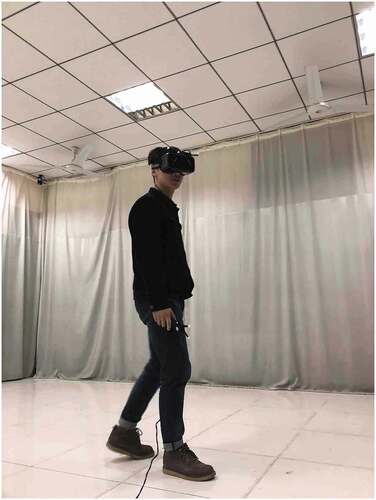
After that, the formal experiment was started (as shown in ). In the experiment, participants were randomly assigned to experience underground pedestrian space with 3–5 different scales. In the process of each VR scene experiment, there is no time limit for the experiment. Participants passed the experimental space according to certain rules, started from the middle point of the initial interface of the passage. The real and reasonable situation of walking path should be restored as possible when people pass through a street space. The pedestrian can move left and right, but not return back. In total, 80 groups of experimental data were obtained from 47 participants after the experiment, and all walking paths in the experiments were recorded. After that, all the experiments had been done.
Figure 10. Experimental scene

Figure 11. Experimental scene
4. Experimental results and analysis
During the experiment, a total of 80 groups of experiments were completed. Due to the experimental error, some walking paths exceeded the maximum width of the street, so 17 groups of invalid data were excluded and 63 groups of valid data were obtained.
4.1. Use AutoCAD for data conversion
After the walking path obtained from the experiment was fitted with the spline in AutoCAD, the cumulative area S1 and the space plane area S2 of the graph formed by the enclosure of the walking path and the center line of the room were measured. S1/S2 means ESAC(δ) which can be used to evaluate the influence of the pedestrian space of underground shopping street on human psychology.
AutoCAD orders and operations are as follows:
Insert the pedestrian path graphs
Shortcut key: L refers to creating a straight line of 36 long (scale:1:1)
Shortcut key: AL refers to aligning the length of underground shopping street with the line created
Shortcut key: L refers to drawing the profile of underground shopping street and the center line of the laneway
Shortcut key: SPL refers to spline curve fitting of walking path (vectorization)
Shortcut key: REG refers to select the region enclosed by walking curve and the center line of underground shopping street and build a region
Shortcut key: ZMJ refers to area summation order (area summation plug-in)
and Appendix 2 show the schematic diagram and preliminary calculation results of the effective staying activity after experimental statistics.
Figure 12. Diagram of effective staying activity
4.2. Use MATLAB for data analysis
Problem analysis
In this study, different ESAC(δ) was obtained by changing the height and width. In a three-dimensional space, it can be interpreted as synthesizing a number of points of ESAC(δ) values into a curved surface.
Generally, there are two data processing methods for these problems: curve fitting and interpolation method (Wang Citation2015; Tu and Huang Citation2012). The interpolation method is to use the function value of several known points in a section of the function f(x) and make appropriate specific function. In other points of this section, the value of this specific function is taken as an approximate value of the function f(x).
In the interpolation method, the spline interpolation method is a mathematical method to use variable splines to make a line going through a series of points, to analyze and process the known parametric data. In practical engineering, the spline interpolation method is frequently used to solve curved surface problem.
Therefore, this research adopted spline interpolation to search for its highest point and applied MATLAB software to fit the curve, so as to find out ESAC(δ) of the highest point and lowest point.
(2) Data source
The experiment was conducted in the VR laboratory and the street depth was constant. Through changing the height and width value, ESAC(δ) was worked out, and each group obtained 25 groups of data in average.
(3) Data processing
The research used the interpolation method to provide the functional value of the specific function in the specified section (i.e. at the height of [2.5,6.5] and the width of [2.5,10.5]) and used MATLAB software of r2017a version to write program. In which, X-axis is the height, Y-axis is the width, and Z-axis is ESAC(δ) obtained from rough data processing, thus, the function curve graph was obtained (as shown in ).
Figure 13. Pseudo-color chart
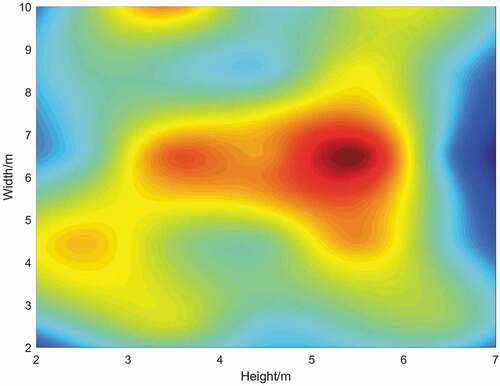
Figure 14. Contour chart
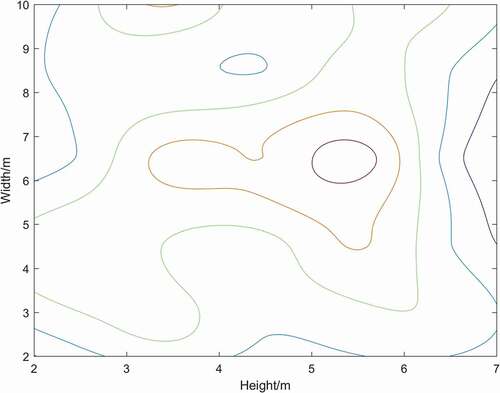
Figure 15. 3d curve diagram
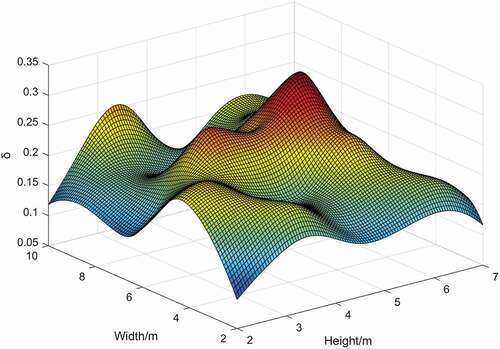
(4) Conclusion
Within the experimental scope, when Height = 5.3939 m, Width = 6.4444 m, ESAC(δ) reaches to the maximum of 0.3267.
4.3. Analysis of experimental results
Through the analysis of experimental results, we can get three charts containing the changes of the length, width and staying activity of the underground shopping street ().
Among them, is a pseudo-color chart. In this chart, the darker and the redder the area is, the greater ESAC will be. Conversely, the lighter and the bluer the area is, the smaller ESAC will be. is a contour chart. In this chart, the closer people are to the closed area of the middle contour line, the greater the effective staying efficient will be. Conversely, the further people are to the closed area of the middle contour line, the smaller the effective staying efficient will be. is a 3d curve diagram, and also the most intuitive one in the three charts. In this diagram, z-axis represents ESAC(δ), from which the height and width values corresponding to effective activity coefficient can be intuitively read out. In fact, the basic meaning of these three charts is the same.
As can be seen from the diagrams, ESAC(δ) of a space with the width of 6–7 m and the height of 4–5 m (i.e. the height–width ratio is about 0.8) is higher. Therefore, through the above experiments, it can be concluded that: the pedestrian space of underground shopping street with width of 6–7 m and height of 4–5 m is most suitable for people to stay and walk. According to the definition of effective staying activity, in the pedestrian space of underground shopping street with this scale, there will be richer shopping activity and better shopping space feeling, and it also helps to create a commercial atmosphere.
Through the interpretation of the above tables, the theoretical methods of transforming underground space into shopping street can be found, i.e. quickly obtaining the spatial scale corresponding to the maximum ESAC(δ) according to the proportional relation in the charts.
5. Discussion
The experimental results show that the definition of ESAC is from this experimental idea and the experimental method based on VR technology is a feasible quantitative research method. This method can also be used to make corresponding adjustment measures on other functional spaces and conduct related experiments, so as to quantify the spatial attributes caused by human behavior or perception in other functional spaces. Its innovative points are as follows:
The concept of staying activity and relevant variables
The research summarized the comprehensive behavior pattern of people in underground shopping streets, proposed the concept of staying activity and relevant variables (ESAA, ESAC), and derived a feasible direction for the study of the relationship between the spatial scale of underground shopping street and the behavior of people in it.
(2) The design of research method
By virtue of Frei Otto’s research of path, the experiment analyzed and inferred the behavior pattern of people in pedestrian street space, obtained the staying activity path diagrams conforming to actual situation and proposed reasonable quantitative method. This provides valid data for the experiment to make mathematical modeling with MatLab and get more comprehensive and reliable results. This research method can also be used to analyze, infer and quantify the behavior pattern of people in other kinds of public activity spaces.
(3) Application of VR experimental method
Through 3DMax virtual model and VR equipment, the participants could rapidly, intuitively and truly feel the spatial scale of different underground shopping pedestrian streets and freely have staying activity there. Several groups of experiments of staying activities of people in underground shopping streets with different scales can be completed with minimum space and time, and the track of people’s behavior can be accurately recorded. This provides conditions for the calculation of experimental results and further data processing. VR equipment can be adapted to experiment simulation of any kind of architectural space and has wonderful adaptability to the research of human behavior pattern and spatial experience.
(4) Use MATLAB to analyze data and solve architectural problems
Direct data obtained from experimental results can only represent limited groups of ESAC, while this series of direct results do not necessarily contain the actual peak and valley values. However, using MATLAB for data analysis, the relationship between the street width and height and the ESAC can be obtained. Its result is a group of value domain not just several groups of special data. Therefore, the acquired MATLAB data graphs can provide more comprehensive and accurate data support for the research of spatial scale of underground shopping pedestrian street in future.
(5) VR technology can be used to improve the research methods of urban design
The findings on street activities using VR demonstrates that VR technology is a feasible quantitative research method in the field of urban design. Digital technology, including VR, is deeply influencing the professional practice of urban renewal and site construction, which can help us to experience the urban environment remotely from the scene. In the future, VR will become an important way to experience the urban environment because of its interactive, lifelike and enhanced characteristics. Compared with the real environment, VR has the advantages of easy control and operation in the experimental method. In the practice of urban design, VR can cooperate with the actual observation. After the actual investigation, VR experiment can be used to simulate the scene of urban renewal research. Designers can repeatedly compare design schemes of different scales in virtual scenes. The conclusion can be used as the guiding principle of urban design practice.
Disclosure statement
No potential conflict of interest was reported by the authors.
Additional information
Funding
References
- Ameli, S. H., S. Hamidi, A. Garfinkelcastro, and R. Ewing. 2015. “Do Better Urban Design Qualities Lead to More Walking in Salt Lake City, Utah?” Journal of Urban Design 20 (3): 393–410. doi:https://doi.org/10.1080/13574809.2015.1041894.
- Ashihara, Y. 1987. The Aesthetic Townscape. Cambridge Mass: MIT Press.
- Azhar, S. 2017. “Role of Visualization Technologies in Safety Planning and Management at Construction Jobsites.” Procedia Engineering 171: 215–226. doi:https://doi.org/10.1016/j.proeng.2017.01.329.
- Belinda, Y., and H. C. Chin. 1998. “Pedestrian Streets in Singapore.” Transportation 25 (3): 225–242. doi:https://doi.org/10.1023/A:1005055225542.
- Cheng,, and Y. Li. 2013. Importance Analysis and Planning Suggestions of Walking Scale in Urban Streets. Beijing: China Architecture and Building Press.
- Fang, Z. G., K. Song, and Q. Ye. 2014. “Reflection of Yoshinobu Ashihara’s Research about the Proportion of Street Width to Building Height: A Study of Street Space Based on Human Scale.” New Architecture 156 (5): 136-140.
- Huang, X., and J. Weng. 2017. “Research on Lighting Design of Modern Commercial Space.” Light & Lighting 41 (1): 36-40.
- Kang, C. 2018. “The S + 5Ds: Spatial Access to Pedestrian Environments and Walking in Seoul, Korea.” Cities 77: 130–141. doi:https://doi.org/10.1016/j.cities.2018.01.019.
- Kang, Y.-W., J.-G. Kim, Y.-J. Kim, and S.-H. Oh. 2015. “A Study on the Evaluation and Improvement for Physical Elements of Slow Street in the Commercial Area.” KSCE Journal of Civil Engineering 19 (5): 1–7. doi:https://doi.org/10.1007/s12205-015-0752-y.
- Lin, C., and X. B. Lin. 2016. “Research on the Application of Augmented Reality Interactive Technology in Vizard Environment.” Computer Era 58 (7): 53–55.
- Liu, F., and J. Kang. 2018. “Relationship between Street Scale and Subjective Assessment of Audio-visual Environment Comfort Based on 3D Virtual Reality and Dual-channel Acoustic Tests.” Building and Environment 129: 35–45. doi:https://doi.org/10.1016/j.buildenv.2017.11.040.
- Luo, Y. 2012. Research on Space Environment Design of Chongqing Underground Street Based on Comfort Degree. Chongqing: Chongqing University.
- Minhas, K. S., Z. Batool, B. Z. Malik, I. Sanaullah, and T. A. Akbar. 2017. “Pedestrian Environment and Behavior in Lahore, Pakistan.” Journal of Transport & Health 7: 181–189. doi:https://doi.org/10.1016/j.jth.2017.08.013.
- Natephra, W., A. Motamedi, and T. Fukuda. 2017. “Integrating Building Information Modeling and Virtual Reality Development Engines for Building Indoor Lighting Design.” Visualization in Engineering 5 (1): 19.19. doi:https://doi.org/10.1186/s40327-017-0058-x.
- Naz, A., R. Kopper, and R. P. Mcmahan. 2017. Emotional Qualities of VR Space. 2017 IEEE Virtual Reality (VR), Los Angeles, CA, 3–11. doi:https://doi.org/10.1109/VR.2017.7892225
- Otto, F. 2009. Occupying and Connecting: Thoughts on Territories and Spheres of Influence with Particular Reference to Human Settlement. Stuttgart/London: Edition Axel Menges.
- Painter, K. 1996. “The Influence of Street Lighting Improvements on Crime, Fear and Pedestrian Street Use, after Dark.” Landscape and Urban Planning 35 (2–3): 193–201. doi:https://doi.org/10.1016/0169-2046(96)00311-8.
- Schumacher, P. 2009. “Parametricism: A New Global Style for Architecture and Urban Design.” Architectural Design 79 (4): 14–23. doi:https://doi.org/10.1002/ad.912.
- Shen, Q., W. Zeng, Y. Ye, S. M. Arisona, S. Schubiger, R. Burkhard, and H. Qu. 2017. “StreetVizor: Visual Exploration of Human-Scale Urban Forms Based on Street Views.” IEEE Transactions on Visualization and Computer Graphics 24 (1): 1004–1013. doi:https://doi.org/10.1109/TVCG.2017.2744159.
- Tan, C. 2008. Study on the Spatial Form and Scale of the Pedestrian Commercial Block in the City Center. Tianjin: Tianjin University.
- Tang, Q. F. 2016. Research on Human Behavior Recognition Method Based on Wearable Capture System. Anqing: Anqing Normal University.
- Tian, X. 2015. Research on Design of Underground Commercial Street Based on Wayfinding Behavior. Chongqing: Chongqing University.
- Tu, L. L., and D. Huang. 2012. “Application of Interpolation in Data Correction.” Math. Theory Appl 32 (3): 110–116.
- Wang, H. H. 2015. “Error Theory and Measurement Adjustment.” Shanghai: Tongji University Press.
- Whitney, R. 2009. “The Role of Streetscape Factors in Pedestrian Path Choices in Shinjuku, Tokyo.” Montreal: Concordia University.
- Wu, Y. H., and X. Tian. 2015. “Research on the Space Design of Underground Commercial Street Based on Wayfinding Behavior.” Journal of Human Settlements in West China 30 (2): 65–70.
- Wu, Y. H., and P. D. Zhu. 2016. “Study on the Correlation between Density Control and Perceived Density in Urban High-density Residential Areas.” Time Architecture 152 (6): 50–59.
- Xing, L. F. 2016. Natural Order. Jinan: Shandong Jianzhu University.
- Xu, L. Q., and Q. Kang. 2014. “The Relationship between Pedestrian Behaviors and the Spatial Features along the Ground-floor Commercial Street: The Case of West Nanjing Road in Shanghai.” Urban Planing Forum 216 (3): 104–111.
- Yasufuku, K. 2014. “Computational Analysis of Architectural Visual Space along Walking Path by Using Virtual Reality Display.” Proceedings of the 19th International Conference on Computer-Aided Architectural Design Research in Asia (CAADRIA 2014), Kyoto, 709-718.
- Yu, L., J. Kang, and H. Liu. 2012. “An Aural and Visual Study on the Urban Open Space in Shenzhen Dongmen Shopping District Using ANN Models.” The Journal of the Acoustical Society of America 131 (4): 3475. doi:https://doi.org/10.1121/1.4709109.
- Yu., H. 2018. The Pausibility Study of Pedestrian Spaces in Commercial Streets-talking North Sichuan Road in Shanghai as Example. Shanghai: Tongji University.
- Yun, Y., and Y. U. Yang. 2008. “How to Construct and Evaluate Commercial Pedestrian Streets’ Comfort.” Urban Studies 15 (03): 36-42
- Zhang, G. Y. 2017. A Study and Implementation of Immersive Virtual Scenes for Visualization of Trees. Yangling: Northwest A&F University.
- Zhang, M., X. Zheng, and K. Wang. 2018. “Analysis on the Knowledge Mapping of Foreign Research on Urban Underground Space.” Science Surveying Mapping 43 (7): 180-186.
- Zhang, Q. 2011. “Discussion on Space Scale of Humanized Commercial Street.” ShanXi Architecture 37 (21): 10-11.
- Zheng, Y. 2015. “Explore the Cultural Types of Commercial Pedestrian Street Space for containers——A Case Study of Wuhan Jianghan Road Pedestrian Street.” Architecture Culture 136 (7): 172-174.