
 ?Mathematical formulae have been encoded as MathML and are displayed in this HTML version using MathJax in order to improve their display. Uncheck the box to turn MathJax off. This feature requires Javascript. Click on a formula to zoom.
ABSTRACT
Herein, we aimed to improve the thermal insulation of polyvinyl chloride (PVC) windows to reduce the energy consumption of buildings. Currently, the gold standard PVC window is triple glazed and has a thermal transmittance of 0.7 W/(m2·K). However, further reduction in the thermal transmittance of the windows via quadruple glazing is not feasible because this would make the windows too heavy and expensive. We searched for an alternative method for reducing the thermal transmittance without increasing the weight. The window frame, glazing, and glazing edge parts of a PVC window significantly affect the overall thermal insulation; thus, we evaluated the insulation contribution of each of the above to identify their optimal conditions. Using these optimal conditions, we were able to create a window having a thermal transmittance of 0.46 W/(m2·K). However, these optimal conditions make their production difficult. Hence, we manufactured an alternative using practical specifications more suited for actual production. This window achieved a thermal transmittance of 0.63 W/(m2·K).
1. Introduction
Saving energy became an important concern in Japan during the 1973 oil crisis. As a result, the energy consumption of Japan’s industrial sector has remained almost constant despite massive growth in the scale of Japan’s economy. However, household energy consumption almost doubled in 2009 compared to 1973. One particularly effective method of achieving a reduction of load to save energy is to increase the insulation performance of windows, which is inferior to that of walls.
Polyvinyl chloride (PVC) windows are widely used, especially in cold regions where high thermal insulation performance is needed. PVC thermal insulation windows made in Japan have a thermal transmittance of around 0.8 W/(m2·K). Windows with an even better insulation performance are available in other countries. For example, in Europe, there are products with a thermal transmittance of 0.7 W/(m2·K). In both cases, this level of insulation is achieved by using triple glazing. Quadruple glazing offers even better insulation, but it results in very heavy windows. Hence, quadruple glazing is not only unsuitable for ordinary housing but can also lead to higher manufacturing costs due to the design alterations that are needed to ensure that window frames are rigid enough to cope with the added weight.
In light of this situation, we aimed to develop a PVC window that weighs less than conventional triple glazed windows while providing the same standard of thermal insulation performance as that of European windows. It should be possible to achieve a large expansion in the applicability of these windows to further reduce heating and cooling loads, such as in unheated houses. Moreover, such windows would enable increased freedom in the design of energy-saving houses and reductions in building costs (e.g., by contributing to cost savings due to reduced labor of installing windows owing to their reduced weight compared with conventional windows).
To increase the thermal insulation of windows in a simple manner, Kou et al. (Citation2019) proposed installing low-emissivity films in single-pane glass windows and conducted thermal insulation performance evaluations using numerical simulations and laboratory experiments. Hashemi, Alam, and Ip (Citation2019) proposed a thermal window shutter equipped with a vacuum insulation panel (VIP) to reduce heat loss from windows and numerically evaluated the thermal insulation performance of windows equipped with the proposed thermal shutters. Kralj et al. (Citation2019) proposed a highly insulating 6-pane glazing structure and outlined its general configuration and thermal, economic, and comfort properties; with the implementation of the proposed structure in a case study renovation project, a 50% reduction in annual energy use was observed. Focusing on the material and configuration of thermally improved spacers (TISs), Shin et al. (Citation2017) examined several types of TISs and their thermal properties based on market research and evaluated the thermal insulation performance of windows equipped with TISs using numerical simulations. Lechowska, Schnotale, and Baldinelli (Citation2017) proposed several methods for improving the thermal transmittance of PVC window frames by packing the air gaps within their cross sections with polyurethane foam and by applying a low-emissivity coating on the surfaces forming those air gaps. They also evaluated the thermal insulation performance of the window frames after applying these methods based on numerical simulations and ISO 8990 (Citation1994) and EN12412-2 (Citation2003) standards. In evaluating the insulation performance of pre-existing windows that were modified to enhance their airtightness in a typical dwelling in the UK, Cuce (Citation2017) found that air leakage plays a large role in the thermal insulation performance of windows.
Gustavsen et al. (Citation2007) and Gustavsen et al. (Citation2011) focused on specifications that satisfy passive house requirements (e.g., a window thermal transmittance ≤0.8 W/(m2·K)) in the results of a market survey related to thermal insulating window frames and presented various window frame materials and problem-solving measures capable of delivering even better insulation performance. By focusing on window frames made of PVC, aluminum, and wood, Bosschea, Buffela, and Janssensa (Citation2015) presented a general method for improving the insulation performance of each type of a window frame and performed a verification of the method’s effects based on International Organization for Standardization (ISO) standards (ISO 10077-2 Citation2012; Arai et al. (Citation2015) used low-emissivity (low-E) triple and quadruple glazing with a target thermal transmittance of 0.5 W/(m2·K) or less together with materials such as Japanese cypress and insulating materials to evaluate the thermal insulation performance of wooden windows based on ISO (ISO 10077-2 Citation2012; ISO 10077-1 Citation2006) and JIS (JIS A2102-1 Citation2015; JIS A2102-2 Citation2011; JIS A4710 Citation2015).
However, these studies have been limited to outlining conditions necessary for improving the thermal insulation performance of windows, proposing of improvement strategies, and investigating the effects of improved thermal insulation performance based on the implementation of these strategies. An efficient and reasonable evaluation method for improving the thermal insulation performance of windows has not yet been presented. This work, therefore, aims to outline a method in which the thermal effects of various materials composing a window are quantitatively evaluated to improve the thermal insulation performance, and to propose a process for determining the optimal window configuration (i.e., providing the greatest improvement of thermal insulation performance).
In the present study, our aim is to improve the thermal insulation of existing Japan-made PVC windows (hereinafter referred to as existing products) without changing the shape of the window frame or the physical properties of PVC, which is the main constituent material of the window. To this end, we propose a process for quantitatively evaluating the effects of key insulation materials and determining the optimal configuration. More specifically, we determine the effects of improving the performance of several elemental technologies (namely window frames, glazing, and glazing edge parts) that are thought to contribute to increasing thermal insulation; we identify the conditions for optimal performance; and we show the thermal insulation performance that can be achieved when the elemental technologies are combined under optimal conditions. We also present the results of investigating the feasibility of this approach by creating a test specimen and verifying the insulation performance.
The proposed evaluation method outlined in this paper will enable manufacturers to select window materials in an objective and reasonable manner when developing windows with higher thermal insulation performance, as well as reduce product development time.
2. Effects of various elemental technologies on improving heat insulation performance
2.1. Increasing the thermal insulation performance of window frames
2.1.1. Test parameters and the evaluation method
shows an annotated front view of an existing product (the casement part of a multiple-layer window); shows the cross-sectional shape of each part of the window frame; and lists the thermal conductivity of each constituent material. Existing products are made using rigid PVC for the fixed frames; casement frames, mullions, and battens; soft PVC for the airtight material; and steel for the reinforcements inside the mullions. In each cross section, multiple elemental technologies are assumed to contribute to increasing the thermal insulation of the window frame (hereinafter referred to as control factors). As an efficient and rational method of evaluating the effect of these control factors on the heat flow (Q), we used the methods of quality engineering (hereinafter referred to as Taguchi methods) (Tatebayashi Citation2006; Hirose and Ueda Citation2005). Quality engineering is a technical evaluation method developed by Genichi Taguchi. It is said to be a system that optimizes quality by suppressing variation in functions.
Table 1. Thermal conductivity of each constituent material
Figure 1. Front view of the existing window (indoor side)
Figure 2. Cross-sectional shape of the window part
The calculation of Q for each cross section was performed using a 2D steady-state heat transfer analysis program called TB2D/BEM (Itami, Akasaka, and Nimiya Citation1999; Nimiya et al. Citation2004). Our analysis model comprised a panel model’s cross section with the glazing part replaced by a thermal insulator of known heat insulation performance. Following the environmental conditions stipulated by JIS (JIS A2102-2 Citation2011), we set the thermal insulation boundary (zero heat transfer) along the thick dashed line shown in .
Figure 3. Boundary conditions
lists the control factors and their standard levels, shows a schematic illustration of the control factors (except control factors A and H), and lists the control factors and levels applied to each cross section. The control factors and levels were allocated to the L18 orthogonal array shown in so as to even out each combination of control factors, and the Q value of each cross section was calculated for these combinations to determine the average value of the signal-to-noise (SN) ratio and the degree of impact of the SN ratio. In quality engineering, SN ratio is generally used to represent the degree of variation in a control factor; a high SN ratio corresponds to a small variation. A greater SN ratio is thus the aim when minimizing heat flow. The SN ratio (η) is calculated using EquationEquation (1)(1)
(1) :
Table 2. List of control factors and levels
Table 3. List of control factors and levels applied to each section
Table 4. L18 orthogonal
Figure 4. Schematics of all control factors
By comparing the average value of the SN ratio, it is possible to determine the contribution made by each control factor to the reduction of Q in each cross section. Q is minimized by a combination of control factor levels that maximizes the average value of the SN ratio. By comparing the degree of impact of the SN ratio, it is possible to ascertain the degree of influence on Q when the level of each control factor is changed. The degree of impact of the SN ratio is obtained from the difference between the maximum and the minimum average values of the SN ratio.
Regarding the airtight material of control factor A and the mullion reinforcement material of control factor H, we aimed to improve the thermal insulation performance by selecting materials with low thermal conductivity for the airtight material and reinforcement material. The thermal conductivity of the airtight material was set to two levels, which were equivalent to those of soft PVC (0.14 W/(m·K)) and elastomer foam (0.04 W/(m·K)), and the thermal conductivity of the mullion reinforcement was set to three levels, which were equivalent to those of steel (50 W/(m·K)), stainless steel (SUS) (17 W/(m·K)), and carbon fiber reinforced plastic (CFRP) (0.35 W/(m·K)).
With control factor B (frame interior metal coating), we aimed to reduce the radiant heat transfer by forming a metal film having low long-wavelength thermal emissivity on the wall of the air layer inside the window frame’s cross section. Gustavsen et al. (Citation2011) showed that the formation of a low-E film on the wall of the air layer inside the window frame’s cross section improves the thermal insulation performance of the window frame part. The emissivity of the metal film was set to three levels: none (-), equivalent to that of aluminium (0.3), and equivalent to that of silver (0.05).
For “window frame’s internal thermal insulating material” and “window frame’s external thermal insulating material,” their corresponding control factors C and D aimed to reduce the convective heat transfer by installing an insulator material in the air layer of the window frame cross section’s interior and exterior (the connecting parts of the fixed parts and casement parts) without any gap. The thermal conductivity of the installed insulation was set to three levels: none (-), equivalent to that of rigid urethane foam (0.024 W/(m·K)), and equivalent to that of phenol foam (0.020 W/(m·K). It was also assumed that thermal insulation would not be installed in places where it would be difficult to do so.
The edge clearance dimension of control factor E and the cavity dimension of control factor F were aimed at reducing convective heat transfer by minimizing the dimensions of the corresponding parts and reducing the air layer area. To keep this minimization within the range that would not impair the window’s ability to keep out rain or make it harder to open and close, the edge clearance dimension was set to three levels (9 mm, 6 mm, and 3 mm), and the cavity dimension was set to three levels: 15 mm, 12.5 mm (14.5 mm in the upper and lower casement parts), and 10 mm (14 mm in the upper and lower casement parts).
In the cavity partition of control factor G, we installed a partition made of a material (soft PVC) that does not interfere with the opening and closing of sash windows in the cavity, with the aim of dividing the air layer to reduce convective heat transfer. The partition material was installed in a position where it would not interfere with the hangers and the clamps installed in the cavity, and the level was set to two (No: – and Yes: O).
2.1.2. Q calculation results for each cross section
shows the Q calculation results for each cross section. Case 1 combines the first-level control factors and indicates the Q of the existing product. From the table, it can be confirmed that the value of Case 1 is the largest among all the cross sections. Apart from Case 1, every combination includes second- and/or third-level control factors, and although some results are larger than others, they are all smaller than that of Case 1, thus showing that Q can be reduced by choosing the second-level or higher control factors. It can also be confirmed that the smallest numerical value from among all the cross sections was obtained for Case 3, which is a combination of all the third levels except for control factors A and B. Since control factors A and B in Case 3 are both at the first level, it is possible that Q can be further reduced by changing these levels. When the results were normalized to Q values of 100% for Case 1, the values for Case 3 were 80–82% for the casement part, 90–94% for the fixed part, and 78% for the mullion part. We used these SN ratios to evaluate the relationship of each control factor to Q.
Table 5. Q calculation results of each section (W/m)
2.1.3. Deriving each control factor’s influence on Q and optimum conditions
shows the level of each control factor and average value of the SN ratio in each cross section, and shows the degree of impact of the SN ratio. In , the outlined combination of control factor levels corresponds to the greatest reduction of Q. In , it can be seen that the average value of the SN ratio increases in all cross sections as the level of the control factor goes up. This means that a lower Q is obtained by installing a partition to divide the air layer inside the cavity part, reducing the thermal conductivity of the airtight material and mullion reinforcements, reducing the long-wavelength emissivity of the metal film formed on the wall of the air layer inside the window frame’s cross section, reducing the thermal conductivity of the insulating material installed without gaps in the air layers inside and outside the window frame’s cross section, and reducing the dimensions of the edge clearance and cavity.
Figure 5. Average value of the SN ratio
Figure 6. The degree of impact of the SN ratio
Next, the control factors that contribute to the reduction of Q with the largest impact over the SN ratio in indicate that control factor C is the most effective for the upper, lower, and vertical casement parts. Very similar trends are exhibited by the fixed part, although a large degree of impact on the SN ratio was only achieved in the lower part. This is thought to be because the lower indoor thermal insulation boundary (40 mm from the control of the heat transfer aperture dimension) was wider than the upper boundary (30 mm) and vertical boundary (20 mm), resulting in a narrower scope for heat to flow through the frame part. However, since there was only a very small difference in the degree of impact of the SN ratio between control factors C and E, they exhibited more or less the same tendency as that of the casement part. Control factor H had the greatest effect in the mullion part. This is thought to be because the thermal conductivity of steel is much greater (about 143 times larger) than that of CFRP. When the heat conductivity of the reinforcement was equivalent to that of SUS, the degree of impact of the SN ratio was approximately 0.1 dB, in which case the control factor C became the most effective.
2.1.4. Verification of the Q reduction effect
shows the Q value of each cross section under the optimum conditions and in the existing product (Case 1 in ) and the ratio of reduction relative to the existing product. The optimum conditions are met when the control factor A in Case 3 in is at the second level and control factor B is at the third level. Values smaller than those in Case 3 were obtained with all the cross sections, thus demonstrating the validity of the optimum conditions. Furthermore, the numerical values changed less in the cross section of the mullion part than in other cross sections; this is thought to be because there is no hollow part with thermal insulation installed in the cross section, so the metal film has no apparent effect. Hence, the only effects are caused by the physical properties of the airtight material.
Table 6. Q calculation results of the optimum condition (W/m)
2.2. Increasing the thermal insulation of the glazing
2.2.1. Outline of the study
As one of the elemental technologies that is expected to contribute to increasing the thermal insulation performance of the glazing parts, we studied specifications in which a visible-light-transmitting low-E film (hereinafter referred to as a low-E film) was inserted into the hollow layer of the double glazing. Even if the low-E film and the gas-filled hollow layer are designed with optimal thickness, there is a limit to the thermal insulation performance of a single gas layer, and to increase this value, it is necessary to have more than one gas layer. Since glass has a thickness, designs where the thickness is limited must reduce the hollow layer’s thickness to the thickness of a pane of glass multiplied by the number of divisions. However, when a film that has almost no thickness is used, it is possible to adopt a design where the hollow layer is not reduced at all. Moreover, since the film weighs next to nothing, the design does not require any review of the window’s structure due to changes in the glass composition and thus has the merit of allowing structures equivalent to quadruple or even quintuple glazing to be realized.
Here, we examined ideal glass configurations for heat insulation performance by optimizing the following three points:
Optimizing the efficacy and placement of low-E films
Estimating the optimum thickness for each type of gas from the relationship between the heat transfer through different types of gases and the thickness of the hollow layer
Proposing optimal glass compositions
2.2.2. Optimizing the efficacy and placement of low-E films
Using the thermal emissivity values of low-E films and ordinary float glass without low-E coatings (ε1 and ε2, respectively), we calculated the radiative heat transfer coefficient (hr) based on JIS (JIS R3107 Citation1998). The results of these calculations are shown in . Although the radiative heat transfer can be reduced by 94% by applying a single layer of a low-E film to a pane of glass, the reduction achieved with two low-E films is only 97% and is not commensurate with the addition of another low-E film. Additionally, although low-E films are transparent, they are more reflective and have more coloration than Polyethylene Terephthalate films or glass panes without low-E coatings; thus, when factors such as visibility and solar radiation characteristics are considered, it is more efficient to use a single low-E film for a single hollow layer. In general, low-E films are often only applied to one side of the window material, and in multi-layer windows, it can be very difficult and costly to apply low-E films to every surface. One low-E film per layer is more realistic.
Table 7. Calculation results of hr (W/(m2∙K))
2.2.3. Optimizing the gap thickness for each filling gas
The convective heat transfer coefficient (hc) of each hollow layer thickness was calculated based on JIS (JIS R3107 Citation1998) for air, argon, krypton, and xenon. We also calculated the thermal conductivity per unit thickness by dividing the resulting hc values by the hollow layer thickness. Thus, we could confirm the thickness at which convection occurs. For convenience, this analysis was performed with the gas at a temperature of 283 K and a 15 K temperature difference between the two opposite surfaces (JIS conditions [Hirose and Ueda Citation2005]). The results of these calculations are shown in , and the optimum thickness of each filling gas is shown in . In addition, since multi-layer glass is generally filled with gas by a replacement method, it is technically difficult to fill the gaps with 100% pure gas, and a purity of approximately 90% is more common. Therefore, the physical property values should be determined based on the actual composition of the air/gas mixture inside the hollow layer. However, to simplify the comparison of different gases, we performed these calculations assuming the use of 100% pure filling gas.
Table 8. Optimum filling thickness of each gas
Figure 7. Convective coefficient of heat transfer calculation result as a function of hollow layer thickness
We found that the thermal conductivity is fixed, and convection does not occur in an argon or air layer of approximately 10 mm, a krypton layer of approximately 8 mm, or a xenon layer of approximately 5 mm. When there is no limit to the number of layers, the maximum heat insulation effect can be expected to be obtained by using layers of these thicknesses. By contrast, when one attempts to improve the insulation performance by increasing the thickness of the hollow layer or dividing the limited space into multiple hollow layers, gases with higher thermal insulation performance tend to generate convection in thinner hollow layers, making it necessary to set an upper limit value that considers the balance between the heat insulation performance and the increased cost of filling with a larger amount of gas.
2.2.4. Proposing optimal glass compositions
Based on these test results, shows the optimum glass composition of double glazing using a low-E film and the thermal transmittance (Ug) in the central part of the glass. The thermal transmittance was calculated based on JIS (JIS R3107 Citation1998).
Table 9. Suggestion of the most suitable glazing constitution
2.3. High thermal insulation at the glazing edge
2.3.1. Settings and the evaluation method
The glazing edge parts of the double glazing proposed in Section 2.2 comprise a glazing spacer, a desiccant, a primary seal, and a secondary seal as shown in (using glass composition B as an example). In this section, we focus on the edge constituents (glazing spacer material/thickness, secondary seal material/thickness) and frame constituents (thermal insulation performance of the window frame part, the edge clearance dimension) as control factors that are assumed to help improve the thermal insulation of the glazing edge portion and used Taguchi methods to evaluate the effects of these factors on the linear thermal transmittance (Ψg) of the glazing edge parts of each cross section shown in . The calculation of Ψg for each cross section was performed based on JIS (JIS A2102-2 Citation2011). For the analytical models, we used a glass model’s cross section and a panel model’s cross section and we TB2D/BEM to perform the heat flow calculations. The environmental conditions and boundary conditions were the same as those in Section 2.1.
Figure 8. Structure of the glazing edge (Glazing composition A)
shows a list of the control factors and levels. By allocating the control factors and levels to the L18 orthogonal shown in , we calculated Ψg for each cross section with these combinations and determined average value of the SN ratio and degrees of impact of the SN ratio. The SN ratios (η) are calculated using EquationEquation (2)(2)
(2) :
Table 10. List of control factors and levels
Table 11. L18 orthogonal
With regard to the window frame’s internal thermal insulating material of control factor A and the edge clearance dimension of control factor B, we aimed to ascertain how Ψg is affected by factors that make a large contribution to the increase of the thermal insulation performance of the window frame parts shown in Section 2.1. The thermal conductivity of the thermal insulation installed in these frames was set to two levels: none (-) and equivalent to rigid urethane foam (0.024 W/(m·K)). The installation positions and installation conditions of this insulation were the same as those in Section 2.1. As in Section 2.1, the edge clearance dimension was set to three levels: 9 mm, 6 mm, and 3 mm.
For control factors C (glazing spacer material), D (glazing spacer thickness), E (secondary seal material), and F (secondary seal thickness), our aim was to ascertain how Ψg is affected by differences in these parts, which are the principal constituent materials of the glazing edge parts, and their thickness (dimensions a and b in ). The glazing spacer material was set to three levels, which were equivalent to aluminum (160 W/(m·K)), SUS (17 W/(m·K)), and PVC (0.17 W/(m·K)), and the secondary seal material was set to three levels, which were equivalent to polysulfide (0.4 W/(m·K)), silicone (0.3 W/(m·K)), and polyisobutylene (0.2 W/(m·K)). In addition, the glazing spacer thickness was set to 9 mm, 7 mm, and 5 mm levels, and the secondary seal thickness was set to 7 mm, 5 mm, and 3 mm.
2.3.2. Results of calculating Ψg for each cross section
shows the results of calculating Ψg for each cross section. In this table, Ψgave indicates the glazing edge average linear thermal transmittance per window, which is calculated using EquationEquation (3)(3)
(3) :
Table 12. Calculation results of Ψg in each case (W/(m∙K))
In both glass configurations (A) and (B), we were able to confirm the magnitude of the difference in Ψg to varying degrees in Cases 1 to 18 for all the cross sections. This is thought to be because the heat flow at the glazing edge is affected by the control factors. It can also be seen that in glass configurations (A) and (B), the largest values were obtained in Case 1, and the smallest values were obtained in Case 3 for all cross sections. When the results for Case 1 were normalized to 100%, the value of Ψg for Case 3 was 23–24% for the casement part, 24–29% for the fixed part, and 24% for the mullion part in glass configuration (A) and 21–26% for the casement part, 20–21% for the fixed part, and 22% for the mullion part in glass configuration (B). Next, we used SN ratios to evaluate the effect of each control factor on Ψg.
2.3.3. Derivation of the influence of each control factor on Ψg and the optimal conditions thereof
shows the levels and average value of the SN ratios of each control factor in each glass composition and cross section, and shows the degree of impact of these SN ratios. In both glass configurations (A) and (B), we found that the average value of the SN ratio increased as the levels increased for all cross sections except for control factor A. This means that a larger reduction in Ψg was achieved as the thermal insulation performance of the glazing spacer or secondary seal was increased, the thickness was reduced, and the edge clearance was reduced. Next, we focused on the contribution of the control factors to the reduction of Ψg with the largest degree of impact over the SN ratio in . For glass configurations (A) and (B), control factor C had the greatest effect in every cross section. Control factor A (which made the smallest contribution to the reduction of Ψg) exhibited different tendencies in each cross section and did not appear to be capable of determining the most effective level for windows. Therefore, as a method for clearly indicating the ordering of levels for control factor A in windows, we focused on the average value of the SN ratio using the average linear thermal transmittance (Ψgave) of the glazing edge parts of a single window. By averaging the linear thermal transmittance of each cross section as one window, we eliminated the effects of differences in cross section positions. shows the average value of the SN ratios of each control factor and each glass configuration using Ψgave. As this figure shows, the second level of control factor A made a greater contribution to the reduction of Ψg in each glass configuration.
Figure 9. Average value of the SN ratio
Figure 10. The degree of impact of the SN ratio
Figure 11. Average value of the SN ratio of each glazing composition and each control factor using Ψgave.
3. Combining optimal conditions of each part to produce windows with best thermal insulation performance
In the previous sections, we examined various insulation techniques for each part of a window. In this section, we combine these findings, summarize the specifications and insulation performance of each window part and show the thermal insulation performance of windows that combine the optimal conditions. shows the specifications of each part and the results of calculating the thermal transmittance (Uw) of various windows. These calculations were performed based on JIS (JIS A2102-1 Citation2015; JIS A2102-2 Citation2011). This table also shows the average thermal transmittance (Ufave) of each part of the window calculated using EquationEquation (4)(4)
(4) :
Table 13. Specifications of each part and calculation of thermal transmittance of the window
Specification A in this table is a combination of the optimal conditions for the window frame, the glazing, and glazing edge parts, and it has a Uw value of 0.46 W/(m2·K). However, this configuration is not commercially practicable. It is currently difficult to form metal films inside the cross section of window frames and to install phenol foam for thermal insulation inside the window frame’s cross section without any gaps. Additionally, although it is technically possible to fill the hollow layer in a multi-layer glass with xenon gas, it is too expensive to do so. Furthermore, PVC currently does not have enough strength to allow a low-E film to be stretched across the spacer. Therefore, in the following section, based on these specifications and its relationship to the thermal insulation performance, we build a test sample incorporating a realistic high thermal insulation technology (specification B), and we verify the technology’s performance.
4. Performance verification by measurement
4.1. Measurement method
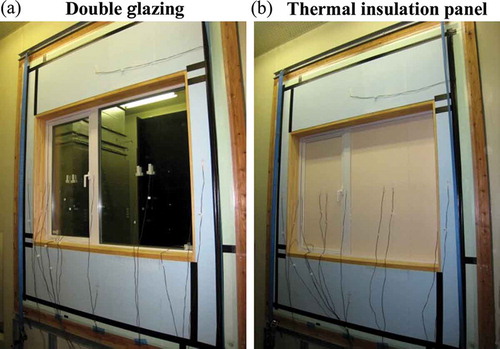
In accordance with JIS (JIS A4710 Citation2015), we measured Uw in specification B shown in the previous section. As shown in , the test sample was installed in a wall at the boundary between an indoor room and an outdoor room. We estimated Ug based on EquationEquations (5)(5)
(5) and (Equation6
(6)
(6) ), using the results obtained from measuring the inside and outside surface temperatures in the middle of the glass. Although Ug is commonly measured using standardized methods, such as EN (EN 674 Citation2011), the abovementioned method was used for convenience. Furthermore, to understand the thermal insulation performance of the window frame using the method specified by EN 12412-2 (Citation2003) and as shown in , the double glazing was replaced with an insulating panel. By measuring the heat flow through the entire window (Θsp) and subtracting the heat flow through a corresponding area of the thermal insulation panel calculated according to EquationEquation (7)
(7)
(7) , EquationEquations (8)
(8)
(8) and (Equation9
(9)
(9) ) are used to estimate Ufave.
Figure 12. Installation of the test specimen (indoor side)
4.2. Comparison of measurements with calculated results
The measured and calculated results for Uw, Ug, and Ufave are shown in , where the error bars, demonstrating uncertainty of Uw and Ufave, were calculated based on JIS (JIS A4710 Citation2015) to be ± 0.03 and ± 0.04 W/(m2·K), respectively. In each case, there was a difference of approximately 8% between the measured and calculated results. According to the literature (NFRC 100A Citation2014), this discrepancy should preferably be within 10%. It can thus be said that our results show good consistency. Possible reasons for this discrepancy include localized variation of heat transfer rates during the measurements, the effects of wiring up measuring apparatus such as heat flow meters, and variation in the precision of measurements and manufacturing.
Figure 13. Comparison of measurement results and calculated results
5. Summary
In the present study, with the aim of increasing the thermal insulation performance of PVC windows in Japan, we have conducted a quantitative evaluation of the effects of the windows’ constituent parts to show the thermal insulation performance of windows made with the best materials combined under the best conditions. At the same time, we have verified the performance of a test structure with realistic specifications suitable for commercial development. Our findings are briefly summarized as follows.
For the window frame part, we selected multiple control factors that were expected to make a large contribution to the improvement of thermal insulation, and we used Taguchi methods to examine the efficacy of these control factors for reducing the heat flow through various window cross sections to determine the optimal conditions (levels) for each control factor. Thus, we were able to reduce the heat flow compared with a conventional product under optimal conditions (with reductions of 19–21% for casement parts, 6–10% for fixed parts, and 22% for mullion parts). Furthermore, from the degree of impact of the SN ratios, we showed that the window frame’s internal thermal insulating material had the greatest heat transfer reduction effect in the casement parts and fixed parts, whereas the mullion reinforcement material had the greatest effect in the mullion parts.
With regard to the glazing parts, we studied specifications with a low-E film inserted in the hollow layer of double-glazed windows. As a result, we showed the effect of the low-E film, its optimal placement, and the optimal hollow layer’s thickness for each type of filling gas. We also showed specifications for a thermal transmittance of 0.29 W/(m2·K) with the center of the glass part containing xenon gas and three layers of a low-E film and a thermal transmittance of 0.39 W/(m2·K) with the center of the glass part containing krypton gas and two layers of the low-E film.
Similarly, we applied quality engineering methods to the glazing edges to examine the effectiveness of multiple control factors at reducing the linear thermal transmittance in each cross section. The optimum condition (level) of each control factor was derived from the average value of the SN ratio using the average linear thermal transmittance of the glazing edge parts of a single window. We also showed that the glazing spacer material exerts the greatest control over the reduction of heat transfer based on its degree of impact over the SN ratio.
We showed that a window with a thermal transmittance of 0.46 W/(m2·K) can be made by combining the frame part, the glazing part, and the glazing edge part under optimal conditions, but since there are currently technical and cost-related issues with the production of this window (including the difficulty of forming metal layers on the internal surfaces of the window, the difficulty of inserting phenol foam for thermal insulation without any gaps, the difficulty of using PVC as a glazing spacer material, and the high cost of filling multi-layer glass with xenon gas), we verified the thermal insulation performance with a test sample made using practical specifications more suited to actual production. As a result, we achieved a measured thermal transmittance of 0.63 W/(m2·K) based on a design with a specified thermal transmittance of 0.65 W/(m2·K).
Nomenclature
Af: Aspect area of the frame part (m2)
D: Thickness of the insulation panel (m)
H: Height of a window (m)
hc: Convective coefficient of heat transfer (W/(m2·K))
hr: Radiative coefficient of heat transfer (W/(m2·K))
i: Part
l: Perimeter of glazing (m)
PH: Aspect height of the insulation panel (m)
PW: Aspect width of the insulation panel (m)
Q: Heat transfer through the panel model (W/m)
R: Total surface resistance at the time of measurement ((m2·K)/W)
RJIS1: Total surface resistance defined in JIS (JIS R3107 Citation1998) (0.165 (m2·K)/W)
RJIS2: Total surface resistance defined in JIS (JIS A4710 Citation2015) (0.170 (m2·K)/W)
Uf: Thermal transmittance of the window frame part (W/(m2·K))
Ufave: Average thermal transmittance of the window frame part per window (W/(m2·K))
Ug: Thermal transmittance of glazing (W/(m2·K))
Uw: Thermal transmittance of a window (W/(m2·K))
W: Width of the window (m)
: Indoor and outdoor environmental temperature difference at the time of measurement (°C)
ε: Emissivity of a low-emissivity film (-)
η: Signal-to-noise ratio (dB)
θin: Surface temperature of the central portion of the indoor side glazing (°C)
θout: Surface temperature of the central portion of the outdoor side glazing (°C)
Θspf: Heat transfer through the insulation panel (W)
Θsp: Heat transfer through the window, including the insulation panel (W)
λ: Thermal conductivity of the insulation panel (W/(m·K))
Ψg: Linear thermal transmittance of the glazing edge (W/(m·K))
Ψgave: Average linear thermal transmittance of the glazing edge part per window (W/(m·K))
Acknowledgments
This research was conducted as part of a joint research with EXCEL SHANON Corp., Hokkaido Research Organization Building Research Department, NAKAJIMA GLASS Corp., and KURABO Corp. We express our gratitude for the cooperation of those involved.
Disclosure statement
No potential conflict of interest was reported by the authors.
Additional information
Funding
Notes on contributors
Kazunori Takada
Kazunori Takada is an engineer in the Development and Technical Dept EXCEL SHANON Corp, Japan.
Hirofumi Hayama
Hirofumi Hayama, Professor, Faculty of Engineering Hokkaido University, Japan.
Taro Mori
Taro Mori, Associate Professor, Faculty of Engineering Hokkaido University, Japan.
Koki Kikuta
Koki Kikuta, Associate Professor, Faculty of Engineering Hokkaido University, Japan.
References
- Arai, K., Y. Asano, H. Takamura, K. Iwai, K. Senpukuji, Y. Tomizawa, and K. Fukushima. 2015. “Evaluation of Insulation Performance of Window: Study on the Performance of High Insulation Wooden Sash Part 2.” AIJ Journal of Technology and Design 21 (49): 1107–1110. (In Japanese). doi:10.3130/aijt.21.1107.
- Bosschea, N., L. Buffela, and A. Janssensa. 2015. “Thermal Optimization of Window Frames.” Energy Procedia 78: 2500–2505. doi:10.1016/j.egypro.2015.11.251.
- Cuce, E. 2017. “Role of Airtightness in Energy Loss from Windows: Experimental Results from In-situ Tests.” Energy and Buildings 139: 449–455. doi:10.1016/j.enbuild.2017.01.027.
- EN 12412-2. 2003. “Thermal Performance of Windows, Doors and Shutters. Determination of Thermal Transmittance by Hot Box Method. Frames.”
- EN 674. 2011. “Glass in Building. Determination of Thermal Transmittance (U Value). Guarded Hot Plate Method.”
- Gustavsen, A., S. Grynning, D. Arasteh, B. Petter Jelle, and H. Goudey. 2011. “Key Elements of and Material Performance Targets for Highly Insulating Window Frames.” Energy and Buildings 43 (10): 2583–2594. doi:10.1016/j.enbuild.2011.05.010.
- Gustavsen, A., B. Petter Jelle, D. Arasteh, and C. Kohler. 2007. “State-of-the-art Highly Insulating Window Frames.” Research and Market Review, Project report no. 6. Norwegian University of Science and Technology, Building and Infrastructure.
- Hashemi, A., M. Alam, and K. Ip. 2019. “Comparative Performance Analysis of Vacuum Insulation Panels in Thermal Window Shutters.” Energy Procedia 157: 837–843. doi:10.1016/j.egypro.2018.11.249.
- Hirose, K., and T. Ueda. 2005. Introduction to Taguchi Method Analysis Available in Excel. Tokyo, Japan: Doyukan Co. (In Japanese).
- ISO 10077-1. 2006. “Thermal Performance of Windows, Doors and Shutters – Calculation of Thermal Transmittance – Part 1: General.”
- ISO 10077-2. 2012. “Thermal Performance of Windows, Doors and Shutters – Calculation of Thermal Transmittance – Part 2: Numerical Method for Frames.”
- ISO 8990. 1994. “Thermal Insulation — Determination of Steady-state Thermal Transmission Properties — Calibrated and Guarded Hot Box.”
- Itami, K., H. Akasaka, and H. Nimiya. 1999. “A Calculation Method for Thermal Transmittance of Windows: Part 1 Comparison between Calculated Values and Measured Ones for Casement Windows.” Journal of Architecture, Planning and Environmental Engineering (Transaction of AIJ) 64 (523): 31–37. (In Japanese).
- JIS A2102-1. 2015. “Thermal Performance of Windows and Doors - Calculation of Thermal Transmittance - Part 1: General.”
- JIS A2102-2. 2011. “Thermal Performance of Windows and Doors - Calculation of Thermal Transmittance - Part 2: Numerical Method for Frames.”
- JIS A4710. 2015. “Windows and Doorsets - Thermal Resistance Test.”
- JIS R3107. 1998. “Evaluation on Thermal Resistance of Flat Glasses and Thermal Transmittance of Glazing.”
- Kou, R., Y. Zhong, J. Kim, Q. Wang, M. Wang, R. Chen, and Y. Qiao. 2019. “Elevating Low-emissivity Film for Lower Thermal Transmittance.” Energy and Buildings 193: 69–77. doi:10.1016/j.enbuild.2019.03.033.
- Kralj, A., M. Drev, M. Žnidaršič, B. Černe, J. Hafner, and B. Jelle. 2019. “Investigations of 6-pane Glazing: Properties and Possibilities.” Energy and Buildings 190: 61–68. doi:10.1016/j.enbuild.2019.02.033.
- Lechowska, A., J. Schnotale, and G. Baldinelli. 2017. “Window Frame Thermal Transmittance Improvements without Frame Geometry Variations: An Experimentally Validated CFD Analysis.” Energy and Buildings 145: 188–199. doi:10.1016/j.enbuild.2017.04.002.
- NFRC 100A. 2014. “Procedure for Determining Fenestration Attachment Product U-factors.”
- Nimiya, H., H. Akasaka, K. Itami, and C. Kurayama. 2004. “A Calculation Method for Thermal Transmittance of Windows: Part 2 Comparison between Calculated Values and Measured Ones for Sliding Windows.” Journal of Environmental Engineering (Transaction of AIJ) 69 (576): 9–15. (In Japanese). doi:10.3130/aije.69.9_1.
- Shin, M., K. Rhee, J. Yu, and G. Jung. 2017. “Determination of Equivalent Thermal Conductivity of Window Spacers in Consideration of Condensation Prevention and Energy Saving Performance.” Energies 10 (5): 717. doi:10.3390/en10050717.
- Tatebayashi, K. 2006. Introduction to Taguchi Method. Tokyo, Japan: JUSE Press. (In Japanese).