
ABSTRACT
This study was conducted to investigate Color Rendering Index (CRI) recommendations for light emitting diode (LED) lighting in spaces needing better color rendition. Four LED spectra, that is, two spectra at Commission Internationale de l’Eclairage (CIE) Ra < 80 (79 and 76) and two spectra at CIE Ra ≥ 80 (83 and 84) were used in this study. The CIE Ra lacks accuracy in predicting perceived color quality, and the Fidelity Index and the Gamut Index were used to complement the weakness of CIE Ra. These metrics were combined to quantify the average increase or decrease in chroma. One hundred ninety-four participants evaluated retail-related tasks under different lighting conditions. The results showed that the CIE Ra had significant effects on preference, brightness perception, liveliness, and arousal. LED lights with CIE Ra < 80 received higher scores for preference, brightness perception, liveliness, and arousal than LED lights with CIE Ra ≥ 80, indicating that CIE Ra < 80 is the proper level for LED lighting in spaces needing better color rendition.
GRAPHICAL ABSTRACT
1. Introduction
The Commission Internationale de l’Eclairage (CIE) General Color Rendering Index (CRI) Ra (CIE Citation1995) has been the most widely used color fidelity measure for specifying the color rendition properties of light sources. However, with the emergence of white light sources that have continuous spectra, such as found in light emitting diodes (LEDs), the problem of inaccurately measuring the color rendition features of a white light source using the CIE Ra became apparent (Ohno Citation2005). The color rendition features of LED lights have been divided into color fidelity and color quality. The color fidelity of LED lights quantifies the accuracy with which the color of illuminated objects appears. Color quality quantifies the appearance of different psychological weights according to the differences in color or brightness. The CIE Ra cannot predict both perceived color fidelity and color quality. Many studies have proposed new measures to overcome the shortcomings of the CIE Ra, such as the Color Quality Scale (CQS) (Davis and Ohno Citation2010), Gamut Area Scale (Qg), Color Preference Scale (Qp), Feeling of Contrast Index (FCI) (Hashimoto et al. Citation2007), Gamut Area Index (GAI) (Rea and Freyssinier‐Nova Citation2008), and Memory Color Rendering Index (MCRI) (Smet et al. Citation2010). However, it has not been possible to cover the different aspects of color fidelity and color quality with a single metric (Houser et al. Citation2013), and consequently, these new measures have not been able to replace CIE Ra.
In 2015, the Illuminating Engineering Society of North America (IESNA) published TM-30-15, IES Method for Evaluating Light Source Color Rendition (IESNA Citation2015), in which is presented a two-measure system described by the Fidelity Index (Rf) and the Gamut Index (Rg) to determine a wide range of measures that quantify different aspects of color rendition. The IES Rf is conceptually equivalent to the CIE Ra, but it is different in that it is calculated using a different color difference. The IES Rg quantifies the color gamut relatively under a reference illuminant (the average increase or decrease in color saturation). Measurements from both IES Rf and IES Rg are being developed as a supplement to the CIE Ra (CIE Citation2017; Royer et al. Citation2017; Royer, Wilkerson, and Wei Citation2018; IESNA Citation2018). The CIE Ra for most interior lighting was proposed by the International Organization for Standardization (ISO) and the CIE in 2002 (ISO Citation2002). The standard value for the CIE Ra is categorized according to the type of space and the task or activity conducted within. Most light sources for architectural space such as retail interiors needing better color rendition have Ra values greater than 80 (ISO Citation2002; IESNA Citation2011). It is not clear how the recommendation of CIE Ra ≥ 80 was determined for general lighting. However, a number of different people and organizations have been involved in the setting of specification color rendition criteria of CIE Ra for interior lighting (e.g. ISO Citation2002; DOE Citation2001; IESNA Citation2011). With the development of compact fluorescent lamp lighting technology in the 1990s, Energy Star reported on their energy efficiency improvement, and they used the recommend CIE Ra ≥ 80 (DOE Citation2001). This is also adopted by ISO/CIE. People’s preferences vary with light sources of different spectral power distributions (SPDs). With the development of LED lighting, the first full-scale experiment was conducted under LED lighting for evaluating color rendition by Miller et al. (Citation2009), and many studies are being carried out to evaluate whether the recommendation of CIE Ra should be considered based on experimental evidence (Davis and Ohno Citation2010; Royer et al. Citation2017, Citation2020).It is thus important to investigate the criteria of CIE Ra for LED lighting recommendations in spaces needing better color rendition based on evaluation of light source color rendition and user acceptance.
Many studies (Wei et al. Citation2014; Szabó et al. Citation2016; Lin et al. Citation2017; Royer et al. Citation2017) have examined the CIE Ra recommendation based on experimental evidence for LED lighting in spaces needing better color rendition, but the findings show mixed results. Royer et al. (Citation2017) conducted an experiment to characterize the effect of a CIE Ra range of 43–95 on color preference. Their study showed that participants preferred LED lights with a CIE Ra value below 73, suggesting that CIE Ra ≥ 80 will lose popularity in lighting practice. Wei et al. (Citation2014) investigated color preference under LED lights with a CIE Ra of 86 and 78. A room with LED lights with CIE Ra 78 was rated preferable to a room with LED lights with CIE Ra 86. The results showed that a light source should consider CIE Ra < 80 for LED lighting in spaces needing better color rendition. However, other studies contradict those findings. Lin et al. (Citation2017) studied color preference for different lighting environments: a restaurant, a retail display, and a supermarket. For each environment, CIE Ra values of 76, 86, and 96 were applied. For restaurant and retail display lighting, participants preferred LED lights with CIE Ra 86 (CIE Ra ≥ 80) to LED lights with CIE Ra 76. Szabó et al. (Citation2016) evaluated product color appearance under 16 lighting conditions. They found that CIE Ra ≥ 80 was preferred to CIE Ra < 80 for three categories of test samples: color textiles, meat, and bakery products.
The impact of the CIE Ra of LED lighting on human emotion and cognitive activity is not well-documented. The CIE Ra can be affected by LED SPDs. Several researchers (Vogels Citation2008; Erp Citation2008; Steidle and Werth Citation2013; Wang et al. Citation2014; Wei et al. Citation2014; Islam et al. Citation2015; Li et al. Citation2019) have examined LED lighting results with very different user emotional responses and cognitive activity assessments. Wei et al. (Citation2014) compared blue-pumped LED (BP-LED) lamps with BP-LED lamps that had diminished yellow emission (YD-LED), evaluating brightness and preference. In the study, the YD-LED lights were rated as brighter and preferred than pure BP-LED lights. Islam et al. (Citation2015) conducted an experiment in which participants rated brightness and preference for a lit environment under six LED lights and two fluorescent lights with different SPDs. The participants preferred the LED lights that they perceived as brighter. Mehrabian and Russell (Citation1974) first proposed the Pleasure-Arousal-Dominance (PAD) scale, which measures the emotional effects of lighting. Park and Farr (Citation2007) surveyed the influence of CCTs on PAD in a store-like setting in a laboratory environment, and this showed that subjects assessed 3000 K lighting as more pleasurable than 5000 K lighting. A study by Quartier, Vanrie, and Van Cleempoel (Citation2014) examined the effects of lighting on PAD. Their study revealed that subjects rated a high-quality setting as more pleasurable than hard-discounter setting. Many studies (Vogels Citation2008; Erp Citation2008; Wang et al. Citation2014; Li et al. Citation2019) have developed PAD model. Li et al. (Citation2019) investigated atmosphere perception under 36 LED SPDs, and extracted four atmosphere factors: coziness, spaciousness, liveliness, and warmth. In their study, brightness for the lit environment was assessed with the term dim–bright. They found that brightness is associated with heightened coziness, spaciousness, and warmth. However, none of these studies investigated at the effects of CIE Ra.
In other research, Baron, Rea, and Daniels (Citation1992) discussed the effects of illuminance on task performance, namely word categorization. Subjects reported that 150 lux lighting improved task performance when compared with 1500 lux lighting. A study by Knez (Citation1995) discussed the effects of indoor lighting on cognitive performance. Females performed better with warm lighting than with cool lighting, while males performed better with cool lighting than with warm lighting. In addition, cognitive performance (problem-solving tasks) improved, under which they found the lighting condition evoked more positive feelings. Steidle and Werth (Citation2013) focused on the effects of lighting on creativity. Their experiment involved fluorescent light environments of 150 lx, 500 lx, and 1500 lx. It was found that low illuminance improved creativity and freedom. All these studies found that light source SPD affects human emotion. However, none of these studies looked at the effects of CIE Ra.
Bodrogi et al. (Citation2017) investigated the preference of object color between Chinese and European subjects under seven LED lightings. Their study found differences in the preference for perceived illumination chromaticity between the two subject groups. Park and Farr (Citation2007) investigated the perception of pleasure in Korean and American subjects under four lighting conditions. Their study showed differences in perception of pleasure between Americans and Koreans. Subjects of different cultural backgrounds could therefore have a different preference of lighting environment. This study included subjects of Korean cultural background who all lived in South Korea.
The main goal of this study was to investigate CIE Ra recommendations for LED lighting in spaces needing better color rendition. Four LED lights were designed at two CIE Ra (Ra < 80 and Ra ≥ 80) by considering the two systems of IES Rf and IES Rg. We used conflicting values for the IES Rf–Rg combination index, which is a new evaluation method that complements the CIE Ra. Two correlated color temperatures (CCTs) (3000 K and 6500 K) were used in this study. Participants assessed the colored object, brightness, and cognitive activity. shows the CIE Ra evaluation model for LED lighting in spaces needing better color rendition. This study will provide basic data for the CIE Ra recommendation when using LED lights in spaces needing better color rendition.
Figure 1. CIE Ra evaluation model for LED lighting in spaces needing better color rendition
2. Method
2.1. Experimental setup
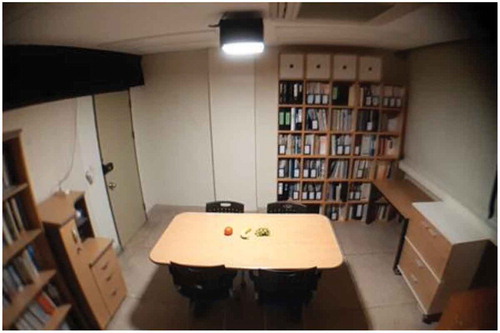
Our experiments were carried out in a furnished office room at Hongik University, Seoul, Korea. shows the experimental set up. The room was approximately 3.5 m by 3.5 m, with a ceiling height of approximately 2.45 m. Black plastic films were placed over the windows to block out daylight. The films were then covered by white blinds. The temperature inside the room was kept at 21–23°C. A table (l 2.1 m x w 0.9 m x h 0.75 m) and four chairs were centrally placed under the ceiling light. During the experiment, a restricted number of supposed retail objects including brightly colored fruit (tomatoes, bananas, and green grapes) were placed on the table. The objects were replaced every day. They were selected to provide a reasonable distribution within dimensions of enhanced red-green saturation, considered with reference to colors at opposing ends of the color spectrum.
Figure 2. The experimental environment
2.2. Lighting settings
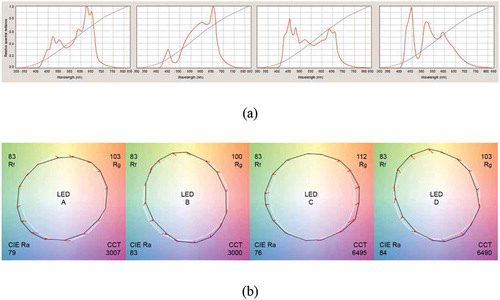
A multi-channel LED lighting system (LED Cubes, Thouslite Ltd.) was used to create four different types of LED. The luminaire had eleven independently controlled LED channels. The luminaire was controlled via software on a laptop connected to the luminaire. Four LED lights were used for the experiments, organized as a 2 × 2 factorial design, with two levels of CIE Ra (CIE Ra < 80 and CIE Ra ≥ 80) and two levels of CCT (3000 K and 6500 K), as shown in . ) shows the spectral power distribution (SPD) of each LED lights and TM-30 Colour Vector Graphics. Houser et al. (Citation2013) used two measures to characterize overall color rendition: a reference-based measure to quantify the fidelity of light sources and a gamut-based measure to quantify the quality of light sources. IES Rf is an improved version of the reference-based measure, and IES Rg is a developed version of the gamut-based measure. Two studies used IES Rf in the range of 63–93 and IES Rg in the range of 80–120 for evaluating the color rendition properties of LEDs (Royer et al. Citation2017; Esposito and Houser Citation2019). Their studies showed that object color preferences were higher in LED lighting with higher IES Rg values than those with lower IES Rg values. We therefore selected LED A (CIE Ra of 79, IES Rf-Rg of 83–103) and LED C (CIE Ra of 76, IES Rf-Rg of 83–112) for the more preferred lighting condition and LED B (CIE Ra of 76, IES Rf-Rg of 83–112) and LED D (CIE Ra of 84, IES Rf-Rg of 83–103) for the less preferred lighting condition.
Table 1. Color characteristics of the LED light sources
Figure 3. (a) Relative SPDs of LEDs. (b) TM-30 colour vector graphics
The American National Standards Institute (ANSI) used six nominal levels to specify the chromaticity of fluorescent lamps. (i.e. 2700 K, 3000 K, 3500 K, 4000 K, 5000 K, 6500 K) (ANSI Citation2001). The chromaticity of solid-state lighting has ten levels from 2200 K to 6500 K (NEMA Citation2015). Energy Star uses the CCT criterion of 2200–6500 K for fluorescent lamps and LEDs (U.S. EPA and U.S. DOE Citation2017). The CCTs of 2200 K and 2500 K are limited to filament-type lamps. ISO (Citation2002) advises that lamps with low CCT values (below 3300 K) provide light that appears warm, while lamps having high CCT values (above 5300 K) provide light that appears cool. We selected 3000 K for warm lighting condition and 6500 K for cool lighting condition. For the CCT, the two levels (3000 K and 6500 K) cover the range currently used in spaces needing better color rendition. The average room illuminance was maintained between 290 and 310 lux in the room with LEDs. A Gossen Mavolux 5032 C Meter GO 4056 illuminance meter was used to measure horizontal illuminances.
2.3. Participants
One hundred ninety-four participants from a private university in South Korea (all students; 105 males, 89 females; aged 18–27) were recruited for the experiment. Results from One hundred ninety-three participants were used in the final colored object evaluation (one was invalid due to insincere answers). None of the participants were on courses related to the study of lighting. All participants had normal color vision, as tested using the 24 Plate Ishihara Color Vision Test. The participants were asked not to wear hats, watches, and accessories. Each participant received around USD 10 in cash immediately after their participation in the experiment. The participants were randomly allocated to different lighting conditions.
2.4. Questionnaire
The participants had to complete three types of evaluation for each lighting condition: colored object evaluation (preference, saturation, and vividness), brightness evaluation (brightness perception, temperature perception, preference, atmosphere perception, and PAD), and cognitive activity (creativity and freedom). For the colored object evaluation, preference (1 = dislike, 7 = like), saturation (1 = dull, 7 = saturated), and vividness (1 = desaturated, 7 = vivid) were used. For the brightness evaluation, brightness (1 = dim, 7 = bright), color temperature (1 = cool, 7 = warm), and preference (1 = dislike, 7 = like) were used. The atmosphere perception questionnaire of Li et al. (Citation2019), which consists of 22 questions, was used. Mehrabian and Russell’s PAD scale, which includes six questions about pleasure and six questions about arousal, was also used. For cognitive activity evaluation, three questions by Dow and Mayer (Citation2004) and Schooler, Ohlsson, and Brooks (Citation1993) were used as a creative measure, eliciting verbal, spatial, and mathematical responses. Questions about freedom included a question/response from Ryan and Deci (Citation2000) (1 = externally controlled, 7 = self-determined) and a question/response from Jacobs and Scholl (Citation2005) (1 = inhibited, 7 = self-assured). Most questions were rated on a seven-point Likert scale.
2.5. Procedure
Two to four participants took part in each experimental session. All lighting was initiated 30 minutes prior to the start of the experimental sessions. Upon arriving at the experiment location, the participants adapted to the lighting environment for 3 minutes. The researcher read to them simple instructions about the experiment, and the participants wrote down their personal information such as their age and gender before starting the experiment. After evaluating the dim–bright, warm–cool, and dislike–like of the LED lights, the participants rated the atmosphere of the room using the PAD scale. After the brightness evaluation, participants were instructed to perform a cognitive activity using three creative tasks for about 6 minutes. The participants were given 2 minutes to solve each task. The researcher measured the time using a stop watch. After the creative tasks, the participants completed the questionnaire about freedom. Finally, the researcher read the instructions for the colored object evaluation to the participants. The participants rated an object’s color as it appeared on the desk. This experiment used two research designs; 2 (CIE Ra) x 2 (CCT) within-subjects design for colored object evaluation and between-subjects design for brightness and cognitive activity. Each participant carried out one judgement for every one of the four light sources in within-subjects design. Each participant performed one judgment for one of the four light sources in between-subjects design. Between-subjects design controlled for the effect of subject expectancies formed. The experiment took about 50 minutes.
3. Results
For the data analysis using the seven-point Likert scale, the answers were converted to −3 and 3, with 0 as the median value. For the creativity questions, 1 was given for right answers and 0 for wrong answers based on existing studies. A one-way analysis of variance (ANOVA) (SPSS IBM version 26) was used with a significance level of 0.05. Factor analysis was used to assess atmosphere perception. A principal components analysis with Varimax rotation was used to extract the dimensions. Four atmosphere factors were extracted. Factor 1 was named coziness, factor 2 was named liveliness, factor 3 was named alertness, and factor 4 was named spaciousness. Coziness (α = 0.90), liveliness (α = 0.74), alertness (α = 0.79), and spaciousness (α = 0.66) indices were created from a set of eleven items from factor 1, four items from factor 2, four items from factor 3, and two items from factor 4 of the atmosphere perception scale. shows the atmosphere perception dimensions from this study. The pleasure (α = 0.89), arousal (α = 0.81), and dominance (α = 0.87) indices were created by averaging a set of six items from each dimension of the PAD scale.
Table 2. Atmosphere perception dimensions
shows the means and standard deviations (SDs) of the ratings of one hundred ninety-three subjects for the colored object evaluations for different SPDs at CIE Ra < 80 or at CIE Ra ≥ 80. The results from brightness evaluations and cognitive activity evaluations were analyzed for ninety-six subjects.
Table 3. Means and standard deviations (SDs) of colored object evaluations as a function of LED lighting condition
3.1. Colored object evaluation
The visual dataset consisted of 193 (subjects) x 4 (light sources) x 3 (colored object evaluation: preference, saturation, vividness), giving 2316 data points. A one-way ANOVA revealed the CIE Ra significantly affected one of the three dependent variables (F-test; p < 0.000). The participants rated the light with the lower CIE Ra 80 (79, 76) as more preferable for colored objects than the light with the higher CIE Ra 80 (83, 84). The same result for the scaled color saturation and vividness were found in this study. shows the means and SDs at low and high CIE Ra values as well as the p values.
3.2. Brightness evaluation
A one-way ANOVA revealed a significant effect of CIE Ra on the question regarding dim–bright (F(1,94) = 6.70, p <.012). The participants in the low CIE Ra environment rated the room as brighter than did those in the high CIE Ra environment. Another one-way ANOVA on liveliness revealed the intended significant effect of CIE Ra (F(1,94) = 7.50, p < .050). The participants in the low CIE Ra environment felt livelier than did those in the high CIE Ra environment. A one-way ANOVA on the arousal affect showed a significant effect of CIE Ra (F(1,94) = 4.01, p < .048). The participants in the low CIE Ra environment felt more arousal than did those in the high CIE Ra condition. The differences in the mean ratings under different CIE Ra were not statistically significant for cool–warm (F(1,94) = 1.160, p = .284), coziness (F(1,94) = 1.065, p = .305), alertness(F(1,94) = 1.664, p = .200), spaciousness (F(1,94) = 0.001, p = .972) and pleasure (F(1,94) = 0.834, p = .363). These results indicate that being exposed to CIE Ra < 80 was preferred to CIE Ra ≥ 80.
3.3. Cognitive activity evaluation
No statistically significant differences of cognitive activity evaluation were found in the ratings between CIE Ra < 80 and CIE Ra ≥ 80. However, in most cases, the mean ratings were slightly higher when under lighting with CIE Ra < 80 than CIE Ra ≥ 80. These results indicate that the subjects’ cognitive activity improved under lighting environments with CIE Ra < 80.
The results of the statistical analysis for different CIE Ra values are presented in .
Table 4. Means and standard deviations (SD) at CIE Ra of low (76, 79) and high (83, 84), and p values for three factors
4. Discussion
This study was designed to investigate CIE Ra recommendations for LED lighting in spaces needing better color rendition and to carry out user preference evaluation for four LED lights with CIE Ra < 80 or CIE Ra ≥ 80. The LED lights with CIE Ra < 80 had IES Rf–Rg combinations that increased in chroma, and the LED lights with CIE Ra ≥ 80 had IES Rf–Rg combinations that decreased in chroma. The participants performed retail-related tasks and undertook colored object evaluation (preference, saturation, and vividness), brightness evaluation (brightness perception, color temperature, atmosphere perception, and PAD affect), and cognitive activity evaluation (creativity and freedom).
The first approach to establishing the CIE Ra recommendation was to investigate metrics for evaluating the color rendering properties of a LED light source for the spaces needing better color rendition. The statistical analysis showed that the CIE Ra significantly affected preference, saturation, and vividness. LED A (CIE Ra 79, IES Rf–Rg 83–103) and LED C (CIE Ra 76, IES Rf–Rg 83–112) with CIE Ra < 80 had higher scores for preference, saturation, and vividness of objects than LED B (CIE Ra 83, IES Rf–Rg 83–100) and LED D (CIE Ra 84, IES Rf–Rg 83–103) with CIE Ra ≥ 80. Both LED A and LED C had CIE < 80 and IES Rf–Rg combinations that increased in chroma, whereas LED B and LED D had CIE Ra ≥ 80 and IES Rf–Rg combinations that decreased in chroma. This result demonstrated that the CIE Ra fails to specify the color rendering properties of a LED light source for the spaces needing better color rendition, while IES Rf–Rg combinations, which complement the CIE Ra, provide an effective tool.
The second approach was to examine color preference. LED lights with CIE Ra < 80 were preferred more than LED lights with CIE Ra ≥ 80. The participants preferred red, orange and green under LED lights with CIE Ra < 80. In addition, the participants gave higher ratings for saturation and vividness of colored objects to LED lights with CIE Ra < 80 than LED lights with CIE Ra ≥ 80. In order to accept the current recommended CIE Ra (≥ 80) for the spaces needing better color rendition, the results should have shown that the participants give higher ratings for the three scales of preference, saturation, and vividness of objects under LEDs with CIE Ra ≥ 80. However, LEDs with CIE Ra < 80 received higher scores for preference, saturation, and vividness of object colors. These studies showed that participants preferred LED lights of higher chroma.
The third approach involved exploring the effects of a LED light source on human emotion. For the brightness evaluation, the results showed that the CIE Ra had a significant effect on dim–bright, liveliness, and arousal affect. The room under LED lights with CIE Ra < 80 was perceived as brighter, livelier, and provoked a greater arousal affect than the room under LED lights with CIE Ra ≥ 80. No statistically significant differences were found in the question responses regarding warm–cool, dislike–like, coziness, alertness, spaciousness, and pleasure between CIE Ra < 80 and CIE Ra ≥ 80. However, the means of these items were higher under LED lights with CIE Ra < 80. (The room under LED lights with CIE Ra < 80 was perceived as cozier, warmer, more alert, more spacious, and more pleasurable than under LED lights with CIE Ra ≥ 80.) The participants under LED lights with CIE Ra < 80 reported that the room looked warmer, cozier, more alert, more spacious, and more pleasurable than under LED lights with CIE Ra ≥ 80. Our findings support the study by Islam et al. (Citation2015) in which people preferred a lighting environment that seemed brighter and more spacious.
Brightness was assessed using the atmosphere perception scale used in previous research (Vogels Citation2008; Erp Citation2008; Wang et al. Citation2014; Li et al. Citation2019). Four atmosphere factors were extracted: coziness, liveliness, alertness, and spaciousness. Some differences between this study and Li et al. (Citation2019) study on the effects of lighting on atmosphere can be observed. Differences between the effects on atmosphere in the two studies might be caused by differences in adaptation time, experimental design (design within groups vs. design between groups), stimuli, measurement method, and cultural differences. However, both studies were similarly constructed, and the participants felt livelier under LED lights with increasing chroma.
The CIE Ra is not statistically significant for any questions regarding cognitive activity evaluation. However, small differences in the mean ratings were found. Three creative insight problems were used for creativity assessment. More creativity was perceived under LED lights with CIE Ra < 80 than LED lights with CIE Ra ≥ 80. In addition, the participants under LED lights with CIE Ra < 80 felt freer than the participants under LED lights with CIE Ra < 80. (Participants gave higher ratings for horse trading, triangle, inhibited-self-assured, and controlled-self to LED lights with CIE Ra < 80 than to LED lights with CIE Ra < 80.)
The participants preferred the colored objects and rated the space livelier and invoking more arousal under LED lights with CIE Ra < 80 than CIE Ra ≥ 80. Although it was statistically insignificant, they rated the space as cozier, more alert, and more spacious under the same conditions. They also rated a higher sense of creativity and feeling freer under the same conditions. The three evaluations in this study demonstrated that CIE Ra < 80 is the proper level for LED lighting in spaces needing better color rendition.
Taken together, the first approach showed that the CIE Ra was limited in predicting perceived color quality. IES Rf–Rg combinations were better measures as a supplement to the CIE Ra. The second approach found that the participants preferred LED lights of increasing chroma. The third approach demonstrated that lighting affected human emotion and cognitive activity. The findings reinforce that CIE Ra < 80 is good for LED lighting in spaces needing better color rendition.
5. Conclusions
One hundred ninety-four participants aged 19–26 took part in this study to investigate the optimal CIE Ra for LED lights in spaces needing better color rendition. The first approach to establishing a recommended CIE Ra was to investigate measures for evaluating the color quality of LED light sources in spaces needing better color rendition. The second approach involved examining color preference, an important dimension of light source color rendition. The last approach involved exploring the effects of lighting on human emotion and cognitive activity.
In terms of key findings, firstly, the CIE Ra showed limitations in evaluating LED lighting in spaces needing better color rendition. Based on the colored object evaluation, LED lights with CIE Ra < 80 were rated as preferable to LED lights with CIE Ra ≥ 80. The results showed that the CIE Ra did not accurately predict perceived color quality. In this study, IES Rf–Rg combinations were used to complement the CIE Ra, and the IES Rf–Rg combinations were a good indicator of predicting perceived color quality. While the CIE Ra remains an important metric as a standard for lighting practice, it seems advisable to complement the CIE Ra with IES Rf–Rg combinations for LED lighting in spaces needing better color rendition.
Secondly, for colored object evaluation, the CIE Ra had significant effects on preference, saturation, and vividness. The participants preferred colored objects under LED lights with CIE Ra < 80 to those with CIE Ra ≥ 80. It was also found that for the scale of saturation and vividness, CIE Ra < 80 was again rated higher than CIE Ra ≥ 80. The participants preferred LED lights that increased in chroma rather than decreased in chroma. The results indicate, as expected, that the current recommendation of CIE Ra ≥ 80 for LED lighting in spaces needing better color rendition is incorrect.
Finally, for brightness evaluation, the CIE Ra had significant effects on dim–bright, liveliness, and arousal affect. The participants rated the room in our study as brighter and livelier at CIE Ra < 80 than at CIE Ra ≥ 80. Moreover, the participants felt more of an arousal affect at CIE Ra ≥ 80 than at CIE Ra ≥ 80. For cognitive activity evaluation, no statistically significant differences between CIE Ra < 80 and CIE Ra ≥ 80 were found in creativity and freedom. However, CIE Ra < 80 promoted more creativity and heightened perceived freedom when compared with CIE Ra ≥ 80. These results support the finding in this study that the recommendation of CIE Ra ≥ 80 is wrong for LED lighting in spaces needing better color rendition.
Overall, this study suggests that three approaches are important in establishing CIE Ra recommendations. The CIE Ra has limitations, but combining with IES Rf–Rg provides a good measure for predicting perceived color quality. The participants preferred LED lights that increased in chroma; LED lights affected the appearance of objects’ color as well as human emotion and cognitive activity. The results from the three approaches demonstrate the current recommendation for CIE Ra ≥ 80 is not appropriate for LED lighting in spaces needing better color rendition and that CIE Ra < 80 should be considered instead for LED lighting in spaces needing better color rendition. Further studies are required under different ranges of CIE Ra with IES Rf–Rg combinations to establish improved CIE Ra recommendations.
Disclosure statement
No potential conflict of interest was reported by the authors.
Additional information
Funding
References
- American National Standard Institute. 2001. “Specifications for the Chromaticity of Fluorescent Lamps.” ANSI C78.376-2001. Arlington, VA: National Electrical Manufacturers Association.
- Baron, R. A., M. S. Rea, and S. G. Daniels. 1992. “Effects of Indoor Lighting (Illuminance and Spectral Distribution) on the Performance of Cognitive Tasks and Interpersonal Behaviors: The Potential Mediating Role of Positive Affect.” Motivation and Emotion 16 (1): 1–33. doi:https://doi.org/10.1007/BF00996485.
- Bodrogi, P., Y. Lin, X. Xiao, D. Stojanovic, and T. Q. Khanh. 2017. “Intercultural Observer Preference for Perceived Illumination Chromaticity for Different Coloured Object Scenes.” Lighting Research and Technology 49 (3): 305–315. doi:https://doi.org/10.1177/1477153515616435.
- Commission Internationale de l’Eclairage. CIE 13.3-1995. 1995. Method of Measuring and Specifying Colour Rendering Properties of Light Sources. Vienna: CIE.
- Commission Internationale de l’Eclairage. CIE 224: 2017. 2017. Colour Fidelity Index for Accurate Scientific Use. Vienna: CIE.
- Davis, W., and Y. Ohno. 2010. “Color Quality Scale.” Optical Engineering 49 (3): 033602. doi:https://doi.org/10.1117/1.3360335.
- Department of Energy. 2001. ENERGY STAR Program Requirements for CFLs Partner Commitments, Version 2.0. Washington, DC: DOE.
- Dow, G. T., and R. E. Mayer. 2004. “Teaching Students to Solve Insight Problems: Evidence for Domain Specificity in Creativity Training.” Creativity Research Journal 16 (4): 389–398. doi:https://doi.org/10.1080/10400410409534550.
- Erp, T. 2008. “The Effects of Lighting Characteristics on Atmosphere Perception.” Unpublished manuscript for Philips Research, Eindhoven, Netherlands.
- Esposito, T., and K. Houser. 2019. “Models of Colour Quality over a Wide Range of Spectral Power Distributions.” Lighting Research and Technology 51 (3): 331–352. doi:https://doi.org/10.1177/1477153518765953.
- Hashimoto, K., T. Yano, M. Shimizu, and Y. Nayatani. 2007. “New Method for Specifying Color‐rendering Properties of Light Sources Based on Feeling of Contrast.” Color Research and Application 32 (5): 361–371. doi:https://doi.org/10.1002/col.20338.
- Houser, K. W., M. Wei, A. David, M. R. Krames, and X. S. Shen. 2013. “Review of Measures for Light-source Color Rendition and Considerations for a Two-measure System for Characterizing Color Rendition.” Optics Express 21 (8): 10393–10411. doi:https://doi.org/10.1364/OE.21.010393.
- Illuminating Engineering Society. 2011. The Lighting Handbook. 10th ed. New York: IES.
- Illuminating Engineering Society of North America. IES TM-30-15. 2015. IES Method for Evaluating Light Source Color Rendition. New York: IESNA.
- Illuminating Engineering Society of North America. IES TM-30-18. 2018. IES Method for Evaluating Light Source Color Rendition. New York: IESNA.
- International Standards Organization. ISO 8995-1. 2002. Lighting of Indoor Work Places—part 1: Indoor. Geneva: ISO.
- Islam, M. S., R. Dangol, M. Hyvärinen, P. Bhusal, M. Puolakka, and L. Halonen. 2015. “User Acceptance Studies for LED Office Lighting: Lamp Spectrum, Spatial Brightness and Illuminance.” Lighting Research and Technology 47 (1): 54–79. doi:https://doi.org/10.1177/1477153513514425.
- Jacobs, I., and W. Scholl. 2005. “Interpersonale adjektivliste (IAL).” Diagnostica 51 (3): 145–155. doi:https://doi.org/10.1026/0012-1924.51.3.145.
- Knez, I. 1995. “Effects of Indoor Lighting on Mood and Cognition.” Journal of Environmental Psychology 15 (1): 39–51. doi:https://doi.org/10.1016/0272-4944(95)90013-6.
- Li, B., Q. Y. Zhai, J. B. Hutchings, M. R. Luo, and F. T. Ying. 2019. “Atmosphere Perception of Dynamic LED Lighting over Different Hue Ranges.” Lighting Research and Technology 51 (5): 682–703. doi:https://doi.org/10.1177/1477153517702532.
- Lin, Y., M. Wei, K. A. G. Smet, A. Tsukitani, P. Bodrogi, and T. Q. Khanh. 2017. “Colour Preference Varies with Lighting Application.” Lighting Research and Technology 49 (3): 316–328. doi:https://doi.org/10.1177/1477153515611458.
- Mehrabian, A., and J. A. Russell. 1974. “The Basic Emotional Impact of Environments.” Perceptual and Motor Skills 38 (1): 283–301. doi:https://doi.org/10.2466/pms.1974.38.1.283.
- Miller, C., Y. Ohno, W. Davis, Y. Zong, and K. Dowling 2009. “NIST Spectrally Tunable Lighting Facility for Color Rendering and Lighting Experiments.” In Proceedings of Light and Lighting Conference with Special Emphasis on LEDs and Solid State Lighting, Budapest 5.
- National Electrical Manufacturers Association. C78.377-2015. 2015. American National Standard for Electric Lamps—specifications for the Chromaticity of Solid State Lighting (SSL) Products. Arlington, VA: NEMA.
- Ohno, Y. 2005. “Spectral Design Considerations for White LED Color Rendering.” Optical Engineering 44 (11): 111302. doi:https://doi.org/10.1117/1.2130694.
- Park, N. K., and C. A. Farr. 2007. “The Effects of Lighting on Consumers’ Emotions and Behavioral Intentions in a Retail Environment: A Cross‐cultural Comparison.” Journal of Interior Design 33 (1): 17–32. doi:https://doi.org/10.1111/j.1939-1668.2007.tb00419.x.
- Quartier, K., J. Vanrie, and K. Van Cleempoel. 2014. “As Real as It Gets: What Role Does Lighting Have on Consumer’s Perception of Atmosphere, Emotions and Behaviour?” Journal of Environmental Psychology 39: 32–39. doi:https://doi.org/10.1016/j.jenvp.2014.04.005.
- Rea, M. S., and J. P. Freyssinier‐Nova. 2008. “Color Rendering: A Tale of Two Metrics.” Color Research and Application 33 (3): 192–202. doi:https://doi.org/10.1002/col.20399.
- Royer, M. P., M. Wei, A. Wilkerson, and S. Safranek. 2020. “Experimental Validation of Colour Rendition Specification Criteria Based on ANSI/IES TM-30-18.” Lighting Research and Technology 52 (3): 323–349. doi:https://doi.org/10.1177/1477153519857625.
- Royer, M. P., A. Wilkerson, and M. Wei. 2018. “Human Perceptions of Colour Rendition at Different Chromaticities.” Lighting Research and Technology 50 (7): 965–994. doi:https://doi.org/10.1177/1477153517725974.
- Royer, M. P., A. Wilkerson, M. Wei, K. Houser, and R. Davis. 2017. “Human Perceptions of Colour Rendition Vary with Average Fidelity, Average Gamut, and Gamut Shape.” Lighting Research and Technology 49 (8): 966–991. doi:https://doi.org/10.1177/1477153516663615.
- Ryan, R. M., and E. L. Deci. 2000. “Self-determination Theory and the Facilitation of Intrinsic Motivation, Social Development, and Well-being.” American Psychologist 55 (1): 68. doi:https://doi.org/10.1037/0003-066X.55.1.68.
- Schooler, J. W., S. Ohlsson, and K. Brooks. 1993. “Thoughts beyond Words: When Language Overshadows Insight.” Journal of Experimental Psychology. General 122 (2): 166. doi:https://doi.org/10.1037/0096-3445.122.2.166.
- Smet, K. A., W. R. Ryckaert, M. R. Pointer, G. Deconinck, and P. Hanselaer. 2010. “Memory Colours and Colour Quality Evaluation of Conventional and Solid-state Lamps.” Optics Express 18 (25): 26229–26244. doi:https://doi.org/10.1364/OE.18.026229.
- Steidle, A., and L. Werth. 2013. “Freedom from Constraints: Darkness and Dim Illumination Promote Creativity.” Journal of Environmental Psychology 35: 67–80. doi:https://doi.org/10.1016/j.jenvp.2013.05.003.
- Szabó, F., R. Kéri, J. Schanda, P. Csuti, A. Wilm, and E. Baur. 2016. “A Study of Preferred Colour Rendering of Light Sources: Shop Lighting.” Lighting Research and Technology 48 (3): 286–306. doi:https://doi.org/10.1177/1477153515573042.
- U.S. Environmental Protection Agency and U.S. Department of Energy. 2017. ENERGY STAR Program Requirements for Lamps, Version 2.1. Washington, DC: EPA.
- Vogels, I. 2008. Atmosphere Metrics, 25–41. Dordrecht: Springer.
- Wang, H. H., M. R. Luo, P. Liu, Y. Yang, Z. Zheng, and X. Liu. 2014. “A Study of Atmosphere Perception of Dynamic Coloured Light.” Lighting Research and Technology 46 (6): 661–675. doi:https://doi.org/10.1177/1477153513506591.
- Wei, M., K. W. Houser, G. R. Allen, and W. W. Beers. 2014. “Color Preference under LEDs with Diminished Yellow Emission.” Leukos 10 (3): 119–131. doi:https://doi.org/10.1080/15502724.2013.865212.