
 ?Mathematical formulae have been encoded as MathML and are displayed in this HTML version using MathJax in order to improve their display. Uncheck the box to turn MathJax off. This feature requires Javascript. Click on a formula to zoom.
ABSTRACT
Narrow streets in densely built-up areas face problems in terms of disaster prevention. However, such streets serve as spaces for activities, communication, and a comfortable lifestyle, and thus, such streets should be considered for redesign in view of their beneficial aspects. Therefore, this study aims to examine the physical characteristics of these beneficial streets and discuss their relationship with the frequency of street use; in addition, street images were also analyzed. The results indicate that it is conceivable for street spaces with beneficial aspects to be created such that physical environmental factors can be controlled.
1. Introduction
Japan’s metropolitan suburbs include a lot of densely built-up areas with old wooden buildings and narrow streets. These areas face several problems in the event of a disaster as they are highly prone to catching fires. The fires spread easily and pose difficulties in fire-fighting operations. In addition, these areas run a high risk of road blockages due to collapsed buildings. Therefore, such areas need to be redesigned by adopting appropriate measures for disaster management, such as changing city blocks, widening roads, rebuilding, and so on. On the other hand, such spaces also have several positive aspects, in terms of the living environment: In densely built-up areas, streets are used for diverse activities, such as socializing among neighbors and play space for children. Moreover, such areas provide a sense of comfort, affinity, and security because of their spatial features (Usugi et al. Citation2010; Goto et al. Citation2009).
Based on the previously mentioned viewpoints on disaster prevention and positive aspects unique to densely built-up areas, redesigning them must be considered. To effectively plan the redesigning of such areas, it is imperative to understand the features of the adjacent streets that are used by residents and project a positive image of those residents. In addition, the understanding the features of streets in the redeveloped area should be also useful information in the redesign of densely built-up areas.
Previous studies have assessed urban districts from various aspects of the living environment. For example, drivers of pedestrian activity are analyzed using pedestrian count data in New York City and the impact of the environment on people’s everyday experiences is evaluated by combining accessibility analysis and public participatory GIS (PPGIS) in Stockholm (Samuelsson et al. Citation2018). Contextual features and time-varying situational indicators (Lai and Kontokosta Citation2018) have also been considered while analyzing the urban districts based on the living environment.
Although there are few studies on living environments, including those mentioned previously, there are not many on living environments in densely built-up areas. Such areas have been the focus of several studies in Asian countries; however, those studies are not based on analyzing living environments. Studies have been mostly conducted on the thermal environment. For example, in high-density urban sites in Iran-Tehran, a study examined the impacts of one of the most probable options for development on temperature and urban heat (Ramyar et al. Citation2019) and in five selected high-density areas in Singapore, the interdependencies between street grids and the efficiency of district cooling systems were examined (Shi et al. Citation2020).
Very few studies have focused on living environment. Studies on the use of living space, include examination of the remaining and changing characteristics of the residential use of common space and the neighborhood’s relationship before and after the program in hillside high-density areas in Busan, Korea (Cho and Sawaki Citation2007), comparison of walking behaviour and patterns of perceived destination accessibility in older adults between a low-density and an ultra-dense city (Dankwa et al. Citation2019), and investigation of spatial structure and vibrancy in highly dense cities by using georeferenced social media data (Chen et al. Citation2019). Moreover, there are studies on the evaluation of open spaces from the residents’ perspective, such as identifying the important planning and design criteria of public open spaces for the elderly (Yung, Conejos, and Chan Citation2016) and investigating site configurations, microclimates, and perceptions of users (Xue, Gou, and Lau Citation2017). However, few studies have analyzed the influencing factors of resident behaviour and spatial evaluation in densely built-up areas by conducting field measurements and questionnaires.
Focusing on Japanese research, there are many studies on disaster prevention and the thermal environment, for instance the effect of urban forms on outdoor temperature and ventilation (Hayashi et al. Citation2014), risk evaluation in case of fires (IIwami et al. Citation2006), and evaluating risks of evacuation in case of disasters such as earthquakes (Iijima and Mano Citation2009). The living environment have been covered in some studies, such as the one clarifying changes in human relationships in a neighbourhood by using a space restructuring system in an earthquake disaster rehabilitation land readjustment project (Tanaka, Shiozaki, and Horita Citation2007). However, like international studies, hardly any Japanese study has analyzed the physical characteristics of the busy streets in built-up areas to relay positive images and evaluate the relationship between street use frequency and residents’ images.
Thus, this study aims to reveal relationships between street use frequency by evaluating street reputation and physical characteristics of streets in Shinyo Neighborhood Nagata Ward, Kobe, as a step toward its redesign. In addition, the study aims at offering guidelines for redesigning such densely built-up areas.
2. Outline of the study
2.1. Study area
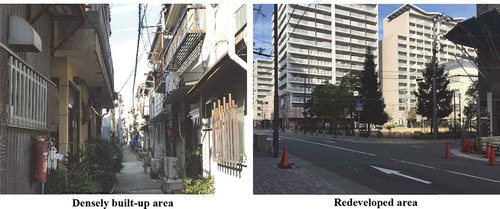
As a case study on densely built-up areas, this study focuses on the Shinyo Neighborhood Nagata Ward, Kobe, which has a lot of narrow streets and old wooden buildings (). A part of this neighbourhood suffered heavy damages from fires caused by the Great Hanshin Awaji Earthquake in 1995. Thus, the southern part of the area is currently densely built-up with some social problems, such as depopulation, an aging population, and an increase in empty houses and clear spaces. On the other hand, the northern and western sections have been redeveloped and redesigned following urban redevelopment projects in an effort to recover from damages caused by the earthquake, and these sections have facilities, such as train stations, subway stations, shopping streets, and marketplaces. Therefore, it has become a highly convenient location. The difference between the southern section and the northern and western sections is shown in through two contrasting images of a densely built-up area and a redeveloped area, respectively.
Figure 1. Target area
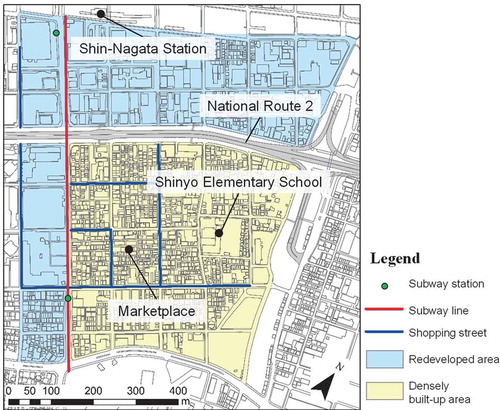
Figure 2. Images of target area
2.2. Methods
The following steps were performed:
Grasping the distribution of the amount of behaviours and route selection frequency by field observation and questionnaire survey;
Grasping the distribution of street images’ evaluation by questionnaire survey;
Analyzing the relationship between street use frequency and physical characteristics of streets;
Analyzing the relationship between evaluation of street images and physical characteristics of streets;
Following the above steps, this study acquired knowledge that would significantly contribute toward planning street spaces that are heavily used by people and project residents in good light.
3. Survey on amount of behaviours
3.1. Outline of survey
The target coverage of this survey was all 357 streets of Shinyo Neighborhood, Nagata Ward, Kobe, and was conducted every 2 hours from 06:00 to 18:00 for four days (two weekdays and two holidays), on October 2, 3, 5, and 6, 2010.
(a) Survey procedure
The target area was divided into plural areas and for each area, one or two investigators walked down all the streets and recorded the number of people on each street, and it was defined as “amount of behaviours.” The total length of the unit of analysis was measured from the center of one intersection to the center of the next nearest intersection.
(b) Survey items
The survey items included the following:
All age groups: toddlers, children, junior and senior high school students, adults, and senior persons.
behaviours: walking, bicycling, shopping, chatting, and others.
3.2. Results of the survey
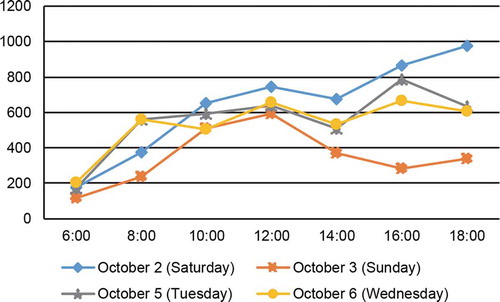
shows the time shift of the amount of all behaviours. Both weekdays showed the same trend. Although both holidays indicated the same trends until around 12:00, the amount of behaviour on October 3 (Sunday) gradually decreased at noon due to rain. Further, when focusing on the period between 6:00 and 8:00, the amount of behaviour on Sundays was significantly smaller than that on the other three days. This is likely because few people are active early on Sunday mornings, as compared to the other days.
Figure 3. Time shift of the amount of all behaviours
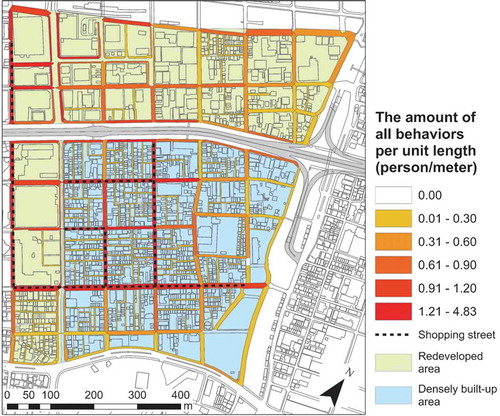
Next, for each street, the value of the total amount of behaviours for four days was divided by the length of street and defined as “amount of behaviours per unit length”; corresponding distribution maps were created. shows the distribution of the amount of all behaviours (all activities). In both areas, densely built-up and redeveloped, the amount of behaviour for each activity was higher on wider streets, particularly on shopping streets. Likewise, activity was lower in narrow alleys and cul-de-sacs. This is possibly because pedestrians and cyclists comprise the majority of behaviours and do not often use narrow streets en route to their destination, as they are considered private spaces for residents.
Figure 4. Distribution of the amount of all behaviours
4. Questionnaire survey
4.1. Outline of survey
The questionnaire survey was administered to residents to understand the evaluation of each street image in target areas and the route selection frequency. presents an outline of the survey. This survey used a blank map, and in addition to drawing shapes of streets and buildings, names of landmark buildings were written on the map.
Table 1. Survey outline
4.2. Survey route selection frequency
4.2.1. Survey outline
A total of 314 respondents answered the questionnaire that asked them to draw routes to places they often visited (school, workplace, store, hospital, station, etc.), means of transportation used (walk or bicycle), and purposes on the map. The route selection frequency was aggregated for each street.
4.2.2. Result of survey
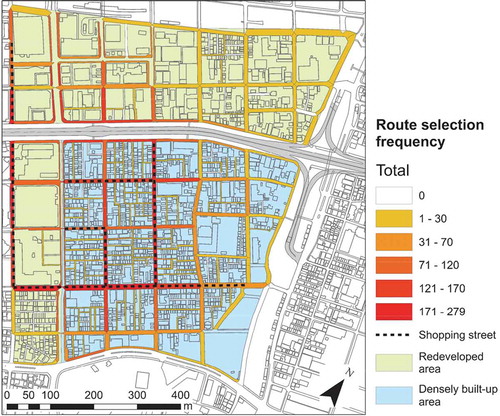
shows the distribution of the total route selection frequency. Like , in densely built-up and redeveloped areas, frequency was high on wide streets, particularly on shopping streets, while it was low on narrow streets. The reason for this could be the same as that mentioned in Section 3.2.
Figure 5. The distribution of total route selection frequency
4.3. Street image survey
4.3.1. Survey outline
The questionnaire asked respondents to indicate – by using the map – the streets which were perceived to have a good image (positive evaluation) and those with a bad image (negative evaluation), and to expand on the reasons for the same.
Using the KJ classification method, the responses were classified into positive and negative evaluations, namely the following eight factors: sanitation, safety, convenience, bustle, calmness, historicity, order, and others (Architectural Institute of Japan, Citation2010; Architectural Institute of Japan Citation2011).
Further, it is assumed that the frequency of indication differs by residents’ recognition degree of street spaces. Therefore, respondents were also asked to indicate places they were unfamiliar with on the map. The value of frequency of these indications was divided by the number of surveys collected to obtain the “non-recognition rate,” by using which, the frequency of indication was standardized with the following analysis.
X: Standardized frequency of indication
Y: Number of surveys collected
A: Frequency of indications
B: Non-recognition rate
4.3.2. Principal component analysis
In this section, principal component analysis was conducted by using the variables shown in as explanatory variables because correlation was found to exist among evaluation items.
Table 2. Element of principal component analysis
The analysis was conducted for each area in densely built-up areas and redeveloped areas, as it was believed that different tendencies could be observed between the results of both areas. Further, in Japan, although it was established that street width should generally be over four meters, according to the Building Standard Act, there were several positive aspects of densely built-up areas, such as those described in section 1. Therefore, the analysis of target streets in densely built-up areas was divided into two categories: all streets and those with a width of less than four meters. shows the results of the principal component analysis. As for analysis of positive evaluations for the category of all streets in densely built-up areas, “synthesis,” “comfort,” and “hygiene” were interpreted as the first, second, and third principal components, respectively. In terms of negative evaluations, “synthesis,” “inconvenience,” and “noisy” were interpreted as the first, second, and third principal components, respectively. Regarding analysis of positive evaluations for the category of streets with width under four meters, “synthesis,” “comfort,” and “hygiene” were interpreted as the first, second, and third principal components, respectively. For negative evaluations, “quiet,” “disorder,” and “danger” were interpreted as the first, second, and third principal components, respectively. Furthermore, regarding analysis of positive evaluations of streets in redeveloped areas, “synthesis,” “bustle,” and “hygiene” were interpreted as the first, second, and third principal components, respectively. As for negative evaluations, “synthesis,” “inconvenience,” and “quiet” were interpreted as the first, second, and third principal components, respectively. Using these principal component scores, the following analysis was performed.
Table 3. Result of principal component analysis
4.3.3. Distribution of the evaluation of street images
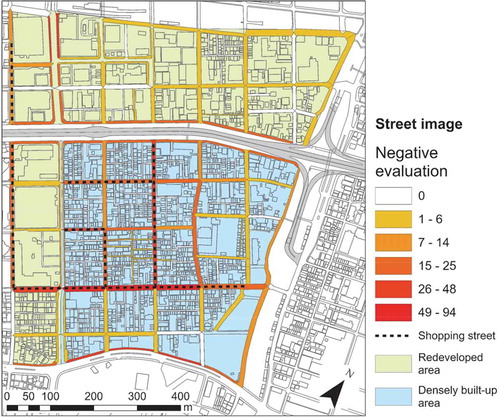
show the distributions of positive and negative evaluations of street images standardized by non-recognition rates. From these distributions, shopping streets and those with wider widths have many positive evaluations in densely built-up areas, along with wide streets in the west of the redeveloped area. On the other hand, although wide streets, particularly shopping streets, have many negative evaluations in both densely built-up areas and redeveloped areas, narrow alleys and cul-de-sacs did not indicate the same. This was because quite a few people regularly use streets neighboring shopping areas and those with wider widths; consequently, both streets receive several positive and negative evaluations. Further, positive evaluations were concentrated on narrow alleys and cul-de-sacs as such streets have fewer cars and bicycles and can be used as private spaces for residents and playgrounds for children, wherein residents can enjoy a sense of safety and peace.
Figure 6. Distribution of positive evaluation
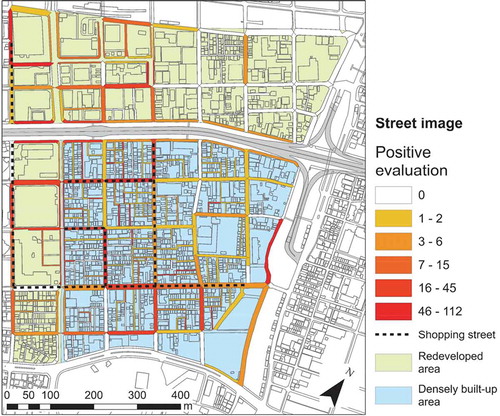
Figure 7. Distribution of negative evaluation
5. Analyzing the relationship between street use frequency and physical characteristics
5.1. Index of physical characteristics
5.1.1. Outline of index
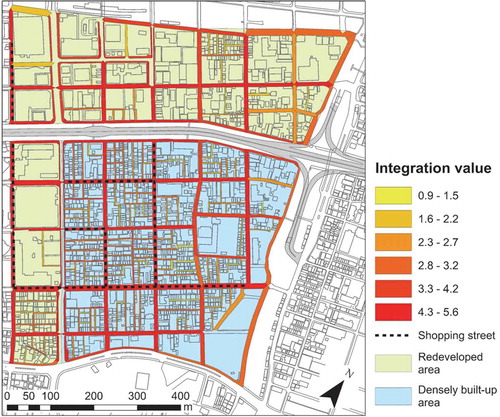
The index values that represented physical characteristics were selected () and calculated for all streets. The indices were set according to (1) street width, (2) building height along the street, and (3) ratio of building coverage along streets, and are chosen as typical indices of densely built-up areas (Usugi et al. Citation2010; Goto et al. Citation2009). Contrarily, (4) integration value is chosen because it is considered to have a correlation with the number of pedestrians (Hillier and Hanson Citation1984; Araya, Takeshita, and Ikezoe Citation2005). The rest of the indices, (5) ratio of extension of commodity, (6) distance to each station, and (7) presence or absence of shopping streets, were chosen because field work found that these seemed to have a correlation with street use frequency and evaluation of street images. Next, show the distribution of (1) street width, (2) building height along the street, (3) ratio of building coverage along the street, and (4) integration value. As for (1) street width (), although there are many wide streets in the redeveloped area, many narrow streets also exist, except for shopping streets. Regarding (2) building height along the street (), the value of densely built-up areas is not high, whereas in redeveloped areas, streets near the Shin-Nagata Station and western parts of the area have high buildings – over 40 meters. For (3) ratio of building coverage along the street (), in the redeveloped areas, although the values of some streets are high, half of the streets had values under 60%. On the other hand, in densely built-up areas, the value of many streets, including wide streets like shopping streets, was high and it was found that buildings stood close to each other. Regarding (4) integration value (), in both densely built-up areas and redeveloped areas, the value of the main wide streets is high and that of alleys and cul-de-sacs is low.
Table 4. Outline of the physical characteristics
Figure 8. Distribution of street width
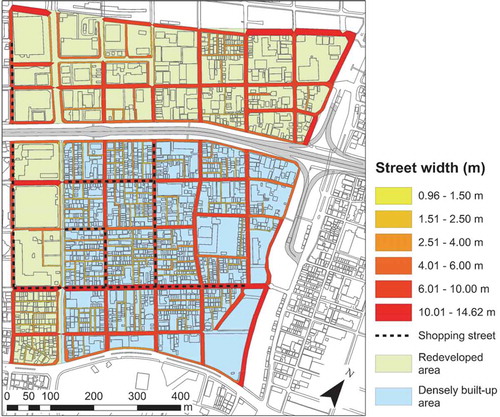
Figure 9. Distribution of building height
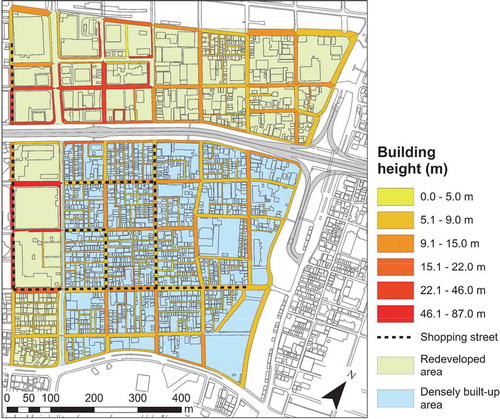
Figure 10. Distribution of the ratio of building coverage
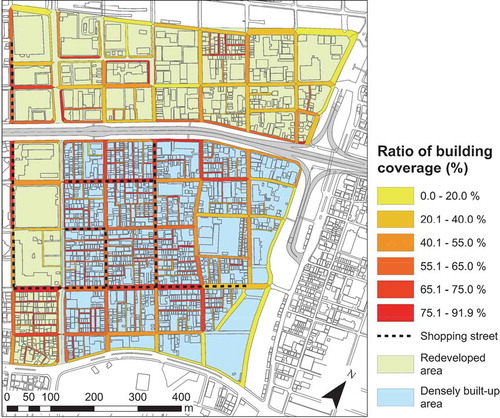
Figure 11. Distribution of integration value
5.1.2. Comparing indices of physical characteristics of densely built-up areas and redeveloped areas
shows the indices of the physical characteristics of both areas. The average value of street width in densely built-up areas is half of that in redeveloped areas and there are many narrow streets with a width of less than three meters. Average and maximum value of building height along streets in redeveloped areas is higher than that in densely built-up areas. The average value of the ratio of building coverage in densely built-up areas is over 60% and higher than that in redeveloped areas. The integration value representing the topological structure of streets in redeveloped areas is higher than that in densely built-up areas. As seen in , there are many main streets where the integration value is high in redeveloped areas.
Table 5. Data on physical characteristics
In terms of location characteristics, the average distance to each station in redeveloped areas is relatively lower. This area was found to be a highly convenient location. Overall, densely built-up areas and redeveloped areas differ greatly based on physical characteristics.
5.2. Analyzing the relationship between street use frequency and physical characteristics
To understand the relationship between street use frequency and the index of the physical environment, multiple regression analysis with stepwise method was conducted. In the analysis, for densely built-up areas and redeveloped areas, the amount of each behaviour per unit length and route selection frequency are defined as objective variables, and indices of the physical environment are defined as explanatory variables. Further, for analyzing densely built-up areas, to understand the influence of narrow alleys, target streets are divided into all streets and streets with a width under four meters.
Regarding densely built-up areas, 216 samples were surveyed for all streets, including those wider than four meters, 176 for streets under four meters wide, and 116 for those in redeveloped areas. The results are presented in and include only explanatory variables with a certain level of high standard partial regression coefficient.
Table 6. Results of multiple regression analyses
5.2.1. Densely built-up area
First, the multiple correlation coefficient of analysis for all streets is larger than that for streets with a width of under four meters in most items, and the interpretability of the multiple regression equation is relatively high. The number of behaviours and route selection frequency, integration value, and presence or absence of shopping streets were chosen as the explanatory variables for numerous items, and these effects were considered to be significant. It is considered that the effects of streets wider than four meters appeared greatly. This is because wide streets include main streets with a concentration of street use frequency, and such streets differ from narrow alleys, in terms of characteristics.
Next, as for items in the number of behaviours, most multiple correlation coefficient of analysis for streets less than four meters wide was less; however, street width was chosen as an explanatory variable in most items. Further, for the items of amount of walking and all behaviours, the presence or absence of shopping streets was chosen as an explanatory variable and a high volume of behaviours was found in wider streets and shopping streets because the standard partial regression coefficient was positive. Regarding the result of route selection frequency, the integration value was chosen as an explanatory item for all items. It can be concluded that route selection frequency tends to be higher in streets with a higher integration value. This is possibly because pedestrians and cyclists tend to choose wide streets and avoid narrow streets that are used as private spaces.
5.2.2. Redeveloped areas
As seen in , it can be concluded that wide streets and high integration value streets tend to be used frequently because like in densely built-up areas, street width was chosen as an explanatory variable for the resultant number of behaviours, the integration value was chosen as an explanatory variable for the result of route selection frequency in all items, and these standard partial regression coefficients were positive. The reason is considered akin to that for densely built-up areas.
5.2.3. Comparison of both areas
Regarding the amount of behaviours, both areas have a significant relationship with street width, and the standard partial regression coefficient is positive. Therefore, it can be said that the amount of behaviour tends to be large in streets that are wider. Further, depicts a huge difference in the average value of street width in densely built-up areas and redeveloped areas, and even if the influencing factors are identical, the characteristics of those streets are different.
As for route selection frequency, both areas have a significant relationship with the integration value, and the standard partial regression coefficient is positive. Therefore, it can be said that route selection frequency tends to be high in streets with a high integration value. Further, also indicates that, as there is a large difference in the average value of the integration value of both areas, characteristics of the streets are different, even if influencing factors, such as street width, are the same.
Overall, street use frequency is related mainly to street width and integration value in both areas. In the redesign of densely built-up areas, it is considered that street use frequency can be changed to a certain extent by the operationalization of street width. In addition, as there is a relationship between integration value and street use frequency, it is possible to improve the quality of space by creating a calm space on the street with low integration value or creating bustle on the street with high integration value.
6. Analyzing the relationship between the evaluation of street images and physical characteristics of streets
Multiple regression analysis with stepwise method was conducted for densely built-up and redeveloped areas. The principal component scores of positive and negative evaluations obtained in Section 4 were defined as objective variables; indices of physical characteristics in section 5.1 are defined as explanatory variables. To understand the effects of narrow alleys, the analysis of densely built-up areas is divided into two cases: all streets, including streets wider than four meters, and streets less than four meters wide.
For densely built-up areas, the number of samples of all streets, including those wider than four meters is 216, 176 for those less than four meters wide, and 116 for those in redeveloped areas. The results are presented in , and only explanatory variables with a certain level of high standard partial regression coefficient are included in this table.
Table 7. Result of multiple regression analysis
6.1. Densely built-up area
First, the multiple correlation coefficient of analysis for all streets, including streets wider than four meters is slightly larger than that for streets less than four meters wide in positive and negative evaluations. In addition, the influencing factors chosen as explanatory variables were different for streets less than four meters wide. This is possibly because the characteristics of streets more than four meters, including the main streets, such as shopping streets and narrow alleys less than four meters wide, differ greatly. Consequently, differences arise in multiple correlation coefficients and influencing factors.
Next, regarding the result of multiple regression analysis for streets less than four meters wide, although multiple correlation coefficients of positive evaluation are low, for items of synthesis and comfort, street width and the ratio of extension of commodity (planting) are chosen as explanatory variables. Since the standard partial regression of street width is negative, it is found that narrow streets tend to have many positive evaluations. Further, since the standard partial regression of the ratio of extension of commodity (planting) is positive, it is found that streets with a lot of extension of commodity (planting) tend to have many positive evaluations of comfort. Likewise, although multiple correlation coefficients of negative evaluation are low, for items of quiet and disorder, integration value, ratio of extension of commodity (planting), and street width are chosen as explanatory variables. Since the standard partial regressions of the ratio of extension of commodity (planting) and street width is negative and that of integration value is positive, it is found that narrow streets, streets with less extension of the commodity of planting, and streets with high integration tend to have many negative evaluations.
6.2. Redeveloped area
As seen in , for positive evaluation, items of synthesis, building height along the street and integration value are chosen as explanatory variables; in addition, explanatory variables selected for bustle and hygiene include distance to Shin-Nagata Station and integration value. Since the standard partial regression of building height along the street and integration value are positive, and distance to Shin-Nagata Station is negative, it is found that streets with tall buildings along streets, streets with high integration values, and streets near Shin-Nagata Station tend to have many positive evaluations. This is attributed to the fact that main streets with high integration value and those near the station that are relatively developed are in a highly convenient location, and it can be assumed that there are many positive indications regarding bustle and hygiene.
In terms of negative evaluation, for items of synthesis, inconvenience, and quiet, explanatory variables of the ratio of extension of commodity (planting), distance to Shin-Nagata Station, and ratio of extension of commodity (bench) are chosen, respectively. Since the standard partial regression of the ratio of extension of commodity (planting) and distance to Shin-Nagata Station are negative and the ratio of extension of commodity (bench) and integration value are positive, it is found that streets with less extension of the commodity of planting, streets near the station, and streets with high integration value tend to have many negative evaluations. This is possibly because, although streets near the station and the key streets with high integration value generally have a lot of people, there are many indications because people experience a quiet atmosphere with fewer people in these spaces.
6.3. Comparison of both areas
First, regarding positive evaluation, the distribution in densely built-up areas has a significant relationship with street width and the ratio of extension of commodity (planting). On the other hand, distribution in redeveloped areas has a stronger relationship with building height along streets and integration value. Therefore, it can be concluded that the influencing factors differ depending on the characteristics of the area.
Next, regarding negative evaluation, the distribution in densely built-up areas has a considerable relationship with integration value, ratio of extension of commodity (planting), and street width. On the other hand, the distribution in the redeveloped area has a considerable relationship with the ratio of extension of commodity (planting and bench), distance to Shin-Nagata Station, and integration value. Therefore, it is found that the integration value and ratio of extension of commodity (planting) are chosen as explanatory variables in both areas, but different influencing factors are also observed.
Thus, there are influencing factors common to both positive and negative evaluations. Moreover, different influencing factors can also be seen and those unique to densely built-up areas were observed. In densely built-up areas, the evaluation of street images can be improved by operating indices of physical characteristics, such as extension of commodity, integration value, street width, and so on.
7. Conclusion and discussion
The authors conducted a survey on the amount of behaviours and used a questionnaire survey to analyze the relationship between street use frequency, street image evaluation, and physical characteristics of streets in Shinyo Neighborhood Nagata Ward, Kobe as a step towards creating design guidelines for redesigning densely built-up areas. The main findings are described as follows:
The distribution of the amount of behaviours and total route selection frequency exhibited the same tendency and wide streets, particularly shopping streets, were high in both densely built-up areas and redeveloped areas. This was possibly because pedestrians and cyclists, who contribute most of the behaviours, do not often use narrow streets for traveling to their destination because such streets function as private spaces for residents.
In the evaluation of street images, the distribution of positive evaluations is high in wide streets, shopping streets, and parts of narrow alleys. The distribution of negative evaluations is high in wide streets and shopping streets, but narrow alleys have few indications. This seems to be because many people use shopping streets and wider streets in daily life, and evaluations concentrate on such streets. Further, positive evaluations concentrate on narrow alleys because such streets can be used as private spaces for residents and as playgrounds for children, and residents can enjoy a sense of safety and peace from such street spaces.
The results of multiple regression analysis indicated that street use frequency has a relationship with street width and integration value. In the redesign of densely built-up areas, it is considered that street use frequency can be changed to a certain extent by the operation of the physical environment and leads to an improvement in the quality of space.
From the results of multiple regression analysis, it can be understood that both positive and negative evaluations have a relationship with the integration value and the extension of the commodity of planting. In the redevelopment of densely built-up areas, the evaluation of street images can be improved by operating indices of physical characteristics, such as extension of commodity, integration value, street width, and so on.
In the future, this study can create guidelines for the improvement of street space in densely built-up areas by considering influencing factors of street use frequency and evaluation of street images. Furthermore, in addition to our focus areas in this study, we plan to propose a way to improve densely built-up areas by evaluating the disaster prevention performance and considering its diverse perspectives.
Acknowledgments
The authors would like to thank Mr. Masayuki Nishimura, Mr. Ken-ichi Masaoka and Dr. Masato Tanaka for supporting survey. We also thank to the residents in Shinyo Neighborhood. Finally, we are grateful to Ms. Kayo Emoto for contributing analysis.
Disclosure statement
No potential conflict of interest was reported by the authors.
Additional information
Notes on contributors
Takumi Yoshihara
Takumi Yoshihara is a Ph.D. Student at the Hiroshima University, and he is also working at the City of Hiroshima. His research field is urban planning.
Takahiro Tanaka
Takahiro Tanaka is a Professor at the Hiroshima University. He is a Ph.D., recieved from the Yokohama National University. His research fields are urban planning, urban environment, urban science and GIS.
Shusuke Inachi
Shusuke Inachi is an associate Professor at the Setsunan University. He is a Ph.D., received from the Kobe University. His research interests are architectural planning and urban environmental design.
Hiroaki Saito
Hiroaki Saito is a senior staff of Innovation Center, Toda Corporation. He is a M.Eng, graduated from Graduate School of Tokyo Institute of Technology and Hiroshima University. His interests are architecture system and management.
References
- Araya, R., T. Takeshita, and M. Ikezoe 2005. “Analysis of Open Space in Urban Area Based on Space Syntax Theor.” Journal of Planning (Transactions of AIJ) 70 (589): 153–160. (in Japanese). doi:https://doi.org/10.3130/aija.70.153_2.
- Architectural Institute of Japan. 2010. Introduction to Environmental Psychological Survey Methods for Better Environment Creation. Tokyo, Japan: Gihodo Publication. (in Japanese).
- Architectural Institute of Japan. 2011. Design of Survey to Make House and Town -interview/questionnaire/guide of Psychological Experiment. Tokyo, Japan: Ohmsha. (in Japanese).
- Chen, T., E. Hui, J. Wue, W. Lang, and X. Li 2019. “Identifying Urban Spatial Structure and Urban Vibrancy in Highly Dense Cities Using Georeferenced Social Media Data.” Habitat International 89: 102005. doi:https://doi.org/10.1016/j.habitatint.2019.102005.
- Cho, P., and M. Sawaki. 2007. “Study on the Neighborhood Characteristics of High-Density Hillside Areas through Common Space -A Case Study on an On-the-Spot Improvement Program District of the Housing Environment Amelioration Program in Busan, Korea.” Journal of Asian Architecture and Building Engineering 6: 111–118. doi:https://doi.org/10.3130/jaabe.6.111.
- Dankwa, E., A. Nathan, A. Barnett, L. Busija, and R. Lee. 2019. “Walking Behavior and Patterns of Perceived Access to Neighborhood Destinations in Older Adults from a Low-density (Brisbane, Australia) and an Ultra-dense City (Hong Kong, China).” Cities 84: 23–33. doi:https://doi.org/10.1016/j.cities.2018.07.002.
- Goto, O., A. Sekizawa, T. Miura, and M. Murakami. 2009. Soredemo “Mokumitsu” Ni Sumitsuduketai! -rojiura De Anzenni Kurasutame No Bousaimachidukuri No Gokui- (Still, I Would like to Continue Living in “Mokumitsu” -the Essence of Disaster Town Planning to Live Safely in the Back Alley-). Tokyo, Japan: Shokokusha. (in Japanese).
- Hayashi, K., T. Tanaka, S. Inachi, and M. Yasukawa. 2014. “Analysis on the Effect of Urban Form on Outdoor Temperature and Ventilation Condition in Coastal Densely Wooden Built-Up Area.” Journal of Environmental Engineering (Transactions of AIJ) 79 (698): 349–356. (in Japanese). doi:https://doi.org/10.3130/aije.79.349.
- Hillier, B., and J. Hanson. 1984. The Social Logic of Space. Cambridge, United Kingdom: Cambridge University Press.
- Iijima, Y., and Y. Mano. 2009. “The Condition and the Improvement Method of Risk in the Evacuation Routes in case of Emergency in Crowded Residential Area with Wooden Structure.” Journal of the City Planning Institute of Japan 44(3): 283-288. (in Japanese).
- Iwami, T., T. Kurabuchi, Y. Hayashi, and S. Nishizawa. 2006. “Study on Fire Situation in Consideration of the Wind Flow in a Built-up Area.” Journal of the City Planning Institute of Japan 41(3): 851-856. (in Japanese).
- Lai, Y., and C. Kontokosta. 2018. “Quantifying Place: Analyzing the Drivers of Pedestrian Activity in Dense Urban Environments.” Landscape and Urban Planning 180: 166–178. doi:https://doi.org/10.1016/j.landurbplan.2018.08.018.
- Ogata, S., H. Murata, M. Fukumoto, S. Nishizawa, W. Katsumata, and T. Iwami 2013. “The Development of a Tool to Simply Evaluate Ventilation Performance in Densely Built-up Area Part 1) the Development Direction of the Tool.” Summaries of Technical Papers of Annual Meeting, Architectural Institute of Japan D-2: 767–768. (in Japanese).
- Ramyar, R., A. Ramyar, Y. Kialashaki, and H. Ramyar. 2019. “Exploring Reconfiguration Scenarios of High-density Urban Neighborhoods on Urban temperature–The Case of Tehran (Iran).” Urban Forestry & Urban Greening 44. doi:https://doi.org/10.1016/j.ufug.2019.126398.
- Samuelsson, K., M. Giusti, G. Peterson, A. Legeby, and S. Brandt. 2018. “Impact of Environment on People’s Everyday Experiences in Stockholm.” Landscape and Urban Planning 171: 7–17. doi:https://doi.org/10.1016/j.landurbplan.2017.11.009.
- Shi, Z., S. Hsieh, J. Fonseca, and A. Schlueter. 2020. Street Grids for Efficient District Cooling Systems in High-density Cities. Sustainable Cities and Society 60: 102224. doi:https://doi.org/10.1016/j.scs.2020.102224
- Tanaka, M., Y. Shiozaki, and Y. Horita. 2007. “Study on the Spatial Restructuring System by the Urban Area Reconstruction Project and the Change of Human Relation in the Neighborhood: The Case of the Misuga District on the Great Hanshin-Awaji Earthquake.” Journal of Planning (Transactions of AIJ) 79 (618): 65–72. (in Japanese). doi:https://doi.org/10.3130/aija.72.65_3.
- Usugi, K., J. Aoki, K. Iseki, and T. Okamoto. 2010. Machirojisaisei No Dezain -rojinimanabuseikatsukuukan No Saiseijutsu- (Design of Town and Alley Regeneration -regeneration Technique of Living Space to Learn in Alley-). Tokyo, Japan: Shokokusha. (in Japanese).
- Xue, F., Z. Gou, and S. Lau. 2017.“Green Open Space in High-dense Asian Cities: Site Configurations, Microclimates and Users’ Perceptions.” Sustainable Cities and Society 34: 114–125. doi:https://doi.org/10.1016/j.scs.2017.06.014.
- Yung, E., S. Conejos, and E. Chan. 2016. “Public Open Spaces Planning for the Elderly: The Case of Dense Urban Renewal Districts in Hong Kong.” Land Use Policy 59: 1–11. doi:https://doi.org/10.1016/j.landusepol.2016.08.022.