
ABSTRACT
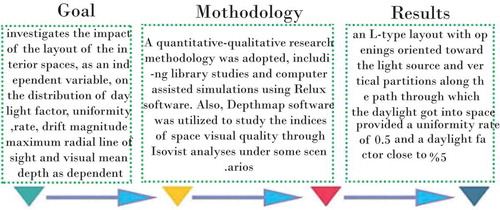
This research investigates the impact of the layout of the interior spaces, as an independent variable, on the distribution of daylight factor, uniformity rate, drift magnitude, maximum radial line of sight and visual mean depth as dependent variables in medical centers. A quantitative-qualitative research methodology was adopted, including library studies and computer-assisted simulations using Relux software. Also, Depthmap software was utilized to study the indices of space visual quality through Isovist analyses under some scenarios. Results indicated that the appropriate and utilization-oriented layout of interior elements takes a significant part in improving the space visual quality experienced by the users. In this study, an L-type layout with openings oriented toward the light source and vertical partitions along the path through which the daylight got into space was presented as a suitable plan for medical centers as far as optimal and appropriate distribution of daylight within standard ranges were concerned. This layout provided a uniformity rate of 0.5 and a daylight factor close to 5%, with the indicators of space visual quality being more favorable, as compared to the other layouts considered in this study.
Graphical Abstract
1. Introduction
Utilization of natural light and heat from the sun through appropriate solutions during the day can largely address the users' demands for lighting applications while preserving the balance in the environment (Kurian et al. Citation2008; Doulos, Tsangrassoulis, and Topalis Citation2008; Loutzenhiser, Maxwell, and Manz Citation2007). Daylight is an important and much-regarded element for those who are looking to obtain a standard certificate for Leadership in Energy and Environment Design (LEED) (Sharp et al. Citation2014). Appropriate lighting of spaces represents an always-concerned topic for designers in both qualitative and quantitative aspects. As such, they have been continuously attempting to take advantage of daylight to bring about visual, mental, and physical comfort for the users (Altomonte Citation2008). As a resource, the sun is a necessary element for providing humans with vision and a rhythm of life. The motion of the sun determines our perception of the world. Therefore, the sun is an essential element to enhance the quality of life. Solar radiation is an important component of the climate and human comfort in both indoor and outdoor spaces, so that failure to account for the sunlight in buildings or outdoor spaces can end up with a sense of discomfort (Van Esch, Looman, and de Bruin-hordijk Citation2012). A lot of researchers around the world have performed numerous studies on the daylight administration. A summary of such studies has been mentioned in the following. Cotegen, Veitch, and Newsham (Citation2008) presented research based on questionnaires and computer-assisted simulations to evaluate the effect of daylight intensity and duration on the employees’ satisfaction in-office plans. The results showed that the variation of the daylight intensity during the day imposed positive impacts on the qualitative range of vision, visual comfort, and the employees’ satisfaction. They further suggested that the appropriate window size depends on the user’s distance to the window, the window height, the line of sight, and the type of sight. Users tend to capture a full vision of the object; that is, why they tend to go for wider windows if they are relatively close to the exterior objects and rather opt for narrower windows when they are relatively far from the exterior scene (Cotegen, Veitch, and Newsham Citation2008). In 2014, Yu et al. published research where they stipulated that the efficiency of the daylight and visual comfort depends on such important factors as the geometry of the room, window-to-wall ratio, surface reflections, and exterior obstacles. The research has studied the annual sunlight of a training building in Nottingham (England) using field measurements and Relux software (Yu, Su, and Chen Citation2014). In another work, Rahman Jorder investigated the effect of daylight in medical spaces on the patient treatment process (Joarder and Rahman Citation2011). Aripin presented a study where the impact of daylight at hospitals was investigated (Aripin Citation2007). Richard reported extensive research on the evolution of the plan of future medical centers (Wolper Citation2012). Also, the following studies have focused on Isovist analysis around the world. The term Isovist (visual context) was coined by Tady (Tandy and Murray Citation1967). Benedikt (Citation1979) worked on the Isovist properties to describe the environment with quantitative dimensions. He believed that the Isovist contexts could measure some fundamental spatial qualities of the environment, whose conscious or unconscious perception established a more complete basic descriptive understanding of the environment (Benedikt Citation1979). In the post-Benedikt and Davis research works, the Isovist analysis served as an exact methodology for producing the Isovist polygons, the foundation of deterministic mathematics evaluations, developed graphical presentation of data, and true concept of the Isovist (Davis and Benedikt Citation1979). Looking to establish relationships among experienced qualities at architectural spaces considering the spatial form and visual contexts (Isovist), Frenz and Winer used the environmental preference theory and suggested that there is a significant relationship between the spatial characteristics and the perceptual response to the physical space (Franz, von der Heyde, and Bülthoff Citation2004)., Winer et al. showed that Isovist analysis methodology provides a promising tool for visioning the experienced architectural quality and motion in the space. Following the sanctuary landscape criteria, they asked the participants to move through a virtual art gallery and select the best location to hide and make observations (Wiener and Franz Citation2005). An important theory for investigating the visual quality of the space is the subjective focus reconstruction theory proposed by Kaplan. According to this theory, arbitrary focus leads to mental fatigue. Based on a series of research by Kaplan, however, the mental fatigue can be improved provided the reconstructive environment offers the following four features: departing from the ring of focus, extending the field of view, fascination and attraction, customization of the environment to the individuals’ demands (Kaplan and Kaplan Citation2003). In another piece of research, solitude has been referred to as a factor contributing to the subjective reconstruction. Humans need minimum degrees of mental turbulence along with solitude before they can perform activities appropriately; in the design stage, these are usually provided by creating privacies and sanctuaries for solitude (Evans and McCoy Citation1998).
According to research background, it can be concluded that few researches so far have studied the function of daylight, energy consumption and Layout of internal spaces (architectural plan) in medical spaces. Actually, all these three variations have not been investigated simultaneously in recent studies so far, but they are investigated in this paper. Therefore, it contributes to the novelty of the present research whose results can help to the codification of related national codes and publications. Moreover, since that the daylight contributes to the users’ efficiency, satisfaction and patients’ treatment directly, the provision of adequate sunlight should be a priority when designing a medical space. It leads to higher visual and mental satisfaction levels among different groups of individuals, thanks to the appropriate distribution of the daylight. On the other hand, most of the researches on lighting have used the daylight factor and uniformity rate as dependent variables to evaluate visual comfort and daylight distribution. Therefore, the present research considers the role of architectural plan or interior space layout in medical centers, as an independent variable, on the evolution of the dependent variables of the research such as daylight factor, uniformity rate and indicators of space visual quality to achieve visual optimal conditions for users. For this purpose, basic studies were performed and computer-assisted simulations were run by Relux and Depthmap software. Also, the Isovist software was further used to study the visual quality indicators under the studied scenarios. Finally, based on the obtained results, the optimal scenario in terms of daylight and visual quality of the space was presented.
2. Material and methods
This research includes three steps. First: library studies about daylighting, visual comfort and research background. Second, computer-assisted simulations by Relux software to evaluate the daylight indicators such as daylight factor (DF) and uniformity rate (Uo). Third: analyze by Depthmap software to investigate the space visual quality indicators through the Isovist methodology. In this way, the various proposed models of internal space layout for medical centers were simulated and analyzed, using the mentioned software tools, in terms of the daylight distribution, visual comfort and quality. Finally, the results were analyzed to present an optimal layout of daylighting and maximum visual comfort and quality for medical spaces. Focusing on visual quality, Isovist analyses were conducted using Depthmap software to investigate various scenarios and introduce the optimal one. In this regard, considering the objectives of the present research and closeness and overlapping of particular Isovist characteristics (to avoid possible reworks while respecting the type of spatial experience associated with each Isovist characteristic), among others, three Isovist characteristics, namely the drift angle, the maximum radial line of sight, and visual mean depth, were directly derived from the Depthmap software. To measure these three indicators, the models have meshed with 0.5 × 0.5 m grids and the values of all indicators were evaluated at the center of each grid. After that, statistical analysis using SPSS software was done. The Relux software was utilized as it serves as a computational tool for investigating the daylight in interior rooms under clear/cloudy sky. As output, Relux gives 3D information of the room, 3D and 2D information on the distribution of brightness on all walls, minimum, maximum and mean values of the daylight factor and brightness intensity, light color distribution across interior spaces under different sky conditions, room geometries, and room configuration (Bhavani and Khan Citation2011). Moreover, a wide spectrum of reflections from and transmittances through the actual surfaces and 3D demonstrations of the spaces, isolux, and brightness distribution curves, output sheets, the 3D graph of the brightness and the sun height, and the list of results were investigated at all points. The computational engine of this software works based on Radiance software where the ray tracing process is performed to simulate high-quality images. The software further uses radiosity techniques for handling the data (Ruggiero, Florensa, and Dimundo Citation2009). Relux has been validated by comparing its results to those of SPOT and Daysim software packages, indicating the superior processing speed of Relux over the SPOT and Daysim, which were somehow time-intensive and costly (Iversen et al. Citation2013). presents the flowchart of the research.
Figure 1. Flowchart of the present research (Source: authors)
2.1. Validation
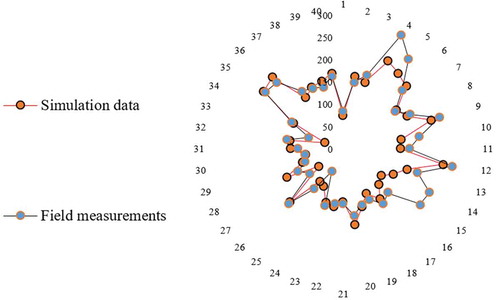
The Relux software used in this research was validated by measuring the brightness intensity on a real model. For this purpose, a room with the dimensions of 4 × 4 × 3.2 m (width × length × height) with a south-facing opening of 1.5 × 1.5 m at a height of 1.2 cm above the floor was considered. Oriented along a north-south direction, the room had its walls painted in white and its floor finished with cement. The brightness intensity was measured using a lux meter in absence of any artificial light at 40 points across the room at 11 a.m., May 21th, 2020. After that, the real model was simulated in Relux software. In the measurement and modeling stages, efforts were made to keep the model free of any factor that might introduce error into the final results. Ultimately, the measured data were compared to the simulation results, with the outcomes presented in . The results indicated similar trends of behaviors in both the measured data and the simulation results with only minor difference between the corresponding values. It confirms the simulation results in this paper. Also, the visual quality indicators utilized in this paper and the experiential properties that are conventionally associated with them are listed in . The correlation between experiential and measured properties proposed is confirmed based on the findings of past research.
Table 1. Visual quality indicators related to spatial experience (Ostwald and Dawes Citation2013; Meilinger, Franz, and Bulthoff Citation2012)
Figure 2. A comparison between the measured Illuminance(Lux) and that obtained from the simulation in real model (Source: authors)
3. Daylight and visual comfort
The source of sunlight is the sky outside of the building. The presence of windows and skylights is necessary for the receipt of adequate daylight to address spatial needs for light from the sky. Since the sky is, indeed, an always-varying source of light depending on the weather conditions and the time along the day, it is relatively difficult to formulate a single design for a specific level of brightness based on the daylight only. Therefore, instead of calculating exact levels of light (in foot-candle or lux) in the space, a daylight factor has been introduced to measure the relative level of light (Kilic and Hasirci Citation2011). According to the following equation (Tagliabue, Buzzetti, and Arosio Citation2012), the daylight factor is the ratio of the brightness at a specific point in the space to the brightness in an outdoor space with identical sky conditions, which is expressed in percentage. Appropriate daylight for human activities corresponds to daylight factor (DF) in the range of 2–6%. Accordingly, daylight factors below 2% deem as inadequate while those beyond 6% lead to dazing (da Fonseca, Didoné, and Pereira Citation2013). A mean daylight factor of 4–5% is appropriate for reading spaces (Alrubaih et al. Citation2013). Therefore, in the analyses performed in this research, the daylight factor was used as the dependent variable to evaluate the impact of the plan and layout of interior spaces on the input daylight to space. On the other hand, the continuously varying nature of daylight provides the space with brightness and contrast, letting the eye get continuously adapted to high intensities of light without causing visual discomfort. This spontaneous adjustment mitigates eye fatigue (Yu, Su, and Chen Citation2014). The general sense of comfort is a result of assessments made by the human senses. Visual comfort across an environment depends on the sense of sight, perception, space geometry, and its compatibility with different activities undertaken by the occupants. In total, the optimization of visual characteristics of interior spaces is the primary step toward achieving visual comfort. Visual comfort is improved when the visual messages are received from the visual environment. The design of the building must help achieve the visual comfort. The conditions of visual comfort can be met by providing the required brightness and uniform light distribution while preventing possible glare. If these values are not provided by the daylight, artificial light sources are needed. The visual comfort refers to the provision of comfort for the sense of sight at all positions and mitigation of eye fatigue. Visual comfort of a space is directly linked to the contrast and variability of the brightness across space. To achieve visual comfort, there should be a graded spectrum of light from the outdoor space to the indoor space with moderate brightness intensity. Therefore, visual comfort is investigated via uniformity rate (Uo) variable (Ruggiero, Florensa, and Dimundo Citation2009).
4. Result
4.1. Daylight factor and uniformity rate
This section describes and analyzes the various modeling of internal space layout under the considered scenarios. For this purpose, the effects of different plans and layouts of interior spaces at medical centers on the distribution of daylight factor and uniformity rate were studied by Relux software. presents the 10 different scenarios, in terms of the layout of interior spaces, considered in this study. present the results for; daylight factor and uniformity rate; the dependent variables of this research.
Figure 3. Details of plans and layouts of interior spaces of a typical medical center under various scenarios considered in the simulation stage states, 2005))
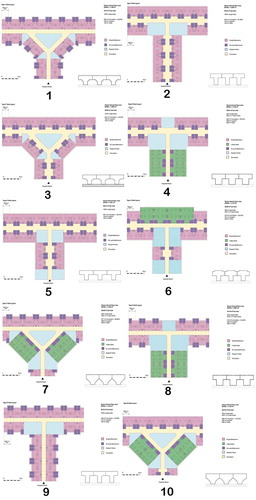
Figure 4. Brightness distribution (daylight factor) under different scenarios (Source: authors)
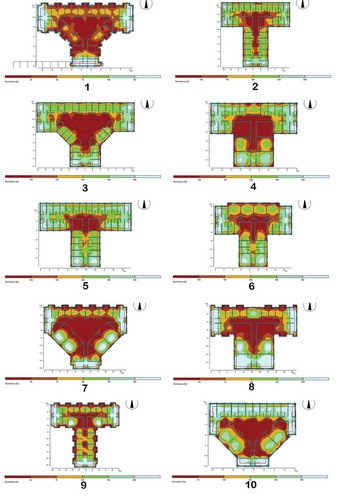
Figure 5. Results of daylight factor distribution and uniformity rate under the 10 scenarios studied in this research (Source: authors)
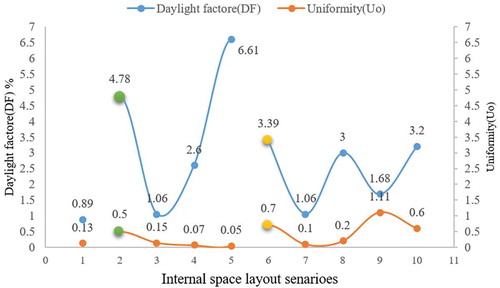
As mentioned, daylight factors in the range of 2–5% indicate the suitable condition for a bright space. In , this implies that internal space layout for scenarios 2, 6, 8, and 10 has provided more balanced lighting conditions, as compared to the other scenarios. Hence, in these scenarios, daylight factor value is more close to standard range, and they have made a better visual space. While scenarios 1, 3, 4, 7, and 9 have led to too low values of daylight factor. Also, in scenario 5, this value is out of the standard range for the daylight factor (too bright). On the other hand, the value of the uniformity rate closer to 1 is more favorable in terms of daylight distribution. This means the standard range for uniformity rate is between 0 and 1 and closer to 1 is more favorable. In this respect, among the considered scenarios, scenario 9 is out of the standard range, while scenarios 2 and 6 produced the closest rates to 1 as compared to the other scenarios. Therefore, among the 10 scenarios considered in this study, scenarios 2 and 6 led to the best responses for both of the daylight factor (DF) and the uniformity rate (Uo). Going into more detail, it can be figured out that scenario 2 has provided superior results in terms of daylight distribution in various interior layouts and established further lighting balance for the users in different directions of internal space. Indeed, neither space of too high nor too low brightness is observable across the plan, and a rather balanced distribution of the daylight is dominant in most of the spaces. Besides, the very small deprived areas of the daylight could also be improved utilizing appropriate artificial light. Ultimately, this optimal distribution of daylight across space in scenario 2 layout could improve visual comfort in internal spaces for users and satisfy the research goals.
4.2. Visual quality indexes in the Isovist and Depthmap software
In this section, the analyzation of three Isovist indicators and their correlation to two other variables are discussed. According to , three indicators of drift magnitude, maximum radial line and Visual Mean depth have analyzed by Depthmap software through Isovist methodology for various layouts of medical centers in . Also, the correlation of the daylight factor and uniformity rate with these three Isovist indicators was performed in the SPSS software. presents the results for the three Isovist indicators and compares them for the 10 scenarios considered in this paper.
Figure 6. Demonstration of the maximum radial line of sight under different scenarios (Source: authors)
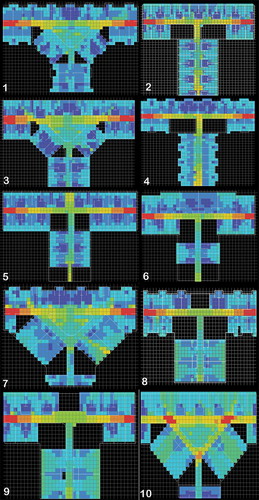
The Isovist drift angle index (drift magnitude (DM)) describes the distance from the spectator point to the center of mass of the Isovist polygon. Actually, this index offers the visual tension and orientation at the point where spectator is supposed there. Based on , scenario 5 shows the highest value of this index. Higher values of this index indicate the divergence of the interior design from the center of space and getting farther from congestion, which presents a more scattered spatial division to space Centre. Also, it is one of the favorite spatial properties due to mental focus reconstruction theory.
Figure 7. Results of the three Isovist indices under the 10 scenarios studied in this research (Source: authors)
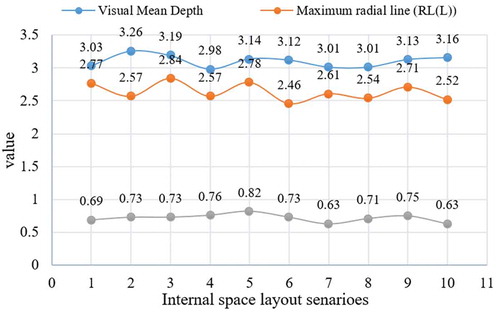
The maximum radial line (RL(L)) of sight index refers to the longest possible line of sight, which is about the experience of the scene. According to , scenario 3 provides the maximum radius of sight across space which makes a more utility space due to the mental focus reconstruction theory.
The visual mean depth index offers separation of spectator point from the whole of configuration. This index is connected with the spatial experience of isolated space. The highest value of this index was encountered under scenario2.
Pearson’s test in the SPSS software was used to identify the correlation between different research variables due to data. In , the correlation or decorrelation coefficients have investigated at a significance level of α = 0.05. When the correlation coefficient (ρ) is closer to 1, the correlation between two variables in straight direction is more. Also, when the correlation coefficient (ρ) is closer to −1, the correlation between two variables in inverse direction is more. As well as, when the correlation coefficient is equal to 0(ρ = 0), there is not any correlation between the two variables. shows the output of Pearson’s test. It indicates correlation coefficient (ρ) between the three Isovist indicators and the two daylight indexes at a significance level of 0.01. Therefore, the maximum radial line of sight index has an inversely related and negative correlation coefficient to the daylight factor and uniformity rate. On the other hand, the visual mean depth index exhibits a positive correlation to the daylight factor and uniformity rate. Also, the drift angle was found in a positive correlation to the daylight factor and a negative correlation to the uniformity rate. Therefore, the visual mean depth has a positive and direct correlation to the daylight factor and uniformity rate. Ultimately, it figures out that scenario 2 is more balanced to various research variables. Indeed, it can be inferred that the layout of interior spaces under this scenario provides superior spatial division in terms of preserving privacy and territories.
Table 2. Demonstration of the correlations between different variables of the research (Source: authors)
5. Conclusion
In this paper, an analytic-descriptive approach was followed, and computer-assisted simulations were run by Relux and Depthmap software to investigate the effect of plan and layout of interior spaces on daylight distribution and space visual quality in medical centers. Various types of architectural plan (layout of the interior spaces), as an independent variable, and daylight factor (DF), uniformity rate (Uo), drift magnitude, maximum radial line and visual mean depth as dependent variables were considered. Due to 10 various layouts in two stages of the research, the following conclusions were obtained. The minimum standard range for uniformity rate (Uo) and daylight factor (DF) is 0.6% and 2%. Besides, for medical space, the average daylight factor should be 4% to 5% and any value beyond 6% would be unacceptable. Hence, in terms of natural daylight distribution, scenarios 2 and 6 were found that return more balanced amounts of daylight (daylight factor index (DF)) and provide better visual qualities (uniformity rate (Uo)). Also, it was evident that scenario 2 provides a better balance between different variables and is the optimal layout of interior spaces in terms of Daylight factor and uniformity rate. Based on the obtained values of visual quality by Isovist analysis in the Depthmap software, it was found that scenario 3 returns the highest value of the radial line of sight. According to the subjective focus reconstruction theory, this leads to the higher utility of such spaces. The visual mean depth index was the highest under scenario 2. Also, scenario 5 showed the highest value of the Isovist drift angle index. Ultimately, due to Pearson’s correlation test in the SPSS software, it founded that scenario 2 is the optimal interior layout in medical centers. Indeed, it can be inferred that a change to the layout of architectural space can provide superior spatial division in terms of preserving the privacy and territories, and appropriate distribution of daylight led to enhanced daylight distribution and visual quality across space. The results of this research indicate that the interior layout type of architectural plans makes a significant impact on the distribution of daylight and space visual quality indicators in medical centers.
Acknowledgments
Thanks to authors for providing relevant technical information.
Disclosure statement
The authors declare that they have no known competing financial interests or personal relationships that could have appeared to influence the work reported in this paper.
The authors declare the following financial interests/personal relationships which may be considered as potential competing interests.
Correction Statement
This article has been republished with minor changes. These changes do not impact the academic content of the article.
Additional information
Notes on contributors
Seyede Rahime Mousavi Asl
Seyedeh Rahimeh Mousavi Asl lives in Giulan (from the northern cities of Iran). He have an academic education in two fields of anesthesia and architecture. He have always been looking for a way to use these two fields together.
Hossein Safari
Hossein Safari is an Iranian Architect, born in 1976. He has obtained his Ph.D. degree from Universiti Teknologi Malaysia (UTM), Faculty of Built Environment in 2014. He is currently an Assistant Professor at Islamic Azad University of Rasht Branch. He joined faculty of School of Graduate Studies and Technical Complex Since 2014. His current research interests include Wayfinding, Cognitive Map, Legibility, Geometry, and Space Syntax. Along his career, he has been also a technical reviewer at some international journals.
References
- Alrubaih, M., M. F. M. Zain, M. Alghoul, N. L. N. Ibrahim, M. Shameri, and O. Elayeb. 2013. “Research and Development on Aspects of Daylighting Fundamentals.” Renewable and Sustainable Energy Reviews 21: 494–505. doi:https://doi.org/10.1016/j.rser.2012.12.057.
- Altomonte, S. 2008. “Daylight for Energy Savings and Psycho-physiological Well-being in Sustainable Built Environments.” Journal of Sustainable Development 1 (3): 3–16.
- Aripin, S. 2007. “Healing Architecture: Daylight in Hospital Design.” Paper Presented at the Conference on Sustainable Building South East Asia, Malaysia, November 5–7.
- Benedikt, M. L. 1979. “To Take Hold of Space: Isovists and Isovist Fields.” Environment and Planning B: Planning and Design 6 (1): 47–65. doi:https://doi.org/10.1068/b060047.
- Bhavani, R., and M. Khan. 2011. “Advanced Lighting Simulation Tools for Daylighting Purpose: Powerful Features and Related Issues.” Trends in Applied Sciences Research 6 (4): 345–363. doi:https://doi.org/10.3923/tasr.2011.345.363.
- Cotegen, D., J. Veitch, and G. Newsham. 2008. “View Size and Office Illuminance Effects on Employee Satisfaction.” Proceedings of Balkan Light: NRCC-50852: 243–252.
- da Fonseca, R. W., E. L. Didoné, and F. O. R. Pereira. 2013. “Using Artificial Neural Networks to Predict the Impact of Daylighting on Building Final Electric Energy Requirements.” Energy and Buildings 61: 31–38. doi:https://doi.org/10.1016/j.enbuild.2013.02.009.
- Davis, L. S., and M. L. Benedikt. 1979. “Computational Models of Space: Isovists and Isovist Fields.” Computer Graphics and Image Processing 11 (1): 49–72. doi:https://doi.org/10.1016/0146-664X(79)90076-5.
- Doulos, L., A. Tsangrassoulis, and F. Topalis. 2008. “Quantifying Energy Savings in Daylight Responsive Systems: The Role of Dimming Electronic Ballasts.” Energy and Buildings 40 (1): 36–50. doi:https://doi.org/10.1016/j.enbuild.2007.01.019.
- Evans, G. W., and J. M. McCoy. 1998. “When Buildings Don’t Work: The Role of Architecture in Human Health.” Journal of Environmental Psychology 18 (1): 85–94. doi:https://doi.org/10.1006/jevp.1998.0089.
- Franz, G., M. von der Heyde, and H. H. Bülthoff. 2004. “Predicting Experiential Qualities of Architecture by Its Spatial Properties.” Paper Presented at the Proceedings of 18th IAPS-Conference, Vienna, Austria, January.
- Iversen, A., N. Roy, M. Hvass, M. Jørgensen, J. Christoffersen, W. Osterhaus, and K. Johnsen. 2013. Daylight Calculations in Practice: An Investigation of the Ability of Nine Daylight Simulation Programs to Calculate the Daylight Factor in Five Typical Rooms. Copenhagen: SBI forlagI; Danish Building Research Institute Aalborg University.
- Joarder, M., and A. Rahman. 2011. Incorporation of Therapeutic Effect of Daylight in the Architectural Design of In-patient Rooms to Reduce Patient Length of Stay (Los) in Hospitals. Bangladesh University of Engineering and Technology, Central Library. http://lib.buet.ac.bd:8080/xmlui/handle/123456789/3528
- Kaplan, S., and R. Kaplan. 2003. “Health, Supportive Environments, and the Reasonable Person Model.” American Journal of Public Health 93 (9): 1484–1489. doi:https://doi.org/10.2105/AJPH.93.9.1484.
- Kilic, D. K., and D. Hasirci. 2011. “Daylighting Concepts for University Libraries and Their Influences on Users’ Satisfaction.” The Journal of Academic Librarianship 37 (6): 471–479. doi:https://doi.org/10.1016/j.acalib.2011.07.003.
- Kurian, C. P., R. S. Aithal, J. Bhat, and V. George. 2008. “Robust Control and Optimisation of Energy Consumption in Daylight—Artificial Light Integrated Schemes.” Lighting Research & Technology 40 (1): 7–24. doi:https://doi.org/10.1177/1477153507079511.
- Loutzenhiser, P. G., G. M. Maxwell, and H. Manz. 2007. “An Empirical Validation of the Daylighting Algorithms and Associated Interactions in Building Energy Simulation Programs Using Various Shading Devices and Windows.” Energy 32 (10): 1855–1870. doi:https://doi.org/10.1016/j.energy.2007.02.005.
- Meilinger, T., G. Franz, and H. Bulthoff. 2012. “From Isovists via Mental Representations to Behavior: First Steps toward Closing the Causal Chain.” Environment and Planning B: Planning and Design 39 (1): 48–62. doi:https://doi.org/10.1068/b34048t.
- Ostwald, M., and M. Dawes. 2013. “Prospect-refuge Patterns in Frank Lloyd Wright’s Prairie Houses: Using Isovist Fields to Examine the Evidence.” The Journal of Space Syntax 4 (1): 136–159.
- Ruggiero, F., R. S. Florensa, and A. Dimundo. 2009. “Re-interpretation of Traditional Architecture for Visual Comfort.” Building and Environment 44 (9): 1886–1891. doi:https://doi.org/10.1016/j.buildenv.2009.01.006.
- Sharp, F., D. Lindsey, J. Dols, and J. Coker. 2014. “The Use and Environmental Impact of Daylighting.” Journal of Cleaner Production 85: 462–471. doi:https://doi.org/10.1016/j.jclepro.2014.03.092.
- Tagliabue, L. C., M. Buzzetti, and B. Arosio. 2012. “Energy Saving through the Sun: Analysis of Visual Comfort and Energy Consumption in Office Space.” Energy Procedia 30: 693–703. doi:https://doi.org/10.1016/j.egypro.2012.11.079.
- Tandy, C. R., and A. C. Murray. 1967. “The Isovist Method of Landscape Survey. Methods of Landscape Analysis.” Landscape Research Group, London 9–10.
- Van Esch, M., R. Looman, and G. de Bruin-hordijk. 2012. “The Effects of Urban and Building Design Parameters on Solar Access to the Urban Canyon and the Potential for Direct Passive Solar Heating Strategies.” Energy and Buildings 47: 189–200. doi:https://doi.org/10.1016/j.enbuild.2011.11.042.
- Wiener, J. M., and G. Franz. 2005. “Isovists as a Means to Predict Spatial Experience and Behavior.” In International Conference on Spatial Cognition. Spatial Cognition IV, LNAI, 42–57. Vol. 3343. Berlin, Heidelberg: Springer-Verlag. https://doi.org/10.1007/978-3-540-32255-9_3
- Wolper, L. F. 2012. Physician Practice Management. 2nd ed. Burlington, MA: Jones & Bartlett Publishers.
- Yu, X., Y. Su, and X. Chen. 2014. “Application of RELUX Simulation to Investigate Energy Saving Potential from Daylighting in a New Educational Building in UK.” Energy and Buildings 74: 191–202. doi:https://doi.org/10.1016/j.enbuild.2014.01.024.