
 ?Mathematical formulae have been encoded as MathML and are displayed in this HTML version using MathJax in order to improve their display. Uncheck the box to turn MathJax off. This feature requires Javascript. Click on a formula to zoom.
ABSTRACT
With the acceleration in globalization, cities have tended to become similar, and commercial districts have gradually lost their local characteristics. Hence, utilizing scientific means to assess human perceptions of traditional and modern districts in an objective manner, this study applies the electroencephalography (EEG) test and the Semantic Differential (SD) method to evaluate the external space perceptions of traditional and modern commercial districts. The results show that the alpha wave mean value of traditional samples is greater than that of modern samples among all electrodes, and most electrodes demonstrate a significant difference. Meanwhile, the alpha wave energy value of a single electrode of different subjects is mostly larger in the traditional samples, meaning that traditional districts can lead to an increase in the brain’s alpha waves. In addition, the SD results show that traditional samples make people feel more comfortable and relaxed; regarding the cultural atmosphere, they are more abundant in detail and distinct; regarding open and closed spaces, they are more closed and covert. The results also show that the electroencephalography (EEG) test can be applied to an evaluation of environmental perception to boost sustainable development of traditional commercial districts and offer more possibilities for future design.
1. Introduction
1.1. Background
With the acceleration in globalization and rapid communication possibilities that come with modernism, cities have tended to become similar, and commercial districts have gradually lost their local characteristics. The government of China proposed “to let residents have access to mountains and water, and remember the feeling of nostalgia” and “to inherit culture and develop beautiful towns with historical memories, regional characteristics and ethnic features,” emphasizing the importance of traditional culture inheritance in urban development. Currently, efforts are being made to protect traditional cultural areas, and numerous scholars have devoted a vast number of studies to cultural heritage protection (Liangyong Citation1994; Yisan and Xiaowei Citation2004; Xiaohua and Hohon Citation2019; Tan and He Citation2014).
However, these previous studies have mostly focused on a particular structure, generally conducting a field survey to gather the data than on more empirical data (Yanyan et al. Citation2019; Limin and Jianmin Citation2014; Ludovico-Marques and Chastre Citation2012). In addition, the evaluation of districts is mostly based on subjective psychology instead of a quantified description (Yi, Yi, and Yiran Citation2011; Jingwei and Qing Citation2012). Hence, the electroencephalography (EEG) experiment conducted in this study was used to measure the human brain’s electrode activities through an electrode placed on the scalp, thus obtaining objective physiological evaluation data. This study collected EEG data of subjects who were asked to watch different sample pictures of traditional and modern commercial districts; then, alpha waves that reflect human comfort levels were extracted through analysis software. In addition, the SD method was used to gather the subjects’ subjective evaluations of the sample pictures, thus probing into the correlation between physiological reaction and psychological feelings based on the comprehensive physiological and psychological evaluation data. By doing this, this study analyzed the relationship between the composition ratio of the pictures, their color, and amount of alpha wave generated.
The purpose of this study was to evaluate the differences in physiological and psychological perceptions between traditional and modern commercial districts and to make people realize the importance of the protection, renewal, and sustainable development of traditional commercial districts. To do this, EEG method was first verified as a tool for external space evaluation. The SD method was then used to investigate the subjects’ subjective perceptions to help interpret the EEG data of objective physiological perceptions. While the EEG output provided a real physiological measurement of responses to changing scenes, the SD method provided the context behind and a better understanding of these changes.
1.2. Studies on traditional districts protection
Since the late nineteenth century, international policies and documents related to the protection of historical districts have been announced. The Athens Charter, passed in 1933, proposed to properly manage “areas and buildings of historical value” and illustrated the significance and principles of historical building protection (Gold Citation1998). In May 1964, the Second International Congress of Architects and Technicians of Historic Monuments adopted the International Charter for the Conservation and Restoration of Monuments and Sites, that is, the Venice Charter, which is an international charter on the protection of historical relics and buildings and that stresses that buildings in historical areas should be protected as a whole and exhibited in a proper way (Jokilehto and Jukka Citation1998). In November 1976, the 19th General Conference of UNESCO adopted the Recommendation concerning the Safeguarding and Contemporary Role of Historic Areas or Nairobi Recommendation, which pointed out the universal value of historical cultural streets expanded the protection regarding their social, historical and use aspects, and extended the connotations of “protection”, that is, identification, protection, conservation, restoration, and renovation (Markusen and Ann Citation2006). In October 1987, the International Council on Monuments and Sites approved the Charter on the Conservation of Historic Towns, that is, the Washington Charter, which provided the “historical sites” definition that is still the most complete definition. In addition, the charter again touched upon the question of the protection of urban historical sites and modern life development requirements, proposing not only protecting the vitality of historical streets but also meeting the demands of modern life (Kolonias Citation2014).
Regarding the international protection of historical and cultural heritage, in addition to the formulation of policies and documents, numerous scholars have carried out studies on this topic. Starting in the 1960s with the appearance of new rationalism, two guiding ideologies regarding the relationship between urban protection and development were developed. The first one represented the combination of old and new, advocated for gradual development and protecting the environment and community structure of existing historical districts, which was referred to as “incremental rereading” by Kolb (Moore Citation2013). The other was a dialectical ideology. Rogers maintained that we should correctly treat the relationship between protection and development and that random development and excessive control should be forbidden (Rogers Citation1988). Lichfield and Richards also discussed the dialectical relationship between protection and development in their article and proposed a way to grasp the scale and degree of protection and development (Lichfield Citation1989; Richards Citation1994). Rafael Mark put forward the model of community participation in historical streets protection, which included three aspects: sustainable protection, the role transformation of residential owners, and change in the form of external help (Rafael Citation1996).
Although efforts have been made to protect historical districts, the preceding studies have mostly focused on a particular structure when conducting a field survey, meaning that using a scientific and technical means to understand historical site protection is rare (Karran, Fairclough, and Gilleade Citation2015).
1.3. Studies on the physiological perceptions of the brain
An EEG is a record of the electrical potentials generated by the nerve cells in the cerebral cortex. Among some of the noninvasive techniques for probing human brain dynamics, an EEG provides a direct measure of cortical activity with millisecond temporal resolution (Subasi and Ergun Erc Citation2005). The early studies of Berger and others clearly delineated the alpha and beta components of EEG tracing as we know it today (Lindsley Citation1952). When people feel relaxed, focused, and quiet, alpha waves are generated in large quantities; in contrast, beta waves are generated in large quantities when people feel nervous, restless, and anxious (Hashimoto et al. Citation2003).
Recently, based on visual perception studies, the calculation and measurement of the EEG have been extensively applied to the field of cognitive psychology. For example, Kacha Lemya et al. represented an experimental research based on the electrophysiological evaluation of perceived complexity in streetscapes (Kacha, Matsumoto, and Mansouri Citation2018). Chang et al. used the scenes of natural areas as stimuli to analyze the psychological and physiological responses of subjects; the participants’ physiological responses were recorded by electromyography and electroencephalography (Chang et al., Citation2008). An objective test was then administered using EEG. Hidehiko et al. found that the amount of alpha waves was higher when viewing images with a higher quantization level, meaning that the EEG could create a good index for assessing high-order sensations in extra-high-quality images (Hayashi, Kunifuji, and Miyahara Citation2002). Li Zao et al. applied an EEG test to analyze the perceptive preference for waterscapes and nonwaterscapes in residential areas (Li and Munemoto Citation2010). In addition, some studies have combined EEG experiments and the SD method. Seta Shigeyuki and Matsumoto Naoji acquired the EEG data of participants who were requested to watch videos of different urban spaces; the authors obtained psychological evaluation results based on the SD method and thus established a psychological and physiological evaluation linear model through multiple linear regression (Srta et al. Citation2004). Hiroshige Nishina and Yumi Nakamoto also combined EEG and SD methods to explore the impact of botanical fragrances on the human body’s comfort level, here finding that botany could affect one’s mood (Nishina and Nakamoto Citation1998). Masato evaluated the physiological and psychological effects of visual environments in windowless office spaces, using electroencephalogram, finger photoelectric plethysmogram, heart rate, critical flicker frequency, and SD appraisals of impression of the visual environment (Sato Citation1994).
Until now, using an EEG analysis to evaluate commercial districts’ external space has been rare. However, some studies have analyzed the correlation between brain perception and different landscape environments. Kim et al. verified the EEG method as a tool for landscape evaluation (Kim, Cheon, and Kang Citation2019). Stigsdotter et al. used a mixed-methods approach to study one’s physiological cognition between a forest and urban environment, the physiological measures showed both environments were more physiologically restorative than being in the office or on the minibus (Stigsdotter et al. Citation2017). Using a functional magnetic resonance imaging, Kim et al. assessed human brain activation in terms of eco-friendliness by having participants view still photographs depicting rural and urban environments (Kim et al. Citation2010). Again using functional magnetic resonance imaging, Martínez-Soto explored the neural correlates of restorative environment exposure by having subjects view photographs with a low or high restorative potential; they found that the brain areas responsible for involuntary attention were more active when viewing high restorative potential and that the brain areas related to directed attention were more active during when viewing pictures with a low restorative potential (Martínez-Soto et al. Citation2013). Tang et al. compared the restorative value of four types of landscape environments (urban, mountain, forest, and water) through questionnaires and by functional magnetic resonance imaging (Tang et al. Citation2017). Ulrich analyzed the effects of slide presentations on alpha amplitudes, showing that alpha waves were significantly higher during the vegetation, as opposed to urban, slides. Similarly, alpha waves were higher on average when the subjects viewed water instead of urban content (Ulrich Citation1981).
In addition to visual effects, sound also has a great effect on EEG. Some scholars have studied the physiological significance of EEG changes caused by sonic and music stimulation (Saito and Ono Citation2012; Mimura et al. Citation1962). In this study, each sample picture was accompanied by the background ambient sound of the districts, which was edited from the same audio to match the actual environments.
2. Research methods and experiment design
This study used EEG analyses, the SD method, and mathematical analysis. 1. Used the EEG test to record the amount of brain wave generation when the subjects watched different sample pictures of traditional and modern commercial districts, specifically to compare the amount of alpha waves generated, which is a vital physiological index reflecting the subjects’ level of pleasure and relaxation. 2. Utilized the SD method to obtain the subjects’ subjective psychological evaluation data on the sample pictures of different districts, compare the differences between the psychological evaluation of traditional and modern commercial districts, conduct a factor analysis of data, and work out the factor scores of the different samples. 3. Analyzed the correlation of psychological evaluation results of different samples, the composition ratio of pictures and colors with the amount of alpha waves generated, and discussed the factors that influence physiological perception of traditional and modern commercial district external spaces.
2.1. Sample selection
The same sample pictures were selected for the EEG test and the SD evaluation including five traditional and five modern commercial districts. To prevent the sequence of pictures from influencing the EEG value, this experiment alternately showed traditional and modern district pictures, left out the first and last pictures, hence obtaining the EEG data for eight sample pictures. As shown in , M1, M2, M3, and M4 represent modern districts showing the Hefei pedestrian street, the outdoor pedestrian street of Wanda Plaza, and Anqing Road; T1, T2, T3, and T4 are traditional districts that showcase Nanjing Laomendong and Huangshan Tunxi Ancient Street.
Table 1. Sample pictures of traditional and modern districts
The length–width ratio of the sample pictures was 3:2, and the size of the pictures was about 360,000 pixels. To prevent nonarchitectural space elements, such as humans, from affecting the EEGs, these photos were taken at dawn when only a few people were present.
2.2. EEG test process
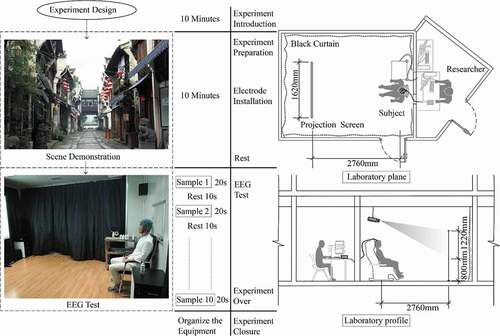
The experiment was conducted in the architectural environment and behavior research laboratory from January 23 to 3 February 2019. During the experiment, a constant temperature of about 20°C was maintained, and a projector was used to project the pictures onto a 1620 mm × 1220 mm curtain. Meanwhile, window shades were used to prevent the light from coming in so that the projected images could be seen clearly. After the experiment began, the air conditioner was turned off to avoid any potential noise on the EEG results. At the same time, to simulate the feel of the actual environments, each sample picture was accompanied by the background ambient sound of the districts, which was edited from the same audio source ().
Table 2. Experiment conditions
The entire experiment took about 25 minutes: about 20 minutes for the pre-experiment introduction, preparation, and electrode installation; 20 seconds for each picture, and for between every two pictures, there was a voice prompt of 10 seconds telling the participant to rest ().
Figure 1. Experimental process and the laboratory environment
Seventeen subjects were chosen for the experiment. Three with extremely unstable EEG data were excluded, leaving 14 participants, including nine males and five females aged between 16 and 40 or above ().
Table 3. Overview of the EEG test subjects
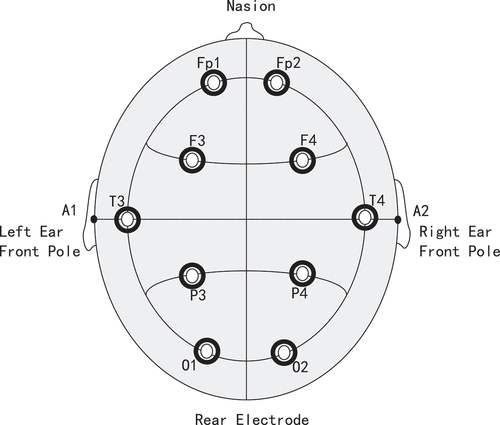
Regarding the EEG measurement instrument, this study adopted the joint standard electrode setting approach (10–20 electrode system) of the International Electroencephalography Society and established the horizontal and vertical axis coordinates with the human skull functioning as the top center (Yoshida Citation2002a). All electrodes were divided based on 10% or 20% of the measured skull length. The nasion position was regarded as the front pole, while the left and right earlobes were deemed to be the left and right poles. Different positions were marked in the form of F, C, P, O, and T with numbers. Monopole deduction was employed in this experiment, and the poles on the electrode cap were, respectively, Fp1, Fp2, F3, F4, T3, T4, P3, P4, O1, and O2, forming 10 groups in total. The sides of the brain were equipped with two electrodes, and four groups were set in the front half and the latter half, respectively (). A G.USBamp-USB ultra-high frequency bioelectrical signal collection amplifier was used to record the brain wave data.
Figure 2. Electrodes setting
2.3. Selection of SD adjective pairs and handout of the questionnaires
Sixteen adjective pairs were selected, including the inherent properties of space, such as a sense of open or closed space, sense of dimensions, and sense of detail. Scoring was conducted in terms of the users’ psychological feelings, such as attraction, pleasure, and comfort, and seven scales of indexes (scores were, respectively, −3, −2, −1, 0, 1, 2, and 3) were chosen as the dimensions for evaluation.
Questionnaires were handed out on the Internet after the EEG test had been completed. Fifty-two questionnaires were collected back, 49 of which were effective, including 20 from males and 29 from females. Ages were between 18 and 40 or above, and most of the participants held a master’s degree or above (). In addition, 13 subjects from the EEG test were included.
Table 4. Overview of the SD evaluation participants
3. Results and analysis
3.1. EEG data processing
A fast Fourier transform was adopted. Through sample data with an order of magnitude 2 N and signal data conversion, a numerical value with periodical changes was converted and calculated into energy with a specific band wave power. The EEG image document of each subject was saved as a text through translation software. The vertical column was 10 electrodes, while the horizontal column presented the amplitude value measured by the electrode pole every 1/256 seconds. To avoid the opening and closing of eyes affecting the data, and with Fourier transform into 2 N data points, this study chose to exclude data in the first and last 2 seconds and transform 4,096 data during 16 seconds in the middle.
Because different subjects demonstrated great differences in their alpha wave data and because the standard deviation the between data was large, the subjects’ alpha wave data of different electrodes went through a 0–1 standardization treatment, which is shown in formula (1). The following analysis is based on the standardized value.
3.2. Analysis of the EEG test results
3.2.1. Comparison of traditional and modern electrodes among individual subjects
shows the alpha wave mean value and standard deviation of 10 electrodes as the subjects watched traditional and modern architecture pictures, here indicating a significant difference between the traditional and modern ones after conducting a t-test. According to the results, through a comparison of the alpha waves between 10 electrodes, 12 out of the 14 subjects favored the traditional samples; only subject 4 and subject 6 showed more electrodes in modern samples than in traditional samples. In addition, most of the alpha wave energy values for the traditional samples were greater than those for the modern ones. Meanwhile, the results of the t-test reflected that the Fp1 and O2 electrode of subject 10 had a significant difference.
Table 5. Comparison between the alpha wave mean value of different electrodes [traditional] and [modern] among individual subjects
3.2.2. Comparison of traditional and modern electrodes among all subjects
Through a comparison of the alpha wave mean value of 10 electrodes for the traditional and modern pictures, as shown in , the traditional pictures were favored more than modern ones. In addition, the results of the t-test probability of five electrodes (Fp2, F3, T3, P3, and O1) were smaller than 0.05, meaning that these five electrodes demonstrated significant differences for the traditional and modern samples; the probability of two electrodes (T4 and O2) was smaller than 0.01, implying that these two electrodes demonstrated extremely significant differences for the traditional and modern pictures. As shown in the connection in , among 10 electrodes, the general mean value, which is indicated by the thick line, was lower on the left side compared with the right side; that is, there was a greater value for traditional samples. In addition, the thin line, here representing different subjects, was most low on the left and high on the right, showing that the alpha wave mean value for the traditional samples was greater than that for the modern samples.
Figure 3. Graphical comparison between the alpha wave mean value of different electrodes [traditional] and [modern] among individual subjects
![Figure 3. Graphical comparison between the alpha wave mean value of different electrodes [traditional] and [modern] among individual subjects](/cms/asset/4695f523-5bd5-4940-a083-d769230efe9e/tabe_a_1813586_f0003_oc.jpg)
Table 6. Comparison between the alpha wave mean value of different electrodes [traditional] and [modern] among all the subjects
3.2.3. Comparison of left and right electrodes among individual subjects
Previous research has revealed alpha wave asymmetry of the left and right brain (Galin and Ellis Citation1975; Yoshida Citation2002b). This study also conducted a comparative analysis of the amount of alpha waves generated by the left and right brains of each subject. As can be seen in , there were no significant differences between the left and right brain of each subject and alpha wave generation towards traditional samples was larger than that towards modern samples for both the left and right electrodes for most subjects. Only some of the electrodes of subjects 6, 7, 10, and 14 showed left-right asymmetry (red line electrode in the figure).
Figure 4. Comparison between the alpha wave mean value of different electrodes [left] and [right] among individual subjects
![Figure 4. Comparison between the alpha wave mean value of different electrodes [left] and [right] among individual subjects](/cms/asset/a65c7f74-6462-4b29-ac92-47966363adbf/tabe_a_1813586_f0004_oc.jpg)
From the above, it can be inferred that there was no significant difference in alpha wave generation between the left and right brain at most electrodes. The correlations between the alpha wave energy values of the left and right brain electrodes for each participant were further analyzed. It can be seen in that the correlation coefficients were greater than 0.7 and the P values were less than 0.01 for most subjects, except for subjects 6, 10, and 14. Thus, there were strong positive correlations between left and right brain alpha wave generation.
Table 7. Correlations between the mean alpha wave values of the [left] and [right] brain electrodes among individual subjects
This research also compared the values of the alpha waves generated by each subject’s left and right brain. Most subjects exhibited the same trend in alpha wave generation in the left and right brain (). Only subjects 10 and 14 showed asymmetry. For subject 10, the left brain generated more alpha waves when viewing traditional samples and the right brain generated more alpha waves when viewing modern samples. Subject 14 was the opposite to subject 10. The results were similar to those of the separate electrode test reported in Section 3.2.1. Thus, the results indicated that only a few participants exhibited left-right asymmetry; there were no significant differences in alpha wave generation between the left and right brain for most subjects.
Table 8. Comparison between the alpha wave mean value of traditional and modern differences between [left] and [right] brain
3.2.4. Alpha wave mean value comparison between different samples
shows the alpha wave mean value and standard deviation for single samples. Here, the alpha wave energy value of the traditional samples T2, T3, and T4 was greater than that of all the modern samples. T3 and T4 were pictures showing the historical and cultural Tunxi Ancient Street, which has the typical characteristics of Huizhou traditional blocks: large height–width ratio, emerald stone path, wooden gratings, doors and windows, and ornamental traditional shop signs, cultural decorations, and so forth. The results showed that this type of historical and cultural street with traditional characteristics led to more alpha waves being produced, hence making people more comfortable. Yet the alpha wave energy value of the modern samples M1 and M4 was the lowest. M1 is a typical modern pedestrian street, while M4 is a commercial street along the road. The two types of streets are the most common modern commercial districts in cities, and their common features are a large width, high buildings on both sides, numerous upright signs, and rich colors. The experimental results also suggested that these streets reduced the alpha wave value.
Figure 5. Alpha wave mean value and standard deviation of the different samples
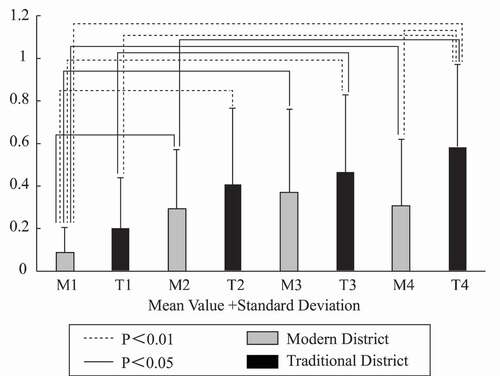
An independent sample t-test that was conducted on the alpha wave energy value of the different samples to find that differences between the modern samples (M1) and traditional samples (T2, T3, and T4) showed a high level of significance. At the same time, M2 and T4 demonstrated prominent differences, while M4 and T4 showed extremely significant differences, meaning that the alpha wave energy value of the traditional samples was higher than that of modern samples.
3.3. SD evaluation results
3.3.1. General characteristics of the samples
An SD psychological perception evaluation was conducted on the traditional and modern samples after the EEG test. shows the mean value and standard deviation of the modern commercial district samples (M1, M2, M3, and M4), while displays the mean value and standard deviation of the traditional commercial district samples (T1, T2, T3 and T4). Comparing the mean value, the traditional samples were seen in terms of physical properties as more closed, covert, well proportioned; in terms of colors, more elegant, simplistic, and harmonious; in terms of characteristics, more novel and distinct; more prone to having the participants feel strong a cultural atmosphere and see abundant detail; and in terms of pleasure, more attractive, pleasant, comfortable, and relaxing.
Figure 6. [Modern samples] mean value and standard deviation of the SD adjective pairs
![Figure 6. [Modern samples] mean value and standard deviation of the SD adjective pairs](/cms/asset/3eec0a71-365e-4266-8028-af0ae73e0044/tabe_a_1813586_f0006_b.gif)
Figure 7. [Traditional samples] mean value and standard deviation of the SD adjective pairs
![Figure 7. [Traditional samples] mean value and standard deviation of the SD adjective pairs](/cms/asset/da0532e4-4db7-4516-817c-d0876ae5abec/tabe_a_1813586_f0007_b.gif)
The standard deviation of the adjective pairs (traditional–modern) was the smallest, which means that the difference between the traditional and modern samples was large; the standard deviation of the open and orderly was bigger, which indicates that different subjects differed in their cognition of this pair.
3.3.2. Factor analysis
Three factors were obtained through a dimensional reduction of the 16 adjective pairs, and then, a semantic integration was carried out on these pairs. These three factors were named sense of pleasure and comfort, sense of traditional atmosphere, and sense of open and closed space as shown in .
Table 9. Factor load table after rotation
The factor score refers to the marks of the factor items after the adjectives went through dimension reduction in the original test samples. The factor scores of the different samples reflect the correlation between the samples and the specific factors after dimension reduction. Except for the factor score table (), the radar image shows the relations of the factor scores among samples in a more graphic manner (). According to the radar image, the triangles formed by the factor scores of samples M1, M2, M3, and M4 are close, and the triangles formed by samples T1, T2, T3, and T4 are close, implying that the traditional samples and modern samples were grouped together and that they possess similar characteristics to their group (modern or traditional).
Figure 8. Factor score radar image
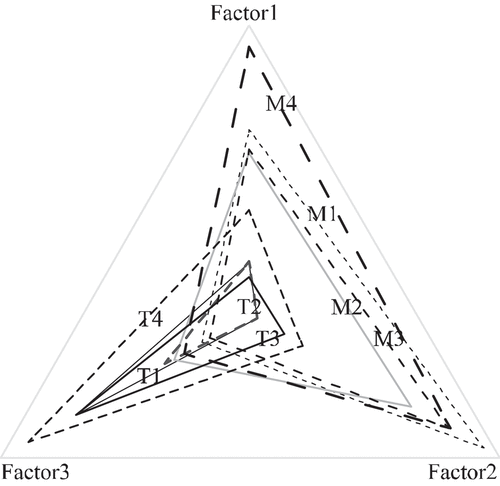
Table 10. Factor score
4. Analysis of the relevant factors influencing alpha waves
4.1. Correlation between the alpha wave energy value and factor score
The previous part of this paper showed the alpha wave energy values from 10 electrodes for all of the samples, and the scores of the different psychological evaluation factors for the different samples were obtained via a factor analysis and correlation analysis of alpha wave energy value and the factor scores. The results show that in a single-item test, the alpha wave energy value and factor 3 (sense of open and closed space) of electrodes F3, T4, and O2 demonstrate a significant correlation (). The sense of open and closed space was significantly correlated with certain electrodes, which also means that compared with the sense of pleasure and comfort and sense of a traditional atmosphere, which are more detailed, the sense of open and closed space, which is more vivid, can have an obvious impact on the alpha waves. The most obvious difference between the traditional commercial districts and modern commercial districts is that the streets in the former are narrower, leaving people with a more closed and private feeling, and the streets in the latter are wider and make people feel more in the public and open. As shown in the factor score table (), in terms of the traditional sample factor 3, the scores go from high to low: T4, T3, T1, and T2. T4 and T3, with the highest scores, are also the two samples with the greatest amount of generated alpha waves. It has been shown before that these two samples possess the typical features of the Huizhou historical and cultural streets. Therefore, the relatively tighter traditional streets can elevate an individual’s alpha waves and give people a more pleasant feeling.
Table 11. Correlation between alpha wave energy value and factor score
4.2. Correlation between the alpha wave energy value and picture composition
The previous section shows that the amount of alpha waves is influenced by the sense of open and closed space, and the composition ratio of the pictures is an important factor that impacts this. Hence, this section will provide a correlation analysis, that is, whether the alpha waves were affected by the depth and height (D/H) ratio of streets and the ratio of sky in sight, roads, greening, and advertising signs in the pictures. The aforementioned elements are outlined in Photoshop (), and the pixel quantity of the different elements was calculated by dividing the total pixel quantity of the pictures and thus obtaining the ratio of the elements in the pictures. Furthermore, a correlation analysis was carried out based on the alpha wave values from the different electrodes.
Figure 9. Graphical representation of the elements in the pictures
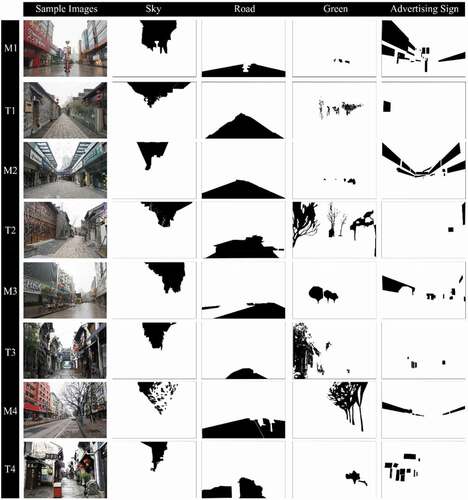
In a single-item test, the D/H ratio and O1 electrode, sky vision and multiple electrodes (Fp1, F3, T3, P4, O1, and O2), advertising signs and O2 electrode demonstrated a significant correlation (). Combining the previous section, the O1 and O2 electrodes were significantly correlated with numerous elements. Past studies also proposed that the front of the head is related to emotion and sentiment, the top of the head to understanding and cognition, and the back to visual stimulation (Kato, Hashimoto, and Amemiya Citation2004). Therefore, the brain waves produced by the O1 and O2 electrodes behind the brain should show a stronger correlation with the visual experiment. The streets in the traditional commercial districts are narrow with a low amount of visible sky, while the streets in modern commercial districts are wide with a large amount of visible sky. The amount of visible sky has a significant correlation with multiple electrodes, which also verifies that the sense of open and closed space in traditional and modern districts impacts the amount of alpha waves.
Table 12. Correlation between the alpha wave energy value and picture composition
4.3. Correlation between the alpha wave energy value and picture colors
In addition to the sense of open and closed space and the ratio of the elements, color is also the first visual impression that a picture leaves on an audience. The mean RGB value can accurately reflect the color of a picture. Statistics on the mean RGB value were gathered. shows that the value of the modern samples M1 and M3 is higher, while that of the traditional samples T3 and T4 is lower. On the whole, the mean RGB value of the modern samples is higher than that of the traditional samples. This means that the colors of modern districts are more abundant, while the colors of traditional districts are more elegant and unsophisticated.
Figure 10. RGB mean for each sample
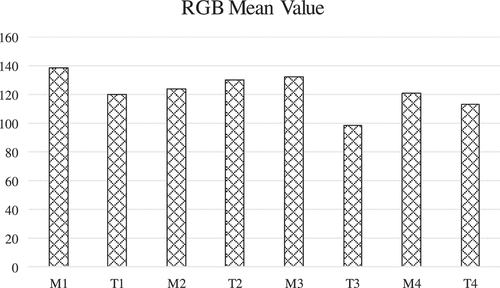
Through a correlation analysis of the mean RGB value and amount of alpha waves generated for the different samples, it can be seen () that the mean RGB value is significantly correlated with the amount of alpha waves generated for Fp1, F3, and O2 in the single-item test. This implies that color is also one of the more important indexes that influence the amount of alpha waves generated. Meanwhile, because large differences exist between the traditional and modern commercial districts in terms of color, the atmosphere built by the elegant colors of the traditional commercial districts makes the subjects feel more at ease, thus increasing the alpha waves generated.
Table 13. Correlation between the alpha wave energy value and RGB mean value
4.4. Verification of the effect of sense of space opening and closing on alpha waves
The above analysis indicated that the sense of space opening and closing is an important factor affecting alpha wave generation between traditional and modern districts. Since most traditional districts are closed, samples from modern districts with large differences in sense of space opening and closing were selected to verify the influence of sense of space opening and closing on alpha wave generation. Sample pictures used in the first experiment were supplemented with additional pictures, including pictures of open and closed spaces (). The sample pictures were selected from typical modern commercial districts in Hefei; the average RGB values were similar. The experiment was conducted among 12 first-time subjects under the same conditions as the previous experiment.
Table 14. Sample pictures of modern districts
At the end of the experiment, each subject was asked to score the sense of opening and closing for each sample picture. A score of 0 indicated a sense of opening while a score of 1 indicated a sense of closing. The mean score for sense of opening and closing for each sample picture was calculated. As can be seen in , the scores for pictures 1, 3, 5, and 6 were close to 0; thus, these samples were classified as the open group. The scores of pictures 2, 4, 7, and 8 were close to 1; thus, they were classified as the closed group.
Table 15. Mean scores for the sense of opening and closing for each sample
Comparison of the average alpha wave values for closed and open samples at each electrode revealed that the average value for closed spaces was larger than that of open spaces at seven electrodes. Further, the difference relative to the average value at all electrodes was larger for closed spaces than for open (). These findings indicate that in the same modern district, the sense of a space opening and closing has a certain impact on alpha waves. Following the completion of the experiment, conversations with the subjects revealed that outdoor commercial pedestrian streets close to the traditional scale can shorten the distance between people and the shops on each side of the street, making people feel more comfortable psychologically. As Yoshinobu Ashihara discussed in The Aesthetic Townscape, narrow streets can make people feel close (Ashihara Citation1979). Therefore, more attention should be paid to human feelings and the sense of spatial scale in the design of modern commercial districts.
Table 16. Comparison of the mean alpha wave value for sense of space opening and sense of space closing
5. Conclusions
Accelerated modernization has led to homogeneous urban appearances, and modern commercial districts within different cities look similar and lack regional characteristics. More and more scholars are increasingly calling for the protection of traditional commercial districts. However, do people’s physiological and psychological perceptions of traditional commercial districts and modern commercial districts explicitly differ? This study applied an EEG test and the SD method to compare subjects’ physiological and psychological perceptions of modern and traditional commercial districts. This was carried out because quantifiable data can help interpret human preferences for traditional and modern districts more precisely, and the relevant factors influencing these preferences can be further explored. The following conclusions were reached:
As shown from the results of the EEG test, the alpha wave mean value of the 10 electrodes for the traditional samples was greater than that for the modern samples among all subjects; for seven out of 10 electrodes, a significant difference existed between the traditional and modern samples. The outcome for a single electrode also manifested a higher value for the traditional samples. Moreover, the alpha wave energy value between multiple traditional samples and modern samples showed a prominent difference, indicating that the alpha wave value of traditional samples is higher than that of modern samples and that traditional districts make people more comfortable and at ease.
The results of the SD evaluation demonstrated that the participants varied greatly regarding their psychological perceptions of the traditional samples and modern samples. Regarding the pleasure and comfort level, the traditional samples were seen as more comfortable, relaxing and pleasant; in terms of the cultural atmosphere, they were seen as more novel, distinct, simplistic, elegant, and attractive; and regarding the sense of open and closed space, they were also seen as more closed and covert.
By analyzing the correlation among the SD factor scores of the different samples, the composition ratio of the pictures, and the colors with the alpha wave, it was shown that mean alpha wave values were significantly correlated with the sense of space opening and closing, the amount of visible sky, and colors. A comparative experiment of different modern districts revealed that the sense of spatial opening and closing is an important factor affecting alpha wave generation. This means that compared with more detailed elements, the sense of dimensions and colors that can differentiate modern and traditional districts the most vividly have the most direct impact on the amount of alpha waves generated. In addition, closed and covert traditional commercial districts with simplistic colors can increase alpha wave activities and make people feel more at ease. Therefore, in the design of commercial districts, we should pay more attention to human feelings and the sense of spatial scale. Further, landscape facilities, leisure seats, etc. should be built in the middle of wide pedestrian streets to enhance the affinity of the district.
The scientific data analysis indicated that the subjects showed obvious differences in their perceptions of traditional and modern districts; the alpha waves recorded were relatively high when the subjects were viewing traditional commercial districts. Therefore, we should make greater efforts to protect traditional commercial districts and renovate and improve these traditional districts in old towns. This study also found that the physiological perceptions obtained from the EEG test can be applied to an environmental perception evaluation, thus providing more possibilities for future designs and studies. However, because of the relatively few sample pictures displayed and comparatively low number of subjects, this study has its limitations. That being said, this study format could be extended in future studies.
Disclosure statement
No potential conflict of interest was reported by the authors.
Additional information
Funding
References
- Ashihara, Y. 1979. The Aesthetic Townscape. Tokyo: Iwanami bookstore
- Chang, C.-Y., W. E. Hammitt, P.-K. Chen, L. Machnik, and S. Wei-Chia. 2008. “Psychophysiological Responses and Restorative Values of Natural Environments in Taiwan.” Landscape and Urban Planning 85 (2): 79–84. doi:https://doi.org/10.1016/j.landurbplan.2007.09.010.
- Galin, D., and R. R. Ellis. 1975. “Asymmetry in Evoked Potentials as an Index of Lateralized Cognitive Processes: Relation to Eeg Alpha Asymmetry.” Neuropsychologia 13 (1): 45–50. doi:https://doi.org/10.1016/0028-3932(75)90046-9.
- Gold, J. R. 1998. “Creating the Charter of Athens: CIAM and the Functional City, 1933–43.” The Town Planning Review 69 (3): 225.doi:https://doi.org/10.3828/tpr.69.3.2357285302gl032l.
- Hashimoto, Y., T. Nishioka, N. Umemiya, and R. Okura. 2003. “The Effects of Traffic Noise: An EEG Approach.” Journal of Environmental Engineering (Transactions of AIJ) 69 (570): 1–6. doi:https://doi.org/10.3130/aije.68.1_5.
- Hayashi, H., S. Kunifuji, and M. Miyahara. 2002. “Assessment of High-Order Sensations in Extra-High-Quality Images Using Electroencephalography.” The Journal of the Institute of Image Information and Television Engineers 56 (6): 954–962. doi:https://doi.org/10.3169/itej.56.954.
- Jingwei, L., and L. Qing. 2012. “Research on the Comprehensive Evaluations and of Historical Block in Small and Medium-Sized Cities of the Northeast Region - the Case Study on Tuo Huang Niu Road, Anda.” Applied Mechanics and Materials 209–211: 41–44. doi:https://doi.org/10.4028/www.scientific.net/AMM.209-211.41.
- Jokilehto, and Jukka. 1998. “The Context of the Venice Charter.” Conservation and Management of Archaeological Sites 2 (4): 229–233. doi:https://doi.org/10.1179/135050398793138762.
- Kacha, L., N. Matsumoto, and A. Mansouri. 2018. “Electrophysiological Evaluation of Perceived Complexity in Streetscapes.” Journal of Asian Architecture and Building Engineering 14 (3): 585–592. doi:https://doi.org/10.3130/jaabe.14.585.
- Karran, A. J., S. H. Fairclough, and K. Gilleade. 2015. “A Framework for Psychophysiological Classification within A Cultural Heritage Context Using Interest.” ACM Transactions on Computer-Human Interaction 21 (6): 1–19. doi:https://doi.org/10.1145/2687925.
- Kato, Y., R. Hashimoto, and I. Amemiya. 2004. “Psychological and Physiological Responses to Color of a Room.” Journal of the Color Science Association of Japan 28 (1): 16–25.
- Kim, M., S. Cheon, and Y. Kang. 2019. “Use of Electroencephalography (EEG) for the Analysis of Emotional Perception and Fear to Nightscapes.” Sustainability 11 (1). doi:https://doi.org/10.3390/su11010233.
- Kim, T.-H., G.-W. Jeong, H.-S. Baek, G.-W. Kim, T. Sundaram, H.-K. Kang, S.-W. Lee, H.-J. Kim, and J.-K. Song. 2010. “Human Brain Activation in Response to Visual Stimulation with Rural and Urban Scenery Pictures: A Functional Magnetic Resonance Imaging Study.” Science of the Total Environment 408 (12): 2600–2607. doi:https://doi.org/10.1016/j.scitotenv.2010.02.025.
- Kolonias, S. A. 2014. Charter for the Conservation of Historic Towns and Urban Areas (Washington 1987). New York: Springer New York.
- Li, Z., and J. Munemoto. 2010. “Comparative Study on Waterscaped and Non-Waterscaped Spaces Using Electroencephalogram Analysis.” Journal of Architecture and Planning (Transactions of AIJ) 75 (647): 67–74. doi:https://doi.org/10.3130/aija.75.67.
- Liangyong, W. 1994. The Old City of Beijing and Its Juer Hutong Neighbour. Beijing: China Architecture & Building Press.
- Lichfield, N. 1989. Economics in Urban Conservation. Cambridge: Cambridge University Press.
- Limin, B., and H. Jianmin. 2014. “The Characteristic Analysis and Protection Thinking on the Xinmin Street Historical and Cultural Blocks in Changchun.” Applied Mechanics and Materials 641–642: 576–579. doi:https://doi.org/10.4028/www.scientific.net/amm.641-642.576.
- Lindsley, D. B. 1952. “Psychological Phenomena and the Electroencephalogram EEG Clin.” Electroencephalography and Clinical Neurophysiology 4 (4): 443–456. doi:https://doi.org/10.1016/0013-4694(52)90075-8.
- Ludovico-Marques, M., and C. Chastre. 2012. “Effect of Salt Crystallization Ageing on the Compressive Behavior of Sandstone Blocks in Historical Buildings.” Engineering Failure Analysis 26 (26): 247–257. doi:https://doi.org/10.1016/j.engfailanal.2012.08.001.
- Markusen, and Ann. 2006. “Urban Development and the Politics of a Creative Class: Evidence from a Study of Artists.” Environment and Planning A 38 (10): 1921–1940. doi:https://doi.org/10.1068/a38179.
- Martínez-Soto, J., L. Gonzales-Santos, E. Pasaye, and F. A. Barrios. 2013. “Exploration of Neural Correlates of Restorative Environment Exposure through Functional Magnetic Resonance.” Intelligent Buildings International 5 (S1): 10–28. doi:https://doi.org/10.1080/17508975.2013.807765.
- Mimura, K., K. Sato, T. Ozaki, N. Honda, and S. Masuya. 1962. “On the Physiological Significance of the EEG Changes Caused by Sonic Stimulation.” Electroencephalography and Clinical Neurophysiology 14 (5): 683–696. doi:https://doi.org/10.1016/0013-4694(62)90083-4.
- Moore, S. 2013. “Postmodern Sophistications: Philosophy, Architecture, and Tradition.” Journal of Architectural Education 45 (4): 241–243. doi:https://doi.org/10.2307/1425192.
- Nishina, H., and Y. Nakamoto. 1998. “Analysis of Amenity Effect of Plants and Fragrance on Human Physiology and Psychology by Means of Brain Waves and Semantic Differential Technique.” Journal of Architecture and Planning (Transactions of AIJ) 63 (509): 71–75. doi:https://doi.org/10.3130/aija.63.71_3.
- Rafael, M. 1996. “Conservation and Community: The Contradictions and Ambiguities of Tourism in the Stone Town of Zanzibar.” Habitat International 20 (2):0–278. doi:https://doi.org/10.1016/0197-3975(95)00062-3.
- Richards, J. 1994. Facadism. London: Routledge.
- Rogers, R. 1988. “Belief in the Future Is Rooted in the Memory of the Past.” RSA Journal 136 (5388): 873–884. doi:https://doi.org/10.2307/41374749.
- Saito, T., and T. Ono. 2012. “Relationship between Psychological Indices and Physiological Brain Activity:- Measured by NIRS while Listening to Music.” Transactions of Japan Society of Kansei Engineering 11 (3): 427–434. doi:https://doi.org/10.5057/jjske.11.427.
- Sato, M. 1994. “Effects of Windows, Potted Plants and Paintings in A Room on Electroencephalogram and the Like: A Study on Physiological and Psychological Effects of Visual Environment in an Office Space.” Journal of Architecture and Planning (Transactions of AIJ) 59 (461): 87–95. doi:https://doi.org/10.3130/aija.59.87_3.
- Srta, S., N. Matsumoto, K. Takagi, and N. Miwa. 2004. “The Influence of the Urban Space Elements upon the Estimation of Sensitivity Analysis: Notation of Emotional Meaning of Urban Outdoor Spaces Based on Brain Waves Part 2.” Journal of Architecture and Planning (Transactions of AIJ) 69 (577): 65–72. doi:https://doi.org/10.3130/aija.69.65_1.
- Stigsdotter, U. K., S. S. Corazon, U. Sidenius, J. Kristiansen, and P. Grahn. 2017. “It Is Not All Bad for the Grey City - A Crossover Study on Physiological and Psychological Restoration in A Forest and an Urban Environment.” Health & Place 46: 145–154. doi:https://doi.org/10.1016/j.healthplace.2017.05.007.
- Subasi, A., and E. Ergun Erc 2005. “Classification of EEG Signals Using Neural Network and Logistic Regression.” Computer Methods and Programs in Biomedicine 78 (2): 87–99. doi:https://doi.org/10.1016/j.cmpb.2004.10.009.
- Tan, Z., and H. He. 2014. “Method of Protection and Renewal on Nanyang Historical Street District - an Example on Town Hall Historical Street District in the Center of Nanyang Town Hall.” Applied Mechanics and Materials 584–586: 217–221. doi:https://doi.org/10.4028/www.scientific.net/AMM.584-586.217.
- Tang, I.-C., Y.-P. Tsai, Y.-J. Lin, J.-H. Chen, C.-H. Hsieh, S.-H. Hung, W. C. Sullivan, H.-F. Tang, and C.-Y. Chang. 2017. “Using Functional Magnetic Resonance Imaging (Fmri) to Analyze Brain Region Activity When Viewing Landscapes.” Landscape and Urban Planning 162: 137–144. doi:https://doi.org/10.1016/j.landurbplan.2017.02.007.
- Ulrich, R. S. 1981. “Natural Versus Urban Scenes: Some Psychophysiological Effects.” Environment and Behavior 13 (5): 523–556. doi:https://doi.org/10.1177/0013916581135001.
- Xiaohua, Z., and L. Hohon. 2019. “Exploring Participatory Microregeneration as Sustainable Renewal of Built Heritage Community: Two Case Studies in Shanghai.” Sustainability 11 (6): 1617–1631. doi:https://doi.org/10.3390/su11061617.
- Yanyan, X., L. Miao, H. Yuanman, L. Chunlin, and X. Zaiping. 2019. “Analysis of Three-Dimensional Space Expansion Characteristics in Old Industrial Area Renewal Using GIS and Barista: A Case Study of Tiexi District, Shenyang, China.” Sustainability 11 (7): 1860–1881. doi:https://doi.org/10.3390/su11071860.
- Yi, Y., X. Yi, and S. Yiran. 2011. “Renew and Extension of Vigor in Historical Block - the Background Study of Historical Block and the Building Overhang Protection and Synthesis Reform in Haikou.” Applied Mechanics and Materials 99–100: 126–130. doi:https://doi.org/10.4028/www.scientific.net/AMM.99-100.126.
- Yisan, R., and G. Xiaowei. 2004. “An Analysis about the Practical Patterns to Consenve the Historic Districts in China.” Journal of Tongji University Social Science Section 15 (5): 1–6.
- Yoshida, T. 2002a. “Reading of Brain Wave Rhythm as ‘Kansei’ Measurement.” Special Issue of JSSD 10 (2): 29–38. doi:https://doi.org/10.11247/jssds.10.2_29.
- Yoshida, T. 2002b. “Evaluation of Comfort by Using Rhythm of EEG.” Micromechatronics 46 (2): 1–9.