
 ?Mathematical formulae have been encoded as MathML and are displayed in this HTML version using MathJax in order to improve their display. Uncheck the box to turn MathJax off. This feature requires Javascript. Click on a formula to zoom.
ABSTRACT
In a decision-making study, design alternatives are compared with respect to cost, performance, and reliability, and the best is selected. Often, due to the time constraints imposed by the design schedule and budget restrictions, the number of design alternatives considered is limited. This research focuses on composite flooring systems for multistory buildings and the application of value techniques to the construction industry. The study uses data that obtained from the RSMeans Assemblies Books for the period 1997–2019. The data obtained from RSMeans consists of assembly cost ($/sf of floor) as the dependent variable; and the structural span (ft.), superimposed load (p.s.f), unit cost of sheet metal ($/LF of sheet), unit cost of concrete ($/CY), unit cost of steel structural ($/ton), and total load (p.s.f) as the independent variables. A simple computer model is designed for recommending the optimal composite flooring system of a multistory building, during the preliminary design stage. The value engineering (VE) team to achieve the VE goals mentioned above can use the model.
1. Introduction
Over the past number of decades, various floor systems have been used in the building of many types of multistory buildings. Since a large segment of the public and private sectors’ funds and time is spent on construction, especially on the construction of such projects, it is essential to plan how resources can be used effectively within the construction industry. The design phase is the very first phase of a construction project; it precedes all other construction activities and profoundly affects construction costs, the project schedule, and the construction method. Selecting the best design alternative can result in large savings. Therefore, choosing the optimal floor system for the construction of multistory buildings is strongly recommended. Composite buildings can be defined as buildings with some structural elements made of reinforced concrete and other structural elements made of steel or as buildings containing structural elements made of both steel and concrete, as shown in .
Figure 1. Composite flooring system for multistory buildings
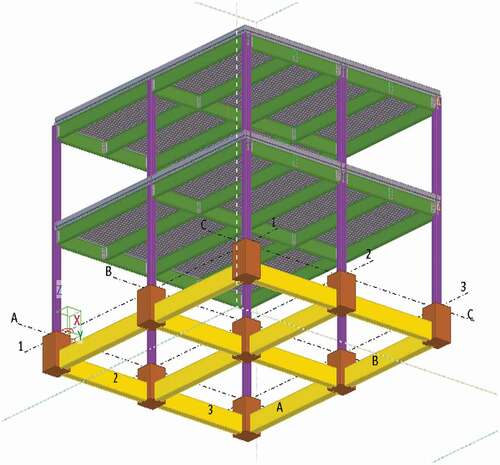
Floor slabs are usually made of reinforced concrete or a composite of concrete and steel. Thus, it is a general practice to use concrete or reinforced concrete in slabs. Floor slabs in steel buildings are generally composite, and those in reinforced concrete or composite buildings are usually either reinforced concrete or composite. Normally, composite floor slabs are usually composed of a metal deck (a trapezoidal steel plate) with a concrete or reinforced concrete topping. Composite floor slabs generally support structural steel or steel trusses.
One of the biggest challenges in performing decision-making activities is the development of accurate preliminary cost estimates, during the preliminary study. If poor cost information is used, the basis for value engineering evaluation is hampered (Dell’Isola Citation1982). In order to improve the effectiveness of decision-making activities, there is a need to develop new methods for estimating construction costs of an adequate number of alternatives early on during the design phase. Although multistory structures, especially steel and composite structures, are quite prevalent these days, many techniques are still invoked to select an optimal methodology for creating and maintaining each one. One of the best ways to achieve optimum value maybe through the ring analysis technique. Many other methods have been used over the years, and our proposed method has not been discussed yet.
2. Objective
The main purpose of our research is to present a methodology that integrates artificial intelligence for developing accurate preliminary cost estimates for composite flooring systems of multistory buildings. AI helps the decision makers to identify the optimal composite flooring system for any specific multistory building. The decision makers should be able to assess different alternatives in selecting the appropriate flooring system.
3. Literature review and background
(Klanˇsek and Kravanja Citation2006a) presented self-manufacturing cost estimation, cost optimization and competitiveness of different composite floor systems: composite I beam, composite trusses produced from rolled channel sections and composite trusses made from cold-formed hollow sections. The optimization was performed by the nonlinear programming approach, NLP. The parametric optimization was made for simply supported beams of different spans, loads, steel costs (prices) and different hourly labor costs (Klanˇsek and Kravanja Citation2006a). Using the general-purpose finite element package ABAQUS, a 3-D finite element model representing 20 story buildings to perform the progressive collapse analysis. Shell elements and beam elements were used to simulate the whole building incorporating nonlinear material characteristics and nonlinear geometric behavior (Fu Citation2009). The cost optimization of a composite floor system was performed utilizing the harmony search algorithm and an improved harmony search algorithm. A composite floor system was designed by the LRFDAISC method, using a unit consisting of a reinforced concrete slab and steel beams. The objective function was considered as the cost of the structure, which is minimized subjected to serviceability and strength requirements (Kaveh and Abadi Citation2010). Cost efficiencies of various steel frameworks were investigated for the economical design of multistory buildings. A total of 13 steel frames that incorporate various types of beam-column connection and bracing configuration were considered for detailed and comparative cost analyses. The three multistory buildings consisting of 10, 20 and 30 floors are stiffened according to each of the 13 steel frameworks to yield 39 test frames for numerical applications (Hasançebi Citation2017).
(Kim, Seo, and Hyun Citation2012) presented a practical hybrid conceptual cost estimating model for large building projects, including multiple mixed-use buildings.
4. Background for applications of ANNs in construction engineering
A number of researchers have applied ANNs in construction management, principally for decision-making, forecasting, and optimization. Cost is one of the major criteria in decision-making in the early stages of a building design process. Traditional cost estimating procedures follow a quantity takeoff, while comparative cost estimating relies on parameters such as type, size, and capacity of the building. While traditional cost estimating makes use of blueprints and specifications, comparative cost estimating assumes a linear relationship between the final cost and the basic design variables of the project (Gunaydın and Dogan Citation2004). Developments in computer and software technology have facilitated novel approaches for cost estimation. By the emergence of AI tools (i.e., neural networks) possible multilinear and nonlinear relationships can now be investigated. The overall cost of a multistory residential building may come down considerably if the structural system is designed efficiently. It is understandable that both architects and structural engineers should exercise optimum care in making design decisions for the structural system. Developed and tested a model of cost estimating for the structural systems of reinforced concrete skeleton buildings in the early design phase via the application of artificial neural networks (ANN). The combination of AI and traditional techniques, to develop accurate estimates of the resources needed in a project (e.g., construction material quantities). It was used to estimate the amount of concrete, reinforcement, and structural steel required for the construction of tall-frame structures (Garcia De Soto and Adey Citation2016). In 2018, Jassim submitted a report for the study to the artificial neural networks as a general and principal concept (Jassim Citation2018). The purview of ANNs in which the given hazy information can be effectively interpreted in order to arrive at meaningful conclusions. shows a summary of the knowledge gaps in some of the earlier researches.
Table 1. Summary of the knowledge gaps in the earlier researches
5. Research methodology
A thorough review of the existing literature was performed in this study to identify existing techniques and uncover factors relevant to selecting an optimal methodology for planning, creating, and maintaining multistory buildings. Our study suggests how to design a flexible model that uses the capabilities of MathWorks® MATLAB® software as a decision-making. The model can be used to select an optimal composite flooring system for multistory buildings based on multiple criteria that may change independently and in concert with value engineering. Multistory buildings are used for various purposes, and their structural design is subject to a broad range of loading requirements that may not be included in widely available estimating books such as those published by RSMeans. Such buildings are becoming more and more prevalent as people continue to move to cities. Although concrete, steel, and composite systems can be used in buildings as discussed above, this research has focused on three composite systems for flooring systems since they are very popular around the world. The VE analysis usually evaluates various design alternatives. The VE analysis usually evaluates various design alternatives. For example, when selecting the composite flooring system of multistory buildings, there are many systems to choose from (composite beams and cast in place slab, composite beams, deck and slab, and W shape, composite deck and slab).
5.1. Collection the data
To provide preliminary construction cost estimates to designers, RSMeans publishes an Assemblies Cost Book on an annual basis. The Assemblies Cost Book provides the cost of various construction systems, allowing the designer to make informed decisions before committing to a specific construction or system type (RSMeans Citation2019). The data collection process and the type of data collected are described in this section. The data used in this study are obtained from the RSMeans Assemblies Cost Books for the period 1997 to 2019, as shown in . (RSMeans Citation2019) Assemblies Cost Data book, compare system costs in the budgetary phase of any project. Cost data from the most trusted source in North America. It is aimed primarily at commercial and industrial projects or large multi-family housing projects costing US$3,500,000 and up. For civil engineering structures such as bridges, dams, highways, or the like. The engineers at RSMeans suggest the products and services as companion information resources to RSMeans Assemblies Cost Data.
Table 2. Loads, span, and area ranges for composite flooring system
ANN requires a large amount of data for accurate training; therefore, we used data from over a 20-year period. Such a large volume of data also ensures that cost variation patterns over the historical years are adequately captured and accurately reflected in future predictions through the ANN model. Since adequate data from real construction projects are often not available to researchers, the data from RSMeans are used as a synthetic data source to prove the feasibility and usefulness of developing intelligent ANN models during the value engineering phase for preliminary construction estimation. In addition, RSMeans is a comprehensive and reliable source of construction cost data, which makes it extremely suitable for use in our research. The collected information from RSMeans is used to build and test the neural networks ensemble model. This artificial intelligence (AI) techniques are briefly introduced in the following sections.
5.2. Proposed system
Cost is one of the major criteria in decision-making in the early stages of a building design process. In today’s globally competitive world, diminishing profit margins and decreasing market shares, cost control plays a major role in being competitive while maintaining high-quality levels. Current practice shows that the design of a building and the selected materials bear a significant impact on the cost of a building (Mohamed and Celik Citation2002). The cost of a building is impacted significantly by decisions made at the design phase. While this influence decreases through all phases of the building project, the committed costs increase. Increasing construction costs render effective and efficient decision-making on cost issues a sine-qua-non for designers. To this end, designers use a number of cost estimating techniques and intuitive judgments by utilizing both their experience and data from previous projects. Several cost estimating methods for the different phases of a project can be observed in the literature, including; traditional detailed breakdown cost estimation; simplified breakdown cost estimation; cost estimation based on cost functions; activity-based cost estimation; cost index method; and expert systems.
A system that utilizes AI techniques for developing accurate preliminary cost estimates was developed and described in this study. AI has been used previously in construction applications as described in the following section. The estimating system utilizes a neural network to estimate the cost of various alternatives for composite flooring systems for multistory buildings. The system can handle various loading requirements and structural spans and permits the rapid estimation of the cost of several design alternatives in order to select the least expensive. The cost estimate produced by the system is accurate because it is based on actual building configurations, real superimposed loads and local components’ unit costs. To provide preliminary construction cost estimates to designers, RSMeans publishes an Assemblies Cost Book on an annual basis. The Assemblies Cost Book provides the cost of various construction systems allowing the designer to make informed decisions before committing to a specific construction or system type (RSMeans Citation2019). Although the Assemblies Cost Book provides cost information for many of the systems used in a building (i.e. structural flooring, exterior wall, roofing, architectural flooring, etc.), there is a limited number of configurations included in the book. For example, for the structural flooring system, cost information is only provided for a limited number of structural spans and superimposed load. Furthermore, RSMeans utilizes unit costs for the various components comprising the various assemblies based on the average unit costs from different cities around the US. On a real project, however, the superimposed loads and building configuration may not be the exact values included in the Assemblies Cost Book. Moreover, the local unit costs may differ from the unit costs used by RSMeans. In such a case, the use of the Assemblies Cost Book can lead to inaccurate cost estimates. Summary for ANNs model from RSMeans Data, as shown in :
Table 3. Details for the variables
Output – Assemblies Book Cost Per S.F.
Y: Total Cost
Materials Cost
Installation Cost
Input – Assemblies Book
X1: Bay Size 1 (FT)
X2: Bay Size 2 (FT)
X3: Superimposed Load (P.S.F)
X4: Total Load (P.S.F)
X5 – X12: System Components
5.3. Description of the methodology
To train the ANN, a large number of cost data of various design alternatives is needed. Therefore, as illustrated in ;
The first step (Step 1), to develop the ANN model starts with the preparation of cost data (assemblies and units) of the three structural flooring systems, e.g. a composite beams and cast in place slab, composite beams, deck and slab, and W shape, composite deck and slab. It is needless to say that although these three particular structural systems are considered here, other systems could be subsequently incorporated into such a model if appropriate data is available.
The data used in this study are obtained from the RSMeans Assemblies Books for the period 1997 to 2019. The data obtained from RSMeans consist of assembly cost ($/sf of floor) as the dependent variable; and the structural span (ft), superimposed load (p.s.f), unit cost of sheet metal ($/LF of sheet), unit cost of concrete ($/CY), unit cost of steel structural ($/ton), and total load (p.s.f) as the independent variables. As discussed previously, ANN requires a large amount of data for accurate training; therefore, we used data from over a 20 year period. Such a large volume of data also ensures that cost variation patterns over the historical years are adequately captured and accurately reflected in future predictions through the ANN model. Since adequate data from real construction projects are often not available to researchers, the data from RSMeans are used as a synthetic data source to prove the feasibility and usefulness of developing intelligent ANN models during the value engineering phase for preliminary construction estimation. In addition, RSMeans is a comprehensive and reliable source of construction cost data, which makes it extremely suitable for use in our research.
Chart 1. Research methodology workflow
The second step (Step 2), shown in , deals with a random division of the entire dataset prepared in Step 1 into three subsets for training, validation, and testing. This technique is followed to prevent the ANN model from problems related to over-fitting and under-fitting. The concepts of over-fitting vs. under-fitting are discussed in detail in (Chakraborty, Elzarka, and Bhatnagar Citation2016). The training subset is used for computing the gradient and updating the ANN weights and biases. The validation set is used to monitor the error during the training process and adjust the weights and biases accordingly. The validation error normally decreases during the initial phase of training, as does the training set error. However, when the network begins to over-fit the data, the error on the validation set typically begins to rise.
The network weights and biases are saved at the minimum of the validation set error. The testing set is not used during training, but it is used to estimate the final accuracy of the model vis-à-vis to analyze the “generalization error”. That is to say, what the error will be for any future predictions that are made using the resulting ANN model. This process is also known as cross-validation.
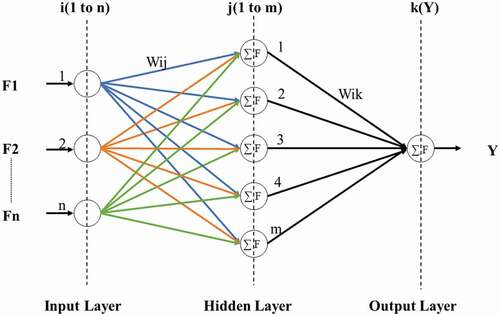
The third step (Step 3), shown in , performs the actual training of the ANN model. ANNs have biologically inspired structures. The human brain consists of neurons that are connected to each other via synapses where the actions of neurons depend on the stimuli coming from different synapses. The similarity between (ANN) and the human brain is only limited to its structure. The figure illustrates a neural network model, which consists of n feature neurons (one for each independent variable), one hidden layer containing k neurons and one target neuron (for the dependent variable). Neurons in the hidden layer perform nonlinear transformations. As shown in , the process is carried out by neurons in the hidden layer takes a set of inputs (F1, F2, …, Fn) and each input is then multiplied with its corresponding weight (w1, w2, …, wn). These weighted inputs are summed up, adjusted by a bias value, and treated by an activation function and passed on to neurons in the next layer.
Figure 2. Illustration of the computational process inside a neuron of an ANN
The fourth step (Step 4), shown in , performs a critical function, i.e. it aids in the adjustment of the weights and biases of the network such that the accuracy of the ANN is increased. Thus, protecting the ability of the ANN to generalize to non-training data by reducing the chances for overfitting. It stops the training process when the error rate on the non-training validation subset increases continuously for six consecutive repetitions.
The fifth step (Step 5), shown in , uses the testing data to estimate the final performance of the ANN model after training and validation. This step helps to realize how well the model will perform when the user implements it in practice, i.e. how accurately it will predict the assembly cost when it is supplied with a set of new data corresponding to the independent variables.
5.4. Activation function
N = artificial neuron calculates the “weighted sum” of its inputs and adds a bias, as shown in the below by the net input.
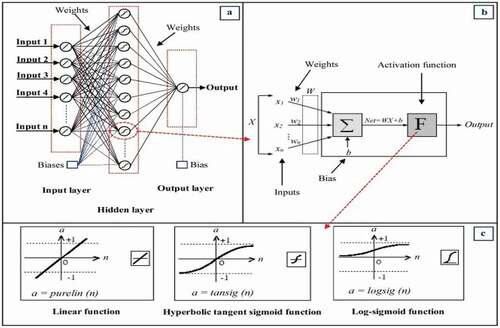
Figure 3. Illustratation of the architecture of the most frequently applied ANN for the modeling (Bagheri, Akbari, and Mirbagheri Citation2019)
5.4.1. Mathematically
The activation function is a nonlinear transformation that we do over the input before sending it to the next layer of neurons or finalizing it as output. Several different types of activation functions are used in Deep Learning. Our activation function is a Sigmoid Function that is a widely used activation function is defined as:
5.4.2. Graphically
The most frequently used ANN for the modeling as shown in , (a) architecture of the three-layer MLPANN, (b) calculation in a single artificial neuron, (c) sigmoidal and linear activation functions used in modeling studies (Bagheri, Akbari, and Mirbagheri Citation2019).
This is a smooth function and is continuously differentiable. The biggest advantage that it has over step and linear function is that it is nonlinear. This is an incredibly cool feature of the sigmoid function. This essentially means that when I have multiple neurons having a sigmoid function as their activation function – the output is nonlinear as well. The function ranges from 0 to 1 having an “S” shape.
Equation/Function from Matlab is
Tansig (a) = 2/(1 + exp (−2a)) – 1
Tansig (x) = 2/(1 + exp (−2x)) – 1
Activation Function can be represented by the following equation:
6. Discuss the results
The development of the ANN was carried out in MathWorks® MATLAB® software using the Neural Fitting app, which allowed us to select the data, create and train a network, and evaluate its performance using mean square error and regression analysis. Mean square error is the average squared difference between the actual values and the predicted values of the dependent variable, which is mathematically represented by below Equation foe mean square error. Lower values are better and zero means that there was no error in the model predictions. Regression R-values measure the correlation between the actual values and the predicted values of the dependent variable, which is mathematically represented by the below Equations. An R-value of 1 suggests that there is a close relationship, whereas, 0 suggests a random relationship between the actual and the predicted values.
where is the total number of data points under consideration;
is the iterator;
and
are the mean and standard deviation of
, respectively, and
and
are the mean and standard deviation of
.
In this research, a two-layer (with one hidden and one output layer) feed-forward neural network with sigmoid activation function in the hidden neurons and linear output neurons was used, as shown in . This choice of the neural network was influenced by some of the existing research works done by (Chao and Skibniewski Citation1994). Although the number of hidden layers in a neural network is not restricted, Hegazy, Fazio, and Moselhi (Citation1994) proposed that a single hidden layer is sufficient to generate an adequate multi-dimensional mapping between the independent and dependent variables, provided that the data is consistent and there are enough neurons in its hidden layer. This network was trained with a Levenberg-Marquardt backpropagation learning algorithm.
Figure 4. View of the network diagram

Although the gradient descent–based backpropagation algorithms have been used in the past for cost estimation tasks (Hegazy, Fazio, and Moselhi Citation1994), more recently, the Levenberg–Marquardt–based backpropagation algorithm has been shown to significantly outperform the gradient descent technique (Roweis Citation1996) which is the reason it was chosen as the learning algorithm in this research.
The dataset used in this study consisted of the number of data points, which were divided into training, validation, and testing subsets, each containing the number of samples, as shown in . The number of neurons required in the hidden layer was determined through the cross-validation process. We found that 50 neurons in the hidden layer were the optimal choice for both the floors’ structural system datasets.
Table 4. Details for the database (dData points, training, validation, and testing)
The results are tabulated in for the floors’ structural system in the following tables. Note that the performance of the ANN models starts to deteriorate when the number of neurons is increased beyond the optimal values, which are mentioned above. Finally, the optimum mean square error is very close to zero and the optimum R-value is very close to 1 for the respective datasets, as shown in , which suggests that the ANN models can accurately capture the unknown patterns in the dataset and make predictions that match very well with the actual values. Note that the choice of the architecture of the neural network (i.e. the number of hidden layers and neurons) together with the choice of the learning algorithm can have a large number of possibilities if not infinite and hence, finding the (global) best can be extremely time-consuming if not impossible.
However, evaluating all such possibilities was deemed unnecessary in this case as we obtained very impressive results with our choice of the architecture and the learning algorithm. Especially for a medium-size problem like the one considered in our research (i.e. the number of the data points is less than a thousand), it is better to opt for a simpler neural network architecture so as to minimize the chances of overfitting.
views the error histogram to obtain additional verification of network performance. The blue bars represent training data, the green bars represent validation data, and the red bars represent testing data. The histogram can give us an indication of outliers, which are data points where the fit is significantly worse than the majority of data. In our case, as shown in , (x-axis) we can see that while most errors fall (y-axis), there is an error for a training point, validation points, and test points. These outliers are also visible on the testing regression plot. It is a good idea to check the outliers to determine if the data are bad, or if those data points are different than the rest of the data set. If the outliers are valid data points but are unlike the rest of the data, then the network is extrapolating for these points. shows the Regression, this is used to validate the network performance. The following regression plots display the network outputs with respect to targets for training, validation, and test sets. For a perfect fit, the data should fall along a 45-degree line, where the network outputs are equal to the targets. For this problem, the fit is reasonably good for all data sets, with R values in each case of 0.995 or above, as shown in . If even more accurate results were required, we could retrain the network. This will change the initial weights and biases of the network and may produce an improved network after retraining. shows the Performance figures and the best validation performance occurs, a plot of the training errors, validation errors, and test errors appears, for all structural systems included in this study.
Figure 5. View of the error histogram to obtain additional verification of network performance
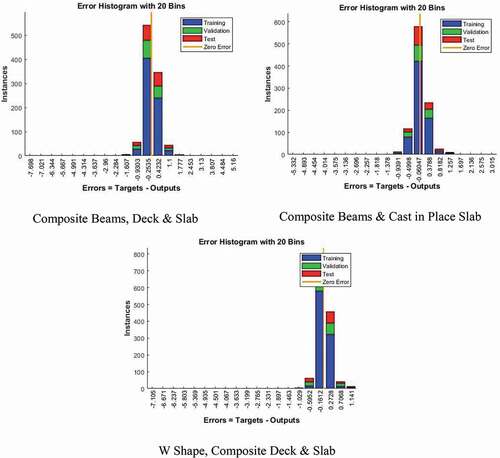
Figure 6. Performance of a linear regression between the network outputs and the corresponding targets
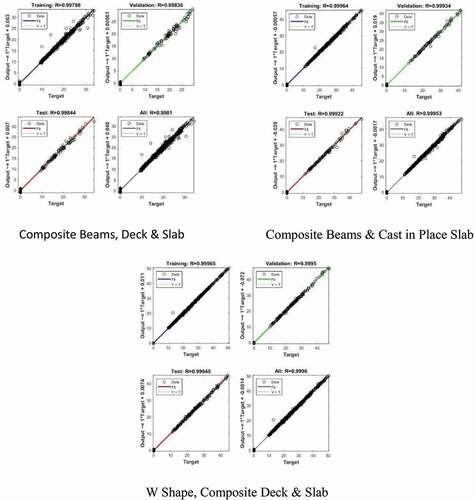
Figure 7. Performance figures and the best validation performance occurs
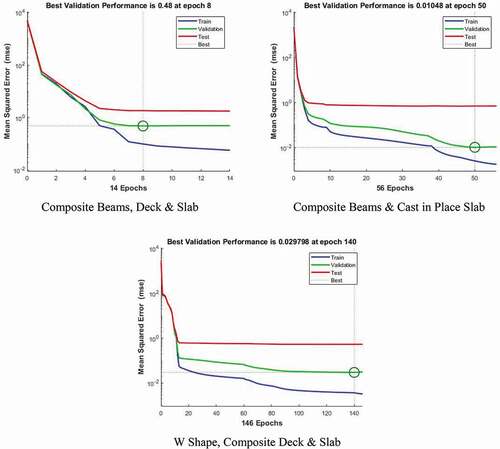
Table 5. Relationship between the number of neurons present in the hidden layer and the final ANN performance for the floor dataset
The resulting ANN model is shown to be capable of estimating the cost of the composite flooring systems for different combinations of structural spans, superimposed loads based on local unit costs of metal deck, concrete, and steel structures. This model can expedite and improve the quality of the cost estimates permitting the consideration of several design alternatives that can be compared to select the least expensive. For example, a user can quickly evaluate the effect of increasing the beam span on cost and the effect of using different flooring systems. Currently, only three (3) structural systems are included in this study. However, the proposed model can be easily expanded and modified to include other structural systems that can be used for multistory buildings. In addition, the proposed model can be used for substructure system and other superstructure systems. The scope of the proposed model can also be expanded by using cost data from real projects as they become readily available in the future. Another advantage of the ANN model is that it can generate accurate preliminary cost estimates without detailed structural design. The cost of structural systems depends on its structural dimensions, which in turn depend on the span and the superimposed loads. Because the ANN model is trained with a large number of costs of various designs that were completed by the RSMeans engineers, it is capable of producing accurate preliminary cost estimates without the need for more detailed structural designs.
7. Conclusion
Multistory buildings are used for various purposes, and their structural design is subject to a broad range of loading requirements that may not be included in widely available estimating books such as those published by RSMeans. Although composite systems can be used in buildings as discussed above, this research has focused on three composite systems for flooring systems since they are very popular around the world. This study aims to introduce recommendations for the optimum composite flooring system for multistory buildings to help decision-makers in the preliminary design from a perspective of the total cost (materials cost and installation cost), span, load, and the purpose of the building. In order to investigate the relationship between the statuses of conceptual design for the structural systems and cost estimating, data is collected through a survey for RSMEANS (Assemblies Cost Data) from 1997 to 2019. The dimensions and the cost of such flooring systems depend on many variables including the superimposed load and the structural span. The nature of multistory buildings makes it ideal to automate the process of developing accurate cost estimates for their systems. The data obtained from RSMeans consist of assembly cost ($/sf of floor) as the dependent variable; and the structural span (ft), superimposed load (p.s.f), unit cost of sheet metal ($/LF of sheet), unit cost of concrete ($/CY), unit cost of steel structural ($/ton), and total load (p.s.f) as the independent variables. A simple computer model is designed for recommending the optimal composite flooring system of a multistory building during the preliminary design stage. This model was created based on multiple criteria that may change independently and in concert with value engineering.
The results show that conceptual design status can be effectively used to predict the cost of project success and the proposed AI models produce satisfactory prediction results. In this study, we presented an ANN model for predicting the assembly cost of composite flooring systems based on the structural characteristics and the unit cost of materials. We have used a synthetic dataset generated from the RSMeans repository to produce the model and assess the feasibility of the model. Although we have demonstrated the feasibility of the model using data for three structural systems (floor systems), the scope of the model can be easily expanded to include other structural systems as well.
Our results suggest that the proposed ANN model is capable of producing cost predictions very quickly and accurately when a substantial amount of data is available for model training. In addition, once the model is trained, it does not require in-depth knowledge about the inner ANN mechanism to apply it in real projects. In such cases, the estimator can simply enter the basic structural properties and the corresponding unit cost of the materials to produce an accurate output of the structural assembly cost. Such quick and accurate cost predictions are envisioned to be extremely beneficial during the value-engineering phase of construction projects. Thus, enabling estimators to evaluate various design alternatives and strike the right balance between the cost, performance, and reliability of the structural systems.
8. Recommendations for future works
This model has been successfully applied to construction project management, project performance, and decision-making in construction. The information from the model can be utilized to aid in making decisions related to value engineering where construction industry practitioners often underestimate the impacts. The model will enable project managers to address issues by simulating their impacts on the project before they become problems. Details and further analysis of the structural models are kept for further reference and can be discussed as needed.
Disclosure statement
No potential conflict of interest was reported by the authors.
Data availability statement
All data, models, and code generated or used during the study appear in the submitted article.
References
- Bagheri, M., A. Akbari, and S. A. Mirbagheri. 2019. “Advanced Control of Membrane Fouling in Filtration Systems Using Artificial Intelligence and Machine Learning Techniques: A Critical Review.” Process Safety and Environmental Protection 123: 229–252. doi:https://doi.org/10.1016/j.psep.2019.01.013.
- Chakraborty, D., H. Elzarka, and R. Bhatnagar. 2016. “Generation of Accurate Weather Files Using a Hybrid Machine Learning Methodology for Design and Analysis of Sustainable and Resilient Buildings.” Sustainable Cities and Society 24: 33–41. doi:https://doi.org/10.1016/j.scs.2016.04.009.
- Chao, L. C., and M. J. Skibniewski. 1994. “Estimating Construction Productivity: Neural-network-based Approach.” Journal of Computing in Civil Engineering 8 (2): 234–251. doi:https://doi.org/10.1061/(ASCE)0887-3801(1994)8:2(234).
- Cheng, M.-Y., H.-C. Tasi, and W.-S. Hsie. 2009. “Web-based Conceptual Cost Estimates for Construction Projects Using Evolutionary Fuzzy Neural Inference Model.” Automation in Construction 18 (2): 164–172. doi:https://doi.org/10.1016/j.autcon.2008.07.001.
- Dell’Isola, A. J. 1982. Value Engineering in the Construction Industry. 3rd ed. s.l.:VanNostrand and Reinhold Co., N. Y.
- Fu, F. 2009. “Progressive Collapse Analysis of High-Rise Building with 3-D Finite Element Modeling Method.” Journal of Constructional Steel Research 65 (6): 1269–1278. doi:https://doi.org/10.1016/j.jcsr.2009.02.001.
- Garcia De Soto, B., and T. B. Adey. 2016. “Preliminary Resource-based Estimates Combining Artificial Intelligence Approaches and Traditional Techniques.” Procedia Engineering 164: 261–268. doi:https://doi.org/10.1016/j.proeng.2016.11.618.
- Gunaydın, H. M., and S. Z. Dogan. 2004. “A Neural Network Approach for Early Cost Estimation of Structural Systems of Buildings.” International Journal of Project Management 22 (7): 595–602. doi:https://doi.org/10.1016/j.ijproman.2004.04.002.
- Hasançebi, O. 2017. “Cost Efficiency Analyses of Steel Frameworks for Economical Design of Multi-storey Buildings.” Journal of Constructional Steel Research 128: 380–396. doi:https://doi.org/10.1016/j.jcsr.2016.09.002.
- Hegazy, T., P. Fazio, and O. Moselhi. 1994. “Developing Practical Neural Network Applications Using Back‐propagation.” Computer‐Aided Civil and Infrastructure Engineering 9 (2): 145–159. doi:https://doi.org/10.1111/j.1467-8667.1994.tb00369.x.
- Jassim, H. 2018. Artificial Neural Networks as a Technique in Construction Engineering and Management. Luleå University of Technology.
- Kaveh, A., and A. S. M. Abadi. 2010. “Cost Optimization of a Composite Floor System Using an Improved Harmony Search Algorithm.” Journal of Constructional Steel Research 66 (5): 664–669. doi:https://doi.org/10.1016/j.jcsr.2010.01.009.
- Kim, H.-J., Y.-C. Seo, and C.-T. Hyun. 2012. “A Hybrid Conceptual Cost Estimating Model for Large Building Projects.” Automation in Construction 25: 72–81. doi:https://doi.org/10.1016/j.autcon.2012.04.006.
- Klanˇsek, U., and S. Kravanja. 2006a. “Cost Estimation, Optimization and Competitiveness of Different Composite Floor Systems-Part 1: Self-Manufacturing Cost Estimation of Composite and Steel Structures.” Journal of Constructional Steel Research 62 (5): 434–448. doi:https://doi.org/10.1016/j.jcsr.2005.08.005.
- Kumar, P. S., and S. Gururaj. 2019. “Conceptual Cost Modelling for Sustainable Construction Project Planning— A Levenberg–Marquardt Neural Network Approach.” Applied Mathematics & Information Sciences 13 (2): 201–208. doi:https://doi.org/10.18576/amis/130207.
- Mohamed, A., and T. Celik. 2002. “Knowledge Based-system for Alternative Design, Cost Estimating and Scheduling.” Knowledge-Based Systems 15 (3): 177–188. doi:https://doi.org/10.1016/S0950-7051(01)00155-1.
- Mohammad, K., M. Mostafa, and A. Hamdy. 2018. “Using Artificial Neural Networks to Model Cost Overruns in Real Estate Projects.” International Journal of Research and Scientific Innovation (IJRSI) V (X).
- Moselhi, O., T. Hegazy, and P. Fazio. 1991. “Neural Networks as Tools in Construction.” Journal of Construction Engineering and Management 117 (4): 606–625. doi:https://doi.org/10.1061/(ASCE)0733-9364(1991)117:4(606).
- Roweis, S. 1996. Levenberg-marquardt Optimization. s.l.: University Of Toronto.
- RSMeans. 2019. Assemblies Costs Book. s.l.:RSMeans data from Gordian.
- Shi, X., et al. 2016. “A Review on Building Energy Efficient Design Optimization Rom the Perspective of Architects”. Renewable and Sustainable Energy Reviews 65: 872–884. doi:https://doi.org/10.1016/j.rser.2016.07.050.
- Swei, O., J. Gregory, and R. Kirchain. 2017. “Construction Cost Estimation: A Parametric Approach for Better Estimates of Expected Cost and Variation.” Transportation Research Part B 101: 295–305. doi:https://doi.org/10.1016/j.trb.2017.04.013.
- Wang, W.-C., et al. 2017. “Conceptual Cost Estimations Using Neuro-Fuzzy and Multi-Factor Evaluation Methods for Building Projects.” Journal of Civil Engineering and Management 23 (1): 1–14. doi:https://doi.org/10.3846/13923730.2014.948908.
- Wang, Y., C.-Y. Yu, and -H.-H. Chan. 2012. “Predicting Construction Cost and Schedule Success Using Artificial Neural Networks Ensemble and Support Vector Machines Classification Models.” International Journal of Project Management 30 (4): 470–478. doi:https://doi.org/10.1016/j.ijproman.2011.09.002.
- Yadav, R., M. Vyas, V. Vyas, and S. Agrawal. 2016. “Cost Estimation Model (Cem) for Residential Building Using Artificial Neural Network.” International Journal of Engineering Research & Technology (IJERT) 5 (1): 430–432.
- Zima, K. 2015. “The Case-Based Reasoning Model of Cost Estimation at the Preliminary Stage of A Construction Project.” Procedia Engineering 122: 57–64. doi:https://doi.org/10.1016/j.proeng.2015.10.007.