
 ?Mathematical formulae have been encoded as MathML and are displayed in this HTML version using MathJax in order to improve their display. Uncheck the box to turn MathJax off. This feature requires Javascript. Click on a formula to zoom.
ABSTRACT
In this paper, a new three-stage virtual frontier SBM-DEA (Slacks-Based Measure of Efficiency in Data Envelopment Analysis) model is proposed to evaluate the sustainable efficiency of the construction industry. The relevant construction industry data of 30 Chinese PARs (provincial administrative regions) from 2011 to 2016 are brought into the model to calculate the sustainable efficiency of each administrative region and verify the rationality of the model. In order to solve the problem that the efficiency values of multiple effective decision units cannot be differentiated in traditional DEA model evaluation, the reference decision unit set and the evaluation decision unit set are respectively different sets in the virtual frontier SBM-DEA model. In the three-stage virtual frontier SBM-DEA, the reference decision unit set and evaluation decision unit set are two different sets that can distinguish among the effective decision units of DEA. The analysis results show that the average sustainable efficiency values of the construction industry in eastern, middle and western China exhibit a decreasing trend, at 0.643, 0.586 and 0.4830, respectively. Moreover, the technical equipment rate and external environmental factors play an important role in the sustainable efficiency of the construction industry and the CO2 emission reduction potential of most PARs shows a downward trend.
GRAPHICAL ABSTRACT
1. Introduction
The vigorous development of the construction industry has made great contributions to promoting China’s economic development. The total output value of China’s construction industry accounts for an increasing proportion of the GDP, from 6.30% in 1980 to approximately 29% in 2018. However, the construction industry is an industry with high energy consumption and high emission, which will produce a large amount of construction waste, sewage, greenhouse gas and other harmful substances in the construction process, seriously threatening people’s healthy life. China has become the country with the most CO2 emissions in the world (Shen et al. Citation2016). The CO2 emissions of the construction industry account for 30–40% of the total emissions. According to the data in the China Building Energy Consumption Research Report (2018) issued by the China Energy Conservation Association, indicators such as building energy intensity and carbon emission factors showed a certain downward trend after 2012, indicating that energy conservation and emission reduction have played a certain role, but the total emissions are still growing, and the sustainable development of the construction industry is imperative.
In 1987, the World Commission on Environment and Development (WCED) released the report “Our common Future”, the report defines sustainable development as ”a development model that can meet the needs of contemporary people and ensure that it will not harm future generations”, this definition has been recognized by most countries in the world. Development, environmental protection, economic development and human beings are the core, important content, purpose and centrosome of sustainable development. Sustainable development is the development mode of harmonious coexistence between human and nature (Shang Citation2000). In 1993, Dr Charles Cabot proposed the concept of “sustainable architecture” based on the principle of sustainable development. Sustainable architecture refers to the construction projects guided by the concept of sustainable development. The essence of sustainable architecture is energy-saving and emission reduction, which is conducive to the health of residents (Sun Citation2016). The Chinese government has promulgated a series of documents, including The Opinions of the General Office of the State Council on Promoting the Sustainable and Healthy Development of the Construction Industry, the Outline of the 13th Five Year Plan for Housing and Urban Rural Construction, and the 13th Five Year Plan for the Development of the Construction Industry, to promote the reform of the construction industry, accelerate the industrial upgrading, and promote the sustainable and healthy development of the construction industry.
The purpose of this paper is to construct a three-stage virtual frontier SBM-DEA model to calculate the production efficiency and CO2 emission reduction potential of the construction industry in various provinces in China to provide suggestions for the sustainable development of its construction industry. Because the three-stage virtual frontier SBM model can not only eliminate the impact of external environment on the evaluation results but also solve the problem that the traditional DEA model cannot distinguish the differences among multiple effective decision-making units, the SBM evaluation results are more reasonable. The remainder of this paper is arranged as follows. The second section provides a literature review. The third section describes the principle, data index and source of the three-stage virtual SBM-DEA model. The fourth section analyzes the results. The final section summarizes the whole paper and proposes some suggestions for the sustainable development of China’s construction industry.
2. Literature review
The most common and basic method to evaluate production efficiency is data envelopment analysis (DEA), which was first proposed by scholars in 1978 (Charnes, Cooper, and Rhodes Citation1978). Because this model has the advantage of unnecessary estimation of parameters by constructing a production function, it has been widely used in the productivity measurement of manufacturing, agriculture, computer industry and other industries or sectors (Hjalmarsson and Veiderpass Citation1992; Brockett et al. Citation1997; Mukherjee, Ray, and Miller Citation2001; Kulshreshtha and Parikh Citation2002; Chen and Ali Citation2004; Coelli and Rao Citation2005; Azadeh et al. Citation2007; Önüt and Soner Citation2007; Sarica and Or Citation2007; Resende Citation2008; Mohamed and Mostafa Citation2009).
The basic DEA model ignores the effect of nonexpected output on production efficiency. To solve this problem, Tone proposed the Slacks-Based Measure of Efficiency in Data Envelopment Analysis (SBM-DEA) method in 2001 (Tone Citation2001). The traditional one-stage DEA method does not consider the influence of the external environment and random error on the efficiency value; thus, the results are not comparable. Fried constructed a three-stage DEA model that combines the traditional DEA method with the stochastic frontier analysis (SFA) method, eliminating the influence of external factors on the calculation results through the stochastic frontier model, and then applied the DEA model to calculate a more reasonable efficiency value (Fried et al. Citation2002).
However, the DEA methods described above have a common defect in the evaluation – that is, when the evaluation efficiency values of multiple decision-making units are 1, these decision-making units are recognized as effective. However, the DEA models mentioned above cannot distinguish the differences between these effective decision-making units. To solve this problem, many scholars have proposed many improved methods, the most representative of which is super DEA (Andersen and Petersen Citation1993). This method was further improved by others (Zhu Citation2001; Xue and Harker Citation2002; Chen Citation2005; Chiu, Chen, and Bai Citation2011). However, these models have different reference boundaries when evaluating different Decision-Making Units (DMUs); thus, the results will be unreasonable.
The virtual frontier DEA model was first proposed by Bian and Xu in 2013 (Bian and Xu Citation2013). In this DEA model, the reference set of DMU and evaluation set of DMU are two different sets, making it possible to distinguish between the efficiency values of multiple effective DMUs in the traditional DEA model. In the process of evaluating the efficiency of DMU, the reference level of DMU remains unchanged; thus, the evaluation result is more reasonable than that of the super DEA model. Due to its many advantages, the virtual frontier DEA model is applied to the efficiency evaluation of the airline industry, transportation industry and other fields (Cui and Li Citation2015; Cui, Wang, and Li Citation2015; Cui et al. Citation2016; Wanke and Barros Citation2016).
Some scholars have combined the virtual frontier DEA method with the traditional three-stage DEA method to build a three-stage virtual frontier DEA model (Cui and Li Citation2014), which has the following advantages: (1) the model can eliminate the influence of external factors on efficiency evaluation; (2) the model can distinguish the differences among multiple effective DMUs; (3) the result is more reasonable because the reference set of DMU remains unchanged in the evaluation process. However, this model has not been used to measure the production efficiency of the construction industry. In this paper, based on the virtual frontier theory, a three-stage virtual frontier SBM-DEA model is constructed to evaluate the production efficiency of China’s construction industry and compare the efficiency of different provinces.
We reviewed the previous literature on the efficiency evaluation of the construction industry and found that the efficiency evaluation of the construction industry mainly lies in productivity evaluation (Kapelko et al. Citation2015), cost and profitability evaluation (Tsolas Citation2011; Kapelko, Lansink, and Stefanou Citation2014; Hu and Liu Citation2016), regional sustainability evaluation (Yan et al. Citation2017), energy use efficiency evaluation and carbon emission reduction potential evaluation (Hu and Liu Citation2015; Xue et al. Citation2015). Most of these documents have the following disadvantages: (1) most of the literature have adopted the traditional DEA model, leading to inaccurate evaluation results due to the defects of the traditional DEA model; (2) some of the literature used CO2 emission as an unexpected output to evaluate the productivity of the construction industry, but most only calculated the direct emission of CO2 from the energy consumed by the construction industry without considering the indirect emission of CO2 from the power, heat and the production processes of building materials consumed by the construction industry. The literature revealed that the indirect emission of CO2 accounts for most of the total emission of CO2 in the construction industry; thus, only considering the direct emission of CO2 consumed by the construction industry as the total emission of the construction industry will lead to inaccurate evaluation results; (3) in the evaluation index system, no desirable indicators exist to evaluate the efficiency of the sustainable development of the construction industry.
To address the gaps in the previous literature, the innovations of this paper are as follows: (1) the three-stage virtual frontier SBM-DEA model is established to evaluate the production efficiency of China’s construction industry. The model combines the advantages of the virtual frontier SBM-DEA model and three-stage model, making the evaluation results more accurate, and the CO2 emission reduction potential of each province in China is calculated according to the virtual frontier theory; (2) the previous literature rarely introduced the expected index of evaluating the green development of the construction industry. This paper innovatively introduces the green building certification area as the evaluation index of sustainable development, making the index system more perfect; (3) a more reasonable CO2 calculation formula is constructed that not only includes the CO2 emissions of the energy consumed by the construction industry but also considers the power and heat consumed by the construction industry and the CO2 emissions in the production process of construction materials consumed by the construction industry.
3. Methods
3.1. Traditional three-stage SBM Data Envelopment Analysis
3.1.1. SBM-DEA model
Because the traditional DEA model cannot evaluate the activity efficiency with undesirable outputs, this paper adopts the SBM-DEA model proposed by Tone to calculate the efficiency (Tone Citation2001). The model is as follows:
Formula: represents the productivity considering the undesired output,
. The inputs, desirable outputs and undesirable outputs of a decision-making unit are represented by the matrices X, Y and D respectively. m, s1 and s2 represent the quantities of inputs, desirable outputs and undesirable outputs respectively. Vectors
and
represent the slack variables of inputs and undesired outputs, respectively; vector
represents surplus variables of expected outputs. The DMU being estimated is represented by subscript 0, λ is weight vector.When
, the input-output efficiency of the DMU is effective.
3.1.2. Stochastic Frontier Analysis (SFA)
In general, the DEA model will be affected by management inefficiency, environmental impact and other external interference factors when calculating the efficiency. SFA was proposed (Dennis, Ca, and Peter Citation1977; Meeusen and Broeck Citation1977) and that can eliminate the influence of external factors on the calculation results of the DEA model. The environment variables and input slack variables in DEA are used as explanatory variables and interpreted variables, respectively, to build the SFA model:
Sni indicates the slack variable for the n-th input of DMUi, Zi= (Z1i, Z2i, ···, Zki) represents the environment variables, refers to the influence of environment variable on input slack variable Sni, and the value is generally
.
,
and
are respectively used to represent mixed error term, random interference and management inefficiency, in which
and
are assumed to be independent of each other.
The regression results of the SFA model are used to adjust the input of DMU. Because the input energy cannot be negative, the input of DMU in a better external environment is increased to remove the influence of environmental factors and random factors. Based on the input of the most effective DMU, the adjustment of the input amount of each DMU is as follows:
Where and
are the DMU inputs before and after adjustment, respectively. The formula in the first parenthesis on the right of the above formula means that all DMU are adjusted to the same external environment, and the formula in the second parenthesis means that the random error of all DMU is adjusted to the same situation.
3.1.3. The calculation steps of traditional three-stage SBM-DEA
Fried put forward the traditional three-stage DEA model in 2002 by combining DEA and SFA models (Fried et al. Citation2002). The three-stage DEA model can eliminate the influence of non-operational factors such as external environment and random error. In order to evaluate production activities with unexpected output more reasonably, some scholars used SBM-DEA model to replace the traditional DEA model and formed a three-stage SBM-DEA model to evaluate the efficiency of production activities. The three-stage SBM-DEA model calculation is divided into the following three steps:
1. Run the traditional SBM-DEA for calculation.
2. Conduct SFA (Stochastic Frontier Analysis). The stochastic frontier model can evaluate the influence of environmental factors and other non-operational factors on the input relaxation variables of SBM model, calculate the input redundancy caused by the influence of external factors. Then the stochastic frontier analysis model is used to adjust the inputs to eliminate the influence of external factors.
3. Run the SBM model for calculation again. The adjusted input variables and the original output variables are brought into the model for calculation, and the real efficiency is obtained free from external factors.
3.2. Three-stage virtual frontier Data Envelopment Analysis
3.2.1. Virtual frontier SBM-DEA
In the traditional SBM-DEA model, when the evaluation efficiency of multiple decision-making units is all 1, these decision-making units are considered effective, but the traditional SBM-DEA model cannot distinguish the differences between these effective decision-making units. In order to solve this problem, Tone corrected the slack variables of input and output and proposed super-efficiency SBM model (super-SBM) (Tone Citation2003), which solved the problem in the traditional model. However, the change of reference set in the evaluation process of super-efficiency SBM model would lead to unreasonable evaluation results.
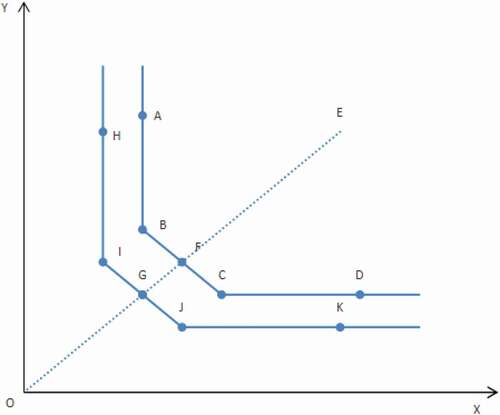
Virtual frontier data envelopment analysis (virtual frontier DEA) was first proposed by Bian and Xu in 2013 (Bian and Xu Citation2013). The principle of virtual frontier data envelopment analysis is shown in . In the evaluation of traditional DEA model, A, B, C, D and E are decision-making units. It can be seen from the figure that A, B, C and D are effective decision-making units, while E is invalid. However, the efficiency values of A, B, C and D are all 1, and the traditional DEA model cannot distinguish them. The virtual frontier DEA establishes A virtual frontier H, I, J and K as the optimal reference plane of A, B, C, D and E. The establishment of the virtual frontier plane is obtained by enlarging and shrinking the input and output in a certain proportion. Under the new reference plane, as the decision units A, B, C, D and E are all invalid, their efficiency values can be further compared.
Figure 1. The principle of virtual frontier DEA.
According to the principle of virtual frontier, the author constructs the virtual frontier SBM-DEA model. The model is as follows:
Where,,
,
, j=1,2,3 … ..J, J represents the decision-making unit.
,
and
represent the ith input, the rth desirable output and the rht undesirable output of decision-making unit J, respectively.
,
and
are input reference set, desirable output reference set and undesirable output reference set, respectively.
This paper will also discuss the improvement targets of input and output. It is assumed that the efficiency value of decision-making unit j in year t is, the input is
, the desirable output is
, and the undesirable output is
. The maximum efficiency value of each decision-making unit in year t is
. Under the condition that both
and
remain unchanged, the investment improvement goal of decision-making unit j in year t is
. In year t, if the efficiency of decision-making units j can be promoted to the maximum, then the input savings will be
. Similarly, when
and
remain unchanged, and when the efficiency of decision unit j is increased to the maximum in year t,
is the undesired output reduction. While
and
remain unchanged. When the efficiency of decision unit j is increased to the maximum in year t, the desirable output increment is
.
3.2.2. The calculation steps of three-stage virtual frontier SBM-DEA
The three-stage virtual frontier SBM-DEA model calculation is divided into the following three steps:
1. Run the virtual frontier SBM model for calculation.
2. Conduct SFA (Stochastic Frontier Analysis). Adjust the input to eliminate the influence of external factors.
3. Run the virtual frontier SBM model for calculation again to achieve real efficiency that is not affected by external factors.
4. Variable selection and data source
4.1. Variable description
In this paper, the author selects 30 PARs (provincial administrative regions) in China as the DMUs. Taiwan, Hong Kong, Macao and Tibet were not selected due to lack of data. The time span of the data is 2011–2016.
Input indicators: In this paper, Total Assets, Number of Employees, Technical equipment rate are selected as input variables, which respectively represent the labor, financial and technical input of the construction industry in each province. From the perspective of investment, the total assets of the construction industry are generally selected for the financial investment of the construction industry. The total assets of the construction industry not only represent the material wealth of that year but also represent the investment of the next year. The working time of the employees in the construction industry is the best variable to measure the labor input, but there is no relevant statistics on the average working time of the construction industry in China, so we use the number of employees to substitute. In this paper, the technical equipment rate of enterprises is adopted as the technical input of enterprises. The higher technical equipment rate of enterprises indicates that enterprises have more technical support to some extent.
Desirable output indicators: the paper selects Total Profit (100 million yuan), Floor Space of Buildings Completed (10,000 square meters), Certified green building area (10,000 sq.m) as the desirable output. The main form of economic income of enterprises is total profit, and the floor space of buildings completed in the construction industry is taken as a measure of the physical output. In order to better measure the sustainable development of the construction industry, we innovatively chose the certified green building area as the output index to measure the sustainable development of the construction industry. Green buildings not only save energy and reduce emissions but also are more suitable for human habitation.
Undesirable output indicators: CO2 emissions. The construction industry is an industry with huge CO2 emissions, and a large amount of CO2 emissions threaten the living environment of human beings. In this paper, CO2 emission is chosen as the undesired output to measure the sustainable development of construction industry.
The environmental factors used in the second stage of stochastic frontier analysis are degree of marketization, per capita GDP and Environmental Regulation. (1) Degree of marketization. Regions with a high level of marketization have relatively high capacity of resource allocation. Since the production activities of the construction industry consume a large amount of resources, the production and utilization efficiency of the upstream and downstream industries related to the construction industry will also have a greater impact on the efficiency of the construction industry. (2) Per capita GDP. There is a strong correlation between the level of construction efficiency and the level of local economic development, and the per capita GDP is an excellent reflection of the regional economic development, which is an important environmental variable affecting the efficiency of the construction industry. (3) Environmental regulation index. The construction industry is greatly affected by policy regulation. The improvement of environmental regulation intensity can ensure the sustainable development of the construction industry, but it will also affect the production efficiency of the construction industry to some extent.
4.2. Variable source and calculation method of CO2 emission
4.2.1. Variable source
Total Assets, Number of Employees, Technical equipment rate, Total Profit, Floor Space of Buildings Completed are from the China Statistics Yearbook On Construction, certified green building area is from the Statistical Report on Green Building Evaluation signs issued by the Ministry of housing and urban rural development. The degree of marketization comes from the Marketization index of China’s Provinces: Neri Report 2018 published by social science literature press, the per capita GDP comes from China Statistical Yearbook, the environmental regulation index is calculated by the method described by Wang Fang (Wang Citation2019).
4.2.2. The calculation method of CO2 emission
This paper establishes the following calculation model:
Among them, C is the total CO2 emission of the construction industry. Cdir is the direct carbon emission of the construction industry. Cind1 and Cind2 represent the first and second indirect carbon emissions of the construction industry respectively.
Where, Qi represents the consumption of the i-th energy, and the data can be obtained from China Statistics Yearbook On Construction; NCVi represents the low calorific value of the i-th energy, Ai is the carbon emission factor, Oi is the carbon oxidation rate, 44/12 is the carbon conversion coefficient coefficient. The values of ncvi, AI and oi can be obtained in General Principles for Calculation of the Comprehensive Energy Consumption (GB/T 2589–2008) and 2006 Intergovernmental Panel on climate change (IPCC) Guidelines for National Greenhouse Gas Inventory.
Where: Cind1 refers to the first indirect carbon emission of the construction industry (10,000 tons); Q1 represents the consumption of electricity in the production process of construction products (100 million kW·h); represents the carbon emission factor of electricity; Q2 represents the consumption of heat in the production process of construction products (1010KJ);
is the carbon emission factor of heat. Electricity consumption and heat consumption can be gained in the China statistical yearbook on construction, electric energy carbon emission factor from the China’s Regional Power Grid Baseline Emission factors, the heat energy of carbon emission factor can be calculated by the method provided in the China Building Energy Consumption Research Report (2018).
Where: Cind2 refers to the second indirect carbon emission of the construction industry (10,000 tons) represents the consumption of the j-th construction material;
represents the carbon dioxide emission coefficient of the j-th construction material, and the specific data are shown in (Feng and Wang Citation2015).
represents the recovery coefficient of the j-th construction material, and the specific data are shown in (Feng and Wang Citation2015). The usage data of various construction materials are from China Statistics Yearbook On Construction.
Table 1. The coefficient of carbon dioxide emission of building materials
Table 2. The recovery coefficient of building materials
In this paper, the most commonly used five building materials in the construction industry are selected to calculate the second type of indirect carbon emissions: Steel (tons), wood (cubic meters), cement (tons), glass (tons), aluminum (tons). When considering the regression coefficient, cement cannot be recovered generally, although building glass and wood can be partially recovered, the recycled glass is no longer used in the construction and the wood is difficult to be directly used in the construction without treatment. Therefore, the recycling factors of cement, glass and wood may not be considered in the calculation, and the regression coefficient is set as 0.
Referring to the previous research literature (Avkiran Citation1999), an isotonicity test is carried out in this paper to ensure the rationality of the selected input and output indicators, the results are shown in . The result shows that at 1% confidence level, there is a significant positive correlation between the indicators and the correlation indexes are all high, the isotonicity test is passed, the selected indicators are all feasible.
Table 3. Correlation matrix for inputs and outputs
5. Results and discussion
5.1. The results of SBM-DEA and virtual frontier SBM-DEA
In order to verify the rationality of the virtual frontier SBM-DEA model, this paper employs the traditional SBM-DEA model to calculate the production efficiency of the construction industry in 30 provinces of China firstly, and the results are shown in . As shown in , in 2016, the efficiency values of Beijing, Tianjin, Liaoning, Zhejiang, Hunan, Hainan and Xinjiang are all 1, and the traditional DEA could not distinguish the relative size of their efficiency value.
Table 4. The results of traditional DEA model
In this paper, the virtual frontier SBM-DEA efficiency of 30 PARS in construction industry is calculated by MATLAB programming, as shown in . Since the efficiency obtained by SBM-DEA is relative efficiency, and there is a small difference between the two PARS rankings in , so it is reasonable to use virtual frontier SBM-DEA to calculate the efficiency of the construction industry. In the virtual frontier SBM-DEA, the efficiency value of all PARS is less than 1, which can show the efficiency difference of each PARS, which improves the shortcoming of traditional DEA.
Table 5. The results of virtual frontier SBM-DEA model
The results in show that the efficiency of Beijing, Tianjin, Zhejiang and Jiangsu is all high, which shows that the productivity of these areas is high, the work of energy conservation and emission reduction is well done, and they are in the forefront of sustainable development.
5.2. The results of SFA analysis
According to some previous studies, if the environmental factor coefficient is negative, the increase of the coefficient will lead to the decrease of the input slacks, which means that the increase of the environmental factor coefficient will reduce the input waste or increase the output (Evan, Doğan, and Tırtıroğlu Citation1998; Cullinane et al. Citation2006). On the contrary, if the coefficient is positive, its increase will lead to more input waste or output reduction.
1.Degree of marketization. The coefficients of the three inputs are all negative and significant at the 1% level. The larger degree of marketization can improve the green production efficiency of the construction industry. Assuming a fixed output, greater marketization means less input.
2.Per capita GDP. All three correlation coefficients are negative and all are significant, which shows that if the per capita GDP of a region is high, the related construction industries in this region also develop well, thus promoting the efficient development of the construction industry. To some extent, the increase in per capita GDP will reduce the investment redundancy of the construction industry.
3.Environmental regulation intensity. The correlation coefficients of the three inputs are all positive and can pass the significance test, which shows that strong environmental regulation can reduce the pollution to the environment, but it will reduce the production efficiency. In other words, when the input quantity remains unchanged and the environmental regulation intensity increases, the output will be less than before.
5.3. The results of three-stage virtual frontier SBM-DEA
According to the results of SFA calculation, the production efficiency of the construction industry has a great correlation with environmental factors, which indicates that it is necessary to adjust input variables to eliminate the impact of environmental factors on production efficiency . The adjusted input and original output are taken into the virtual frontier SBM-DEA model for calculation, and the results are shown in .
Table 6. The results of SFA analysis
Table 7. The results of three-stage virtual frontier SBM-DEA
As shown in , the highest average efficiency value from 2011 to 2016 is Beijing, with an average efficiency value of 0.830, which shows that Beijing’s construction industry has achieved the best in efficient production, energy conservation and emission reduction. The original data can also prove this result, taking 2016 data as an example, Beijing’s total assets reached 2026.367 billion yuan, the highest in all regions. Technical equipment rate is 17,494 yuan/people and green building certification covers an area of 7.2 million square meters are at a high level, the total profit of the construction industry is 67.532 billion yuan, next to Jiangsu Province, which is in the second highest position. However, the number of employees is 581400and the unexpected output of CO2 emissions is calculated to be 3,403,800 tons, which is at a lower level. From the input and output data of Beijing and the calculated production efficiency, it can be concluded that the construction industry in Beijing has a high investment in assets and technology, which improves the productivity and keeps the CO2 emission at a low level. The improvement of production efficiency brings high profits to Beijing. The decrease in the number of employees also shows that the continuous improvement of production efficiency saves the investment of personnel. The second highest average efficiency is 0.777 in Tianjin. The technical equipment rate of construction enterprises in Tianjin is significantly higher than that in other regions every year, which shows that Tianjin attaches great importance to the production technology of the construction industry. The high input of production technology makes the production efficiency and energy saving and emission reduction efficiency improve, and the production efficiency of the construction industry in Tianjin keeps high year by year.
In order to analyze the sustainable production efficiency of China’s construction industry from the regional level, 30 PARs are divided into three regions: east, middle and west. The geographical division of PARs is shown in .
Table 8. The geographical division of the PARs
The average Sustainable Efficiency of the construction industry in the three regions from 2011 to 2016 is shown in . As shown in , firstly, the efficiency of the eastern and central regions is significantly higher than that of the western regions, which shows that there are regional differences in social development in China.Secondly, although the production efficiency of construction industry in various regions declined a little in 2015–2016, the efficiency in the whole inspection area showed an upward trend.
Figure 2. Average sustainable efficiencies of 3 regions in China from 2011 to2016.
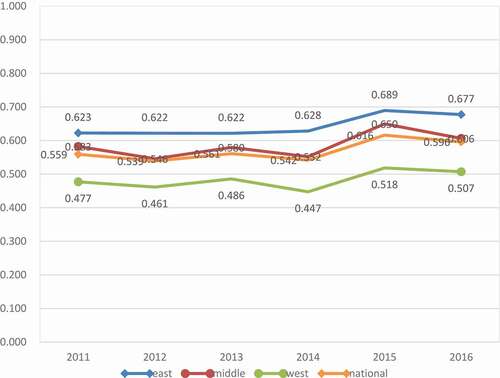
The six-year average efficiency of the construction industry in the eastern PARs is 0.643, larger than the average efficiency of the 30 PARs (0.569). The average PARs of middle China is 0.586, higher than the average. Western PARs are 0.483 on average, lower than the average. The average technical equipment rate in the East, the middle and the west is 15,427.39 yuan/person, 13,970.94 yuan/person and 12,994.20 yuan/person, respectively. The market index is 8.05, 6.26 and 4.93 yuan, respectively. The per capita GDP is 69,076.65 yuan/person, 37,964.10 yuan/person and 37,397.32 yuan/person.From the original data, it can be seen that the eastern region has better technology matching and better economic and market conditions. With the promotion of various aspects, the production efficiency of the construction industry is higher in the East and lower in the west, which is similar to the previous research results.
According to the principle of “three-stage virtual boundary data envelopment analysis”, this paper also discusses the improvement target of input and output. Based on the theme of sustainable efficiency of construction industry, this paper calculates the target potential of CO2 emission reduction under the assumption that input and desired output remain unchanged. In addition, the calculation method of the saving potential of input and the increasing potential of desired output is the same as the above method. The CO2 emission reduction potential is shown in . The result indicates that the CO2 emission reduction potential of most pars presents a downward trend, which shows that the energy utilization efficiency and CO2 emission reduction efficiency of each PAR are improved, and the energy utilization efficiency gap of each PAR is further reduced.
Table 9. The CO2 emission reduction potential of all PARs (104 tons)
shows the classification of CO2 emission reduction potential and sustainable efficiency in 30 PARs.
Figure 3. Categorizations of CO2emission reduction potential and sustainable efficiency of 30 PARs.
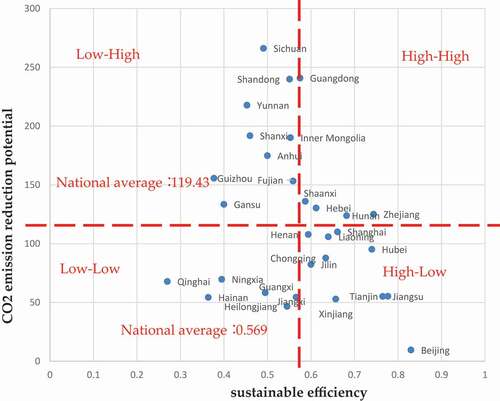
For the Low-High group, the PARs in this group with high CO2 emission potential and low sustainable efficiency. The number of PARs in this group is 9, accounting for a high proportion of the total, which indicates that the sustainable efficiency of China’s construction industry generally needs to be improved. These PARs need to improve the sustainable efficiency and CO2 emission reduction efficiency and strive to move to the High-Low group.
For the High-High group, PARs in this group with high CO2 emission reduction potential and high sustainable efficiency. Guangdong, Shaanxi, Hebei, Hunan and Zhejiang are in this group. An interesting phenomenon can be found in the figure, the CO2 emission reduction potential of Shaanxi, Hebei, Hunan and Zhejiang is slightly higher than the national average, which indicates that these PARs will move to the High-Low group relatively easily after strengthening the energy conservation and emission reduction management, which is an excellent phenomenon. The PARs in this group should focus on improving energy saving and emission reduction technologies, so as to reduce CO2 emissions while maintaining high efficiency.
The High-Low group is composed of the provinces with high sustainable efficiency and low CO2 emission reduction potential, the number of PARs in this group is the largest, and ten PARs have achieved low CO2 emissions while achieving efficient production, which shows that the sustainable development trend of China’s construction industry is generally good. Among them, there is a big gap between Beijing and other provinces, with the average efficiency of 0.83 as the highest and the potential of CO2 emission reduction of 95,500 tons as the lowest, which shows that Beijing, as the capital of China, has taken the lead on the road of sustainable development and played a leading role in other provinces.
For the Low-Low group, the PARs in this group has lower production efficiency and CO2 emission reduction potential than the national average level. The PARs in this group need to increase the capital and energy investment on the production efficiency of the construction industry and reduce the gap with PARs in the High-Low group as soon as possible.
In order to test the rationality of the three-stage virtual frontier SBM-DEA model, the calculation results are compared with those of SBM-DEA model, three-stage SBM-DEA model and virtual frontier SBM-DEA model. In this paper, Spearman correlation coefficient is used to investigate the relationship between the comprehensive efficiency and output of the construction industry. The average value of the efficiency value from 2011 to 2016 is defined as the comprehensive efficiency of the construction industry. The results are shown in .
Table 10. The comparison of the four methods
It can be seen from the results in that the Spearman correlation coefficient of the three-stage virtual frontier variable is the largest, indicating that the comprehensive efficiency calculated by the three-stage virtual frontier variable has the greatest correlation with the output, thus demonstrating the rationality of the model.
6. Conclusion
Based on the virtual frontier theory, this paper constructs a new three-stage virtual frontier SBM-DEA model and applies it to the efficiency evaluation of construction industry in 30 provinces of China from 2011 to 2016. The conclusions are as follows: (1) The average production efficiency of the construction industry in eastern, central and western China decreases successively, and the efficiency value in eastern and central China is higher than the national average, while the efficiency value in western China is opposite, which is consistent with the previous research results (Xue et al. Citation2008; Wang et al. Citation2013). (2) Through the analysis of environmental factors, it can be seen that the productivity of construction industry is positively correlated with per capita GDP and marketization index, while negatively correlated with environmental regulation index. If the degree of marketization and per capita GDP of a PAR are higher, the production efficiency of the construction industry is relatively high. Although the improvement of the intensity of environmental regulation can make the construction industry do better in energy conservation and emission reduction, it will reduce the production efficiency at the same time. (3) According to the analysis of original data and production efficiency, the production efficiency of construction industry is highly related to the equipment rate of technical efficiency. If the construction industry in a region has a high equipment rate of technical efficiency, the production efficiency is obviously high. (4) Through the calculation results of Spearman correlation coefficient, it can be seen that the correlation between output and production efficiency calculated by three-stage virtual frontier DEA is the largest, which verifies the rationality of the model. (5) According to the national average of CO2emission reduction potential and sustainability efficiency, 30 PARs are divided into four groups, each group has its own requirements for improving sustainable efficiency and reducing CO2 emissions.
According to the results, the author tries to put forward suggestions to improve the sustainable development efficiency of China’s construction industry: first, the production efficiency of the western region is far behind that of the eastern and central regions, and the construction industry in the western region needs to learn from the experience of the advanced regions to improve the production efficiency. Second, according to the previous analysis results, the technical equipment rate and production efficiency of the construction industry have a highly relevant positive impact. Regions with backward production efficiency should increase investment in technology to improve production efficiency rapidly. Third, each province should choose to develop and construct green building projects and develop green building-related industries to achieve the goal of economic development and environmental protection.
In the follow-up research, the following aspects can be further improved. (1) The three-stage virtual frontier model proposed in this paper needs to be further proved to be reasonable and applicable, so as to prove the assumption that the model follows the constant return on scale. (2) Since it is difficult to calculate other pollutants discharged in the production activities of the construction industry, the CO2 emission is the only undesired output index to evaluate the efficiency of the construction industry in this paper. If there is a method to conduct statistics or calculation on the emissions of other pollutants in the future, the evaluation result will be more accurate. (3) In future studies, the virtual frontier SBM-DEA model and other evaluation models can be used to comprehensively evaluate the research objects, so as to make the evaluation results more reasonable. In addition, I will try to apply the proposed model to other fields for research, and constantly solve the newly discovered problems about the model in the research.
Author contributions
Zhao Yang proposed the original concept and methods and finished the first draft. Hong Fang supervised the manuscript. Xiaoshan Xue collected the data.
Disclosure statement
The authors declare no conflict of interest.
Additional information
Funding
Notes on contributors
Zhao Yang
Zhao Yang, received bachelor's degree in management and master's degree in management from Xihua University and Qingdao University of technology in 2015 and 2018 respectively. He has been studying for a doctorate in management from school of economics and management of Beihang University since 2018. He has been engaged in research on economy and energy related to construction industry for a long time, and has published many related papers.
Hong Fang
Hong Fang, is a professor and doctoral supervisor of School of economics and management of Beihang University ,director of Applied Economics Department of Beihang University . She has been engaged in the teaching and research of economic management science for a long time, including economics, trade and environment, resources and environmental management, energy and environmental policy, risk assessment and management, etc. She has successively presided over more than 40 scientific research projects, including 4 National Natural Science Funds, 2 national social science funds, 3 Ministry of education projects, consulting projects of the Chinese Academy of engineering, National Science and technology research projects, and enterprises.
Xiaoshan Xue
Xiaoshan Xue, obtained his Bachelor of science and technology degree from Hefei University of technology in 2019. She has been studying for a master's degree in management from school of economics and management of Beihang University since 2019, and has been engaged in research on economy, energy and international trade for a long time.
References
- Andersen, P., and N. C. Petersen. 1993. “A Procedure for Ranking Efficient Units in Data Envelopment Analysis.” Management Science 39 (10): 1261–1294. doi:https://doi.org/10.1287/mnsc.39.10.1261.
- Avkiran, N. K. 1999. Productivity Analysis in the Services Sector with Data Envelopment Analysis. 1st ed. Camira, Queensland: NK Avkiran.
- Azadeh, A., M. S. Amalnick, S. F. Ghaderi, and S. M. Asadzadeh. 2007. “An Integrated DEA PCA Numerical Taxonomy Approach for Energy Efficiency Assessment and Consumption Optimization in Energy Intensive Manufacturing Sectors.” Energy Policy 35: 3792–3806. doi:https://doi.org/10.1016/j.enpol.2007.01.018.
- Bian, Y. W., and H. Xu. 2013. “DEA Ranking Method Based upon Virtual Envelopment Frontier and TOPSIS.” Systems Engineering - Theory & Practice 33 (2): 482–488.
- Brockett, P. L., A. Charnes, W. W. Cooper, Z. M. Huang, and D. B. Sun. 1997. “Data Transformations in DEA Cone Ratio Envelopment Approaches for Monitoring Bank Performances.” European journal of operational research 98: 250–268. doi:https://doi.org/10.1016/S0377-2217(97)83069-X.
- Charnes, A., W. W. Cooper, and E. Rhodes. 1978. “Measuring the Efficiency of Decision Making Units.” European journal of operational research 2 (6): 429–444. doi:https://doi.org/10.1016/0377-2217(78)90138-8.
- Chen, Y. 2005. “Measuring Super-efficiency in DEA in the Presence of Infeasibility.” European journal of operational research 161: 545–551. doi:https://doi.org/10.1016/j.ejor.2003.08.060.
- Chen, Y., and A. I. Ali. 2004. “DEA Malmquist Productivity Measure: New Insights with an Application to Computer Industry.” European journal of operational research 159: 239–249. doi:https://doi.org/10.1016/S0377-2217(03)00406-5.
- Chiu, Y. H., Y. C. Chen, and X. J. Bai. 2011. “Efficiency and Risk in Taiwan Banking: SBM super-DEA Estimation.” Applied economics 43 (5): 587–602. doi:https://doi.org/10.1080/00036840802599750.
- Coelli, T. J., and D. Rao. 2005. “Total Factor Productivity Growth in Agriculture: A Malmquist Index Analysis of 93 Countries, 1980-2000.” Agricultural Economics 32: 115–134. doi:https://doi.org/10.1111/j.0169-5150.2004.00018.x.
- Cui, Q., and Y. Li. 2014. “The Evaluation of Transportation Energy Efficiency: An Application of Three-stage Virtual Frontier DEA.” Transportation Research 29: 1–11.
- Cui, Q., and Y. Li. 2015. “An Empirical Study on the Influencing Factors of Transportation Carbon Efficiency: Evidences from Fifteen Countries.” Applied Energy 141: 209–217. doi:https://doi.org/10.1016/j.apenergy.2014.12.040.
- Cui, Q., Y. Li, C. L. Yu, and Y. M. Wei. 2016. “Evaluating Energy Efficiency for Airlines: An Application of Virtual Frontier Dynamic Slacks Based Measure.” Energy 113: 1231–1240. doi:https://doi.org/10.1016/j.energy.2016.07.141.
- Cui, Q., Y. Z. Wang, and Y. Li. 2015. “Evaluating Airline Efficiency: An application of Virtual Frontier Network SBM.” Transportation Research, Part E. Logistics and Transportation Review 81: 1–17. doi:https://doi.org/10.1016/j.tre.2015.06.006.
- Cullinane, K., T. F. Wang, D. W. Song, and P. Ji. 2006. “The Technical Efficiency of Container Ports: Comparing Data Envelopment Analysis and Stochastic Frontier Analysis.” Transportation Research Part A 40 (4): 354–374.
- Dennis, J. A., K. L. Ca, and S. Peter. 1977. “Formulation and Estimation of Stochastic Frontier Production Function Models.” Journal of Econometrics 6: 21–37. doi:https://doi.org/10.1016/0304-4076(77)90052-5.
- Evan, K., Doğan, and Tırtıroğlu. 1998. “Bank Efficiency in Croatia: A Stochastic-frontier Analysis.” Journal of comparative economics 26 (2): 282–300. doi:https://doi.org/10.1006/jcec.1998.1517.
- Feng, B., and X. Q. Wang. 2015. “Research on Carbon Decoupling Effect and Influence Factors of Provincial Construction Industry in China.” China Population,Resources and Environment 25 (4): 28–34.
- Fried, H. O., C. A. K. Lovell, S. S. Schmidt, and S. Yaisawarng. 2002. “Accounting for Environmental Effects and Statistical Noise in Data Envelopment Analysis.” Journal of Productivity Analysis 17 (1–2): 157–174. doi:https://doi.org/10.1023/A:1013548723393.
- Hjalmarsson, L., and A. Veiderpass. 1992. “Productivity in Swedish Electricity Retail Distribution.” The Scandinavian Journal of Economics 94: 193–205. doi:https://doi.org/10.2307/3440259.
- Hu, X., and C. Liu. 2015. “Managing Undesirable Outputs in the Australian Construction Industry Using Data Envelopment Analysis Models.” Cleaner Production 101: 148–157. doi:https://doi.org/10.1016/j.jclepro.2015.03.077.
- Hu, X., and C. Liu. 2016. “Profitability Performance Assessment in the Australian Construction Industry: A Global Relational Two-stage DEA Method.” Construction Management and Economics 34 (3): 147–159. doi:https://doi.org/10.1080/01446193.2016.1180415.
- Kapelko, M., M. HortaI, A. S. Camanho, and A. O. Lansink. 2015. “Measurement of Input-specific Productivity Growth with an Application to the Construction Industry in Spain and Portugal.” International Journal of Production Economics 166: 64–71. doi:https://doi.org/10.1016/j.ijpe.2015.03.030.
- Kapelko, M., A. O. Lansink, and S. E. Stefanou. 2014. “Assessing Dynamic Inefficiency of the Spanish Construction Sector Pre- and Post-financial Crisis.” European journal of operational research 237 (1): 349–357. doi:https://doi.org/10.1016/j.ejor.2014.01.047.
- Kulshreshtha, M., and J. K. Parikh. 2002. “Study of Efficiency and Productivity Growth in Opencast and Underground Coal Mining in India: A DEA Analysis.” Energy Economics 24: 439–453. doi:https://doi.org/10.1016/S0140-9883(02)00025-7.
- Meeusen, W., and C. V. D. Broeck. 1977. “Efficiency Estimation from Cobb–Douglas Production Functions with Composed Error.” International Economic Review 18: 435–444. doi:https://doi.org/10.2307/2525757.
- Mohamed, M., and Mostafa. 2009. “Modeling the Efficiency of Top Arab Banks: A DEA-Neural Network Approach.” Expert Systems with Application 36 (1): 309–320. doi:https://doi.org/10.1016/j.eswa.2007.09.001.
- Mukherjee, K., S. C. Ray, and S. M. Miller. 2001. “Productivity Growth in Large US Commercial Banks: The Initial Post-deregulation Experience.” Journal of Banking& Finance 25: 913–939. doi:https://doi.org/10.1016/S0378-4266(00)00103-5.
- Önüt, S., and S. Soner. 2007. “Analysis of Energy Use and Efficiency in Turkish Manufacturing Sector SMEs.” Energy Conversion and Management 48: 384–394. doi:https://doi.org/10.1016/j.enconman.2006.07.009.
- Resende, M. 2008. “Efficiency Measurement and Regulation in US Telecommunications: Arobustness Analysis.” International Journal of Production Economics 114 (1): 205–218. doi:https://doi.org/10.1016/j.ijpe.2008.01.007.
- Sarica, K., and I. Or. 2007. “Efficiency Assessment of Turkish Power Plants Using Data Envelopment Analysis.” Energy 32 (8): 1484–1499. doi:https://doi.org/10.1016/j.energy.2006.10.016.
- Shang, W. P. 2000. “Definition and Evaluation Index System of Sustainable Development.” China Economic Studies 01: 56–60.
- Shen, L. Y., X. N. Song, Y. Wu, S. J. Liao, and X. L. Zhang. 2016. “Interpretive Structural Modeling Based Factor Analysis on the Implementation of Emission Trading System in the Chinese Building Sector.” Journal of cleaner production 127: 214–227. doi:https://doi.org/10.1016/j.jclepro.2016.03.151.
- Sun, Q. X. 2016. “Energy Conservation and Emission Reduction Make Buildings More Environmentally Friendly.” China Awards for Science and Technology 8: 29–30.
- Tone, K. 2001. “A Slacks-Based Measure of Efficiency in Data Envelopment Analysis.” European journal of operational research 130: 498–509. doi:https://doi.org/10.1016/S0377-2217(99)00407-5.
- Tone, K. 2003. “Dealing with Undesirable Outputs in DEA: A Slacks-Based Measure(SBM) Approach.” Grips Research Report Series. Tokyo, 1-2003-0005.
- Tsolas, I. E. 2011. “Modelling Profitability and Effectiveness of Greek-listed Construction Firms: An Integrated DEA and Ratio Analysis.” Construction Management and Economics 29 (8): 795–807. doi:https://doi.org/10.1080/01446193.2011.610330.
- Wang, F. 2019. “Measurement and Analysis of Interprovincial Environmental Regulation Intensity China—Based on 2003~2016 Data.” Sustainable Development 9 (2): 260–269. doi:https://doi.org/10.12677/SD.2019.92033.
- Wang, X., Y. Chen, B. Liu, Y. Shen, and H. Sun. 2013. “A Total Factor Productivity Measure for the Construction Industry and Analysis of Its Spatial Difference: A Case Study in China.” Construction Management and Economics 31 (10): 1059–1071. doi:https://doi.org/10.1080/01446193.2013.826371.
- Wanke, P., and C. P. Barros. 2016. “Efficiency in Latin American Airlines: A Two-stage Approach Combining Virtual Frontier Dynamic DEA and Simplex Regression.” Journal of Air Transport Management 54: 93–103. doi:https://doi.org/10.1016/j.jairtraman.2016.04.001.
- Xue, M., and P. T. Harker. 2002. “Ranking DMUs with Infeasible Super-efficiency DEA Methods.” Management science 48 (5): 705–710. doi:https://doi.org/10.1287/mnsc.48.5.705.7805.
- Xue, X., Q. P. Shen, Y. Wang, and J. Lu. 2008. “Measuring the Productivity of the Construction Industry in China by Using DEA-based Malmquist Productivity Indices.” Journal of Construction Engineering and Management 134:1 (64): 64–71. doi:https://doi.org/10.1061/(ASCE)0733-9364(2008)134:1(64).
- Xue, X., H. Wu, X. Zhang, J. Dai, and C. Su. 2015. “Measuring Energy Consumption Efficiency of the Construction Industry: The case of China.” Journal of Cleaner Production 107: 509–515. doi:https://doi.org/10.1016/j.jclepro.2014.04.082.
- Yan, J., T. Zhao, T. Lin, and Y. Li. 2017. “Investigating Multi-regional Cross-industrial Linkage Based on Sustainability Assessment and Sensitivity Analysis: A Case of Construction Industry in China.” Journal of cleaner production 142: 2911–2924. doi:https://doi.org/10.1016/j.jclepro.2016.10.179.
- Zhu, J. 2001. “Super-efficiency and DEA Sensitivity Analysis.” European journal of operational research 129: 443–455. doi:https://doi.org/10.1016/S0377-2217(99)00433-6.