
 ?Mathematical formulae have been encoded as MathML and are displayed in this HTML version using MathJax in order to improve their display. Uncheck the box to turn MathJax off. This feature requires Javascript. Click on a formula to zoom.
ABSTRACT
Urban daylight significantly affects the physical and mental health of urban residents. Many previous studies focused on how outdoor daylight conditions affect indoor daylighting of buildings, whereas the design of outdoor daylighting conditions, which also exerted an equally significant part, was relatively overlooked. There are also few studies empirically explored the outdoor daylight in various forms of mature urban neighbourhoods. Through investigating the outdoor pedestrian daylight performances of 11 representative open urban neighbourhood units in inner-city Shenzhen, this study aims to identify the influence of urban design factors. Through field investigation, mapping and on-site measurement, this study explored and analysed the horizontal illuminance level and site illuminance uniformity of 84 outdoor spaces. As the results revealed, urban morphological characteristics significantly affected the daytime pedestrian illumination. Specifically, the high-density mid-rise urban villages and the urban park demonstrated the best daytime outdoor visual comfort conditions. The multivariate regression test demonstrated that sky view factor exerted the greatest influence on the daytime outdoor illumination, followed by the mean building height, ground surface albedo and vertical uniformity. Hence, urban morphological patterns have great potential in optimizing urban design for outdoor daylighting behaviours and energy use, which is of great reference value in setting specific standards to achieve the goals of the initiatives of “Healthy Cities.”
1. Introduction
1.1. Background
As for the liveability of urban neighbourhoods, daylighting, especially the natural light (daylight), is an essential factor. Functioned as the light source for colour rendering, daylight is also inseparably associated with visual response and production efficiency (Jin and Zhu Citation2001; Alrubaih et al. Citation2013; Boyce Citation2014). In addition to sterilization, the sunlight possesses a health protection effect on the atmosphere and urban surfaces (Tong and Lighthart Citation1997). The daylight patterns and solar availability in outdoor space affect the physical and mental health of urban residents to a certain extent from the aspects of mood, behaviour and outdoor activities (Yasushi Citation2006; Mead Citation2008; Durvasula et al. Citation2010; Wirz-Justice, Skene, and Münch Citation2020). With the development of modern technology, artificial lighting has become one of the major factors in the formation and aggravation of global warming events, as it accounts for a significant proportion of urban energy consumption and carbon emissions (Nicol, Wilson, and Chiancarella Citation2006; Alrubaih et al. Citation2013; Yun and Kim Citation2013).
In the critical period of urban transformation in recent years, China suffers many social and ecological issues in cities to be explored and solved, especially the dramatic increase in energy consumption and carbon emissions. In addition, in the recently promulgated “Healthy Cities” initiative, the “people-centred and environmentally friendly path” for urban (re)development in the following decade has been strongly emphasized and promoted (Taylor Citation2015; Yang and Shi Citation2017; Summerskill, Wang, and Horton Citation2018; Jiang, Ye, and Wang Citation2020), which stimulate people to nature in cities and form a healthier lifestyle, contributing to the sustainability of the urban ecosystem. Simultaneously, with the considerable construction of superblocks in the past decade, problems like traffic congestion, social segregation and inefficient use of urban space are emerging, urging the Chinese government to implement an open urban neighbourhood system (CPC Central Committee Citation2016). With Shenzhen as a representative case of China’s rapidly transforming cities, this paper tries to respond to these above issues. To form a sustainable urban (re)development model, it is of great significance to study the urban outdoor daylighting conditions. While it is commonplace to go out, experience nature, and exercise for minimizing energy use, it is more vital for the planet’s inhabitants.
1.2. Daylight climate of Shenzhen
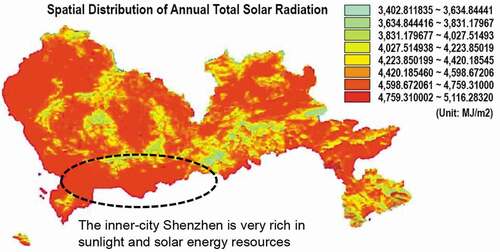
As China’s first special economic zone, Shenzhen is regarded as a “testing ground” for China’s Reform and Opening-up Policy and a representative case of urban research in China, attributing to its large number of variations and existing problems (Du Citation2020) which are similar to those of other rapidly-developing cities since the late 1970s. Located between East E113° 46ʹ ~ E114°37ʹ longitude, and N22° 27ʹ~ N22° 52ʹ latitude, Shenzhen lies on the east bank of the Pearl River, bordering the cities of Hong Kong, Dongguan and Huizhou. In a subtropical monsoon climate region, Shenzhen is featured with hot and humid summer and warm winter. Summer lasts for an extremely long time in Shenzhen, from mid-April to early November. The average annual daylight duration is as high as 1,837.6 hours. Among China’s Daylight Climate Zone (DCZ),Footnote1 Shenzhen belongs to Zone III, with the average annual total daylight illuminance amount of 35 ~ 40 klx (). The actual amount of solar radiation in Shenzhen was recorded to reach 4,759 ~ 5,116 MJ/mFootnote2 (). In the practice of urban architectural design, Shenzhen, with abundant daylight and solar energy resources, has great potential in urban environmental quality and energy conservation. For one thing, it is necessary to reduce or avoid excessive daylighting to establish an outdoor sunlight environment with visual comfort for urban residents. For another, sunlight and solar energy can be collected strategically to realize the vigorous development of green energy.
Figure 1. The map of daylight climate zones (DCZ) and the location of Shenzhen (source: MOHURD Citation2012; translated and redrawn by authors).
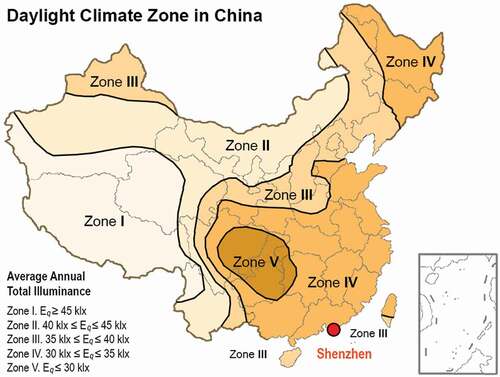
Figure 2. A map of Shenzhen’s annual total solar radiation (source: Shenzhen Climate Centre Citation2011; translated by authors).
1.3. Research purpose and objectives
Composed of multiple complex systems, cities contain diverse forms and socio-ecological components. Therefore, environmental assessment needs to be typologically oriented and consider as many variations of the urban morphological patterns as possible. Previous studies focused on how outdoor daylight conditions affect indoor daylighting of various building types, whereas the design of outdoor daylighting conditions, which also exerted an equally significant part, was relatively overlooked. With the development of research techniques, computer simulation technology has been extensively applied in the general model of simplified configurations of rectangular building volume. Few studies systematically explore the daylighting behaviours of urban outdoor space based on the actual complicated urban environment, due to its various morphological characteristics and physical components which are closely interacted with space users. Hence, it is critical to the strategic choice of the designer regarding the health and visual comfort of the outdoor environment.
By analysing the empirical data collected, this study attempts to explore the variations in outdoor daylight performance at the pedestrian level in open urban neighbourhoods with multiple forms in low and middle latitudes (such as Shenzhen). Data were obtained from 11 urban open neighbourhood units covering major urban morphological patterns in Shenzhen’s inner city. The main purposes of this paper are as follows:
To demonstrate the advantages and disadvantages of outdoor daylight environment of each type of urban neighbourhood unit (representing an urban morphological pattern);
To examine the influence of urban morphological characteristics on the daylighting conditions of outdoor pedestrians;
To identify some key urban design factors (UDFs) so that architects and urban designers can quickly employ and translate these factors in the design process of cities in low and middle latitudes for testing outdoor daylighting performance.
In addition, understanding the relationship between the urban morphological characteristics and the outdoor daylight environment can lay a solid foundation for the adjustment and (re)arrangement of the building layouts and spatial elements, as well as the updating and setting of specific standards for different urban neighbourhood types (Pan Citation2019). Furthermore, the balance between outdoor visual comfort and energy-saving daylighting is also conducive to the construction of a healthy city.
2. Literature review
Daylight has played a vital role in urban life since its establishment in the late nineteenth century, which aims to improve the well-being of urban residents in high-density and overcrowded cities. In the 1920s, many architectural and urban professionals advocated the sanitary and healthcare characteristics of daylight used in all types of urban buildings (Norton et al. Citation2017). After decades of development, daylight has become one of the main environmental dimensions in urban and architectural design. A series of daylighting indicators are adopted in the design of urban neighbourhood and building layouts, including daylight factor (DF), daylight autonomy (DA), daylight glare index (DGI), and relevant colour temperature (Tregenza and Wilson Citation2011; Galatioto and Beccali Citation2016; Ayoub Citation2019), which are also extensively applied to evaluate the living environment quality of buildings and urban outdoor spaces. To achieve the design and improvement of the outdoor daylight environment, visual and thermal comfort issues have been widely concerned, as they greatly affect the stay duration, behaviour, and physical and mental health of urban residents in the spaces (Lin Citation2009; Harvard Medical School Citation2010; Rosso et al. Citation2016; Cheung and Jim Citation2018; Wirz-Justice, Skene, and Münch Citation2020).
2.1. Studies of urban morphologies and daylighting
In the contemporary highly dense urban environment, the potential problems of insufficient daylighting, poor ventilation, and high energy consumption of artificial lighting make block buildings the focus of attention. Natural light has long been regarded as an important indicator of urban habitability and social well-being. Besides, urban morphology has a significant impact on indoor and outdoor daylighting behaviours and urban energy consumption (DeKay Citation2010; Montavon Citation2010; Sarralde et al. Citation2015; Zhang et al. Citation2019). Whether the outdoor illumination is too excessive or insufficient, it is not conducive to residents’ outdoor activities, indoor comfort, and work efficiency, thus exerting a negative impact on residents’ quality of life.
In the previous studies, the influence of urban morphology on urban daylighting has been highly concerned by both urban researchers and practitioners. Through on-site measurement and subjective survey, Ng et al. (Citation2003) studied the indoor daylight conditions in Hong Kong’s high-density and high-rise urban environment. According to the concepts of vertical daylighting factor and unobserved visual field area in Hong Kong, an urban design and regulation method was proposed to improve the indoor daylighting performance of buildings in high-density high-rise cities. He, Ding, and Lin (Citation2012) analysed daylight characteristics of the high-density urban centre of Chongqing. They summarized some urban and architectural design principles for solar access, including the layout and direction of buildings, the use of reflected light between buildings, the application of daylight conduits, and the use of high-reflectivity facade materials.
Through computer simulation, Cheng et al. (Citation2006) studied the relationship between three aspects of urban design, namely architectural form, building density, and solar energy potential. As the research results verified, horizontal and vertical random building layouts presented a better environmental performance in terms of pedestrian openness, daylight utilization of the building facade, and solar photovoltaic potential on the building envelope. Subsequently, they concluded that urban blocks with higher buildings, lower building coverage ratio and more open outdoor spaces were more favorable. By means of computer simulation, Leder et al. (Citation2006) further studied the effect of plot ratio on sunlight utilization. Based on experimental data, it is suggested that the percentage of visible sky, daylighting duration and outdoor illuminance level should be used as three key factors for urban daylight design and urban planning legislation. In addition, Saratsis, Dogan, and Reinhart (Citation2017) developed a daylighting analysis procedure for urban design practitioners based on the evaluation and analysis of the outdoor daylighting performances of 50 block types in New York City. The simulation analysis indicated that some urban massing approaches were superior to conventional massing strategies. The urban massing approach, which makes full use of the solar track and the local urban contexts, can enhance the daylight access of the massing itself as well as its adjacent buildings.
In terms of solar power and energy consumption of urban street canyons and the surrounding buildings, Strømann-Andersen and Sattrup (Citation2011) quantified the relationship between urban density and passive solar energy acquisition and consumption of buildings by computational simulation. According to the experimental results, it could be found that the geometry of urban canyons significantly affected total energy consumption, with the impact of energy consumption of office buildings exceeding +30% and residential buildings exceeding +19%. As a major component of the daylight available on the lowest floors of high-density compact forms of residential and office buildings in urban areas, the reflected light greatly influences building energy consumption. Therefore, the issue of daylight caused by radiation distribution patterns in urban canyons should be considered in the process of urban design. After investigating the effects of street width, street canyon axis, building envelope, and roof shape on solar access to the urban spaces, van Esch, Looman, and de Bruin-hordijk (Citation2012) proposed that these urban and architectural design factors significantly affected the global total radiation of urban canyons and the heating efficiency of residential buildings with passive solar energy.
2.2. Implemented standards for outdoor lighting design in China
There are two main lighting design standards: interior design standards and exterior design standards. Published by the International Commission on Illumination (CIE) in 1992 and 2000, the Guide to the Lighting of Urban Areas has been widely adopted by most countries, which not only provides the minimum requirements for the lighting in different types of outdoor areas with different pedestrian flows, but also proposes three fundamental parameters for the assessment of outdoor lighting design, namely the minimum horizontal illuminance level (EHmin), the horizontal illuminance level (EHave), and the minimum semi-cylindrical illuminance (ESCmin).2 In China, there are two major currently adopted national interior lighting design standards, namely, the Standard for lighting design of buildings (GB 50034–2013) (for artificial lighting design) and the Standard for daylighting design of buildings (GB/T 50033–2013) (for natural lighting design). In addition to meeting minimum daylighting requirements for multiple interior spaces, these standards provide principles and strategies for improving indoor daylight quality, such as applying window reflectors and roof light guides to enhance indoor illuminance level and controlling the ratio of window area to wall area. Regarding the outdoor daylighting design, the Standard for urban residential area planning and design (GB50180-2018) (for natural lighting design) is the widely implemented national design standard in China. This standard provides some practical concepts and principles, in particular, the Sunlight Space (Rizhao Jianju) and Sunlight Space Factor,Footnote3 to control the number of daylighting hours on the ground between buildings to satisfy the visual comfort requirements for living, learning, and working on all floors of the building during the day.
Meanwhile, lighting design has been recognised as a key aspect in the guidance and evaluation system for most green buildings and sustainable neighbourhoods, which is beneficial to the health of the human body, the enhancement of comfort level, the reduction of energy consumption and the improvement of production efficiency. The Assessment Standard for Green Building (GBL) (GB/T 53078–2019) and the Leadership in Energy and Environmental Design Green Building Rating System (LEED) are two major evaluation systems currently implemented in China (Ye et al. Citation2013). Specifically, the GBL system emphasizes the necessity of achieving “green” standards (graded four points) by controlling outdoor light pollution and indoor lighting energy consumption (MOHURD Citation2019). Besides, the system outlines a few specific principles for achieving “green” standards. For example, outdoor reflective glass walls in urban canyons should be controlled beyond 0.20. Lighting design should give priority to making full use of natural daylighting. It is necessary to apply adjustable shading devices to control glare and then eliminate negative effects on productivity and social well-being. With respect to LEED v4 (for neighbourhood development), lighting is also considered to be one of the important indexes of energy saving in buildings and improving the quality of life in neighbourhoods. Various types of buildings’ internal illuminance levels, building components (roof, walls, floors, floors, doors, and continuous air barriers), external lighting conditions, and the selection and control of equipment are advocated to be taken into full consideration (LEED Citation2018).
2.3. Knowledge gaps and the absence of specific design standard
In the contemporary urban era, numerous researchers have demonstrated the importance of daylight design for the establishment of “healthy cities” and the improvement of urban social well-being. Existing research on urban daylighting tends to focus on building energy consumption and indoor daylighting availability on a building scale, as well as the influence of outdoor daylight conditions on indoor daylighting of various building types (Galatioto and Beccali Citation2016; Nasrollahi and Shokri Citation2016; Ayoub Citation2019; Asl and Safari Citation2020; Bellia et al. Citation2020; Turan et al. Citation2020; Wang, Wei, and Ruan Citation2020). Computer simulation techniques such as Ecotect, Desktop Radiance, AGi32, Daysim, and immersive virtual environment techniques are also widely applied, including urban block layout model or rectangular building volume simplified configuration. Nevertheless, few scholars have systematically studied the daylighting behaviour of neighbourhood-scale outdoor space based on the actual data set in real urban contexts with different morphological characteristics and spatial components. Particularly, there are many forms of urban neighbourhoods in the city, while few studies investigated the outdoor daylight environment in different neighbourhood types within the neighbourhood scope. Influenced by the path and angle of the sunlight in different periods and urban morphological characteristics, these urban neighbourhoods present different sunlight and solar radiation performances.
On the other hand, the design standards of urban daylighting in current China are mainly aimed at indoor and night-time conditions, lacking the improvement of the outdoor environment, especially the impact of spatial layout and arrangement on the visual comfort and outdoor activities of urban residents during the day. In other words, the adopted standards and assessment systems lack specific projects and standards for urban design to improve outdoor daylight. To complement the limitations of past studies and existing urban design standards, it is necessary to better understand some fundamental issues: 1) What are the advantages and disadvantages of daylighting environments in various urban blocks? What are the most critical urban form descriptors (urban design factors) that influence daylighting behaviours? 2) Besides the lack of adequate light in some high-density areas (such as the high-density and mid-rise urban villages in China), excessive direct sunlight in the outdoor space is also a key issue that needs to be solved, which is closely associated with visual and thermal comfort, as well as public health. Moreover, the Shenzhen municipal government has promulgated many policies on urban renewal since the 1980s. However, outdoor daylighting is rarely considered. This study argues that urban morphology can significantly affect outdoor daylighting performance, and the health and well-being of urban residents, thus offering some references for future urban renewal policy formulation.
3. Methodology
3.1. Urban morphological patterns and environmental components
Featured with relatively flat terrain, the inner city of Shenzhen is chosen as the research area for investigating the influence of urban morphology characteristics on outdoor daylighting performance. Composed of multiple complex systems, Shenzhen contains various physical, social and environmental elements (Stewart and Oke Citation2012; Douglas and James Citation2015; Pan Citation2019; Du Citation2020). Cities are constituted by multiple elements with several layers, including humans and activities, street and road grid networks, land division and land use distribution, infrastructure, building entities, and public space void (Lynch Citation1981; Salat Citation2011). The classification of urban morphological patterns in this study includes the horizontal arrangement of urban components and the diversity of their vertical forms:
Multiple components of the city: buildings, vegetation, land cover types (pavement materials, soil, water, etc.), environmental elements (air/atmosphere, light, solar radiation, heat, etc.);
Horizontal arrangement of the urban components: density, compactness, building layout (randomness, uniformity, street canyon axis), vegetation distribution and coverage (trees, shrubs and lawns);
Vertical forms of the urban components: building height, spatial geometry (openness and canyon aspect ratio), porosity, and adjacency;
Environmental consequences: air temperature, humidity, thermal comfort, wind speed, daylighting, lighting behaviour, solar exposure, etc.
3.2. Examined variables
This study focused on the effect of neighbourhood morphological characteristics (described by a set of 2D and 3D urban design factors) on daylighting indicators (i.e. horizontal illuminance level and site illuminance uniformity). These two indicators which are easily grasped by architects and urban designers can be quickly translated into effective design strategies.
3.2.1. Daylighting parameters
Horizontal illuminance level (HIL)
Illuminance level (E) refers to the luminous flux per unit area of visible light (lumens, symbol: lm)Footnote4 (EquationEq. 1(1)
(1) ), which represents the intensity of illumination on a given surface and is denoted by lux (symbol: lx). 1 lx is equal to 1 lumen per square meter (l lx = 1 lm/m2) (Fotios Citation2017). When a given surface is illuminated by multiple light sources simultaneously, the total illuminance of the surface means the sum of the illuminance generated by each light source. The horizontal illuminance level (HIL) of the site surface determines the adaptation of the eyes in the field of vision and serves as a visual background to highlight the target object. At present, HIL is a widely used lighting parameter in indoor and outdoor daylighting environment design (CIE Citation2000).
Where: dɸ is the luminous flux (lm); dS is the unit area (m2).
Site illuminance uniformity (SUo)
Illuminance uniformity (Uo) is the ratio of the minimum illuminance to the average illuminance on a given surface. The higher the Uo is, the more uniform the light will be (Alrubaih et al. Citation2013). Uo is a critical parameter to be applied to measure indoor space lighting mode and outdoor lighting uniformity at night. At present, the parameter of Uo has not been included in China’s national standard for outdoor daylighting design in urban residential areas. In Japan, the evaluation threshold of outdoor lighting uniformity in urban residential areas is 0.20 Uo (JCIE Citation1985). Based on the concept of Uo, this study developed a similar parameter, namely site illuminance uniformity (SUo), to test whether outdoor daylighting patterns are diverse, uniform, and stable in a given urban area within a given period of time. SUo is defined as the ratio of the minimum horizontal illuminance level (HILmin) to the average horizontal illuminance level (HILave) of all measured outdoor spaces within the site (EquationEq. 2)(2)
(2) . The value of SUo (0–1) is close to 1, and the outdoor horizontal illuminance level in the study area will be more uniform and stable.
3.2.2. Urban design factors
Urban design factors (UDFs) affecting the outdoor lighting and solar energy harvesting are selected, and extensive discussions are conducted in existing studies to analyse and investigate the influence of urban morphological characteristics on solar energy and outdoor daylighting (Yannas Citation2001; Cheng et al. Citation2006; Yang, Lau, and Qian Citation2011; Martins, Adolphe, and Bastos Citation2014; Rode et al. Citation2014; Sarralde et al. Citation2015; Nasrollahi and Shokri Citation2016; Alavipanah, et al. Citation2018; Chatzipoulka et al. Citation2018). Covering the major aspects of urban and architectural design, these investigated UDFs have been effectively utilized in pre-design and post-occupancy evaluation. The investigated UDFs include urban density factor (BCR, FAR, MNN), urban geometric factors (MBH, DOS, H/W, SVF, CAO), site factors (TSF, DSF, ISF), greenery factor (TCR), and ground surface material factor (GSA). All the selected UDFs are divided into site-level factors and point-level factors. The definition and calculation methods are elaborated in .
Table 1. Descriptions of examined urban design factors (UDFs) in this research (source: reviewed and summarised by authors)
3.3. Site selection
The criteria for identifying sample sites and spaces for measurement are as follows.
Open urban neighbourhood units located in the urban centre of Shenzhen, excluding gated communities and recently built urban blocks with extremely low occupancy rate;
All sample sites should represent the diversity of the prevailing urban features of the city, including socio-cultural characteristics, morphological patterns, scale, years of construction, location and the surrounding environment;
Space selection for each site should consider the availability of measurement permission to avoid the spaces with multiple people passing by. In principle, the selected space should be the residents’ favourite outdoor activities, with various geometric features.
The distance between each monitoring point and the geometric centre of the measured space should be as close as possible, reflecting the main ground surface cover and canopy characteristics of the tested space (Yang, Citation2009).
Eleven sites in Shenzhen’s Luohu and Futian districts (the city’s old and new urban centres) were selected for investigation and comparison based on field surveys and mapping (). They were built over a wide span of time, from the late Qing Dynasty to the present day, with various socio-cultural and morphological characteristics (see for more information on these 11 sites). Some representative outdoor spaces, where most people would gather at the site on a typical summer day, are selected for measurement. Eventually, a total of 84 outdoor spaces were selected for measurement ( and ).
Figure 3. Locations (up: the red dots) and satellite aerial views (down: yellow circles) of the 11 tested sites in the inner-city Shenzhen (source: up image: Shenzhen Municipal Planning and Natural Research Bureau, Shenzhen Master Plan 2010-2020, reproduced and re-interpreted by authors; down image: Baidu Satellite Map in 2017, and drawn by authors).
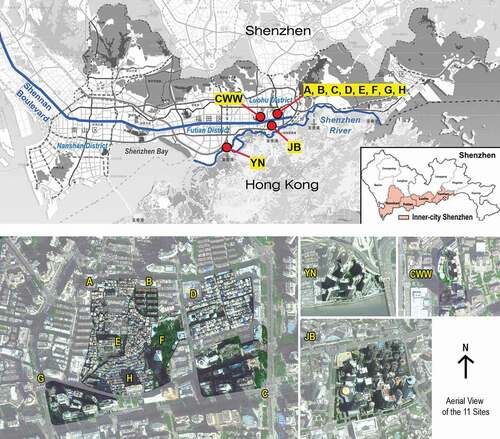
Figure 4. Morphological patterns, monitoring points, and representative sky view images of the 11 sites located in inner-city Shenzhen (source: drawn and photographed by authors).
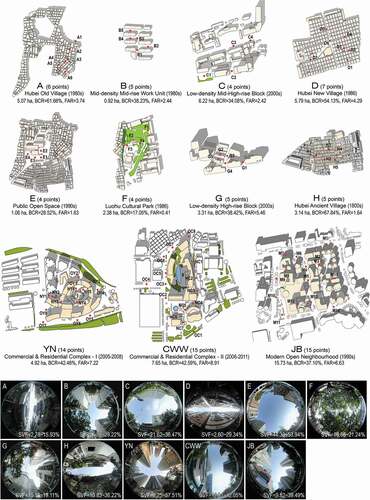
Figure 5. Comparison of the 11 sample sites’ morphological characteristics. Urban density factors: (a) (b) (c); Urban geometry factors: (d) (e) (f) (g); Site factors: (h) (i) (j); Greenery factor: (k); Ground surface material factor: (l) (surveyed and drawn by authors). Notes: 1) Here, TCR means the tree coverage ratios at the ground level, while the trees planted on the roofs were not taken into account for the investigation of performances of daylight and solar radiation at the pedestrian level in this research. 2) Each site’s GSA was weighted average value and calculated based on the ratios of different land cover types (except for the buildings) and ground surface materials within the site, not the average value of the tested spaces in each site.
Table 2. Plot size, morphological characteristics, and building information of the selected 11 sites (surveyed by authors)
3.4. Measurement protocol
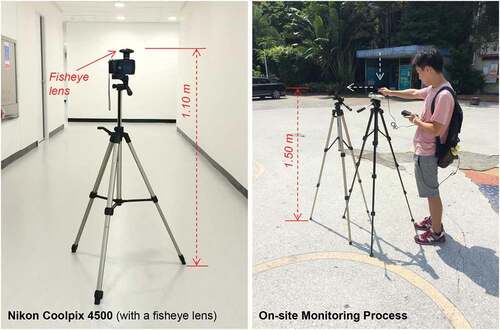
In the field survey, the sky view images (SVI) were taken at the geometric centre of each test space at a height of 1.1 meters with the Nikon Coolpix 4500 digital camera with a fish-eye lens (ISO 7726 Citation1998; Middel, Lukasczyk, and Maciejewski Citation2017). All the input SVIs are set on the upper north side in WinSCANOPY-2016a system to analyse the solar path and calculate the values of SVF, TSF, DSF and ISF. Horizontal illuminance level (HIL) is recorded by digital illuminometer TES-1332A (). It should be noted that the accuracy and resolution of the applied instruments should follow the requirements of the Measurement Methods for Lighting (GB/T 5700–2008). The instrument must be calibrated before the formal measurement, and the data shall not be recorded until the reading of the digital illuminometer is stable.
Table 3. Data collection instruments and analytical tools in this research (made by authors)
All measurements were taken between 9:00 am and 18:00 pm (covering morning, early afternoon, and late afternoonFootnote5) on 2 October 2017 solstice on 11 October 2017 at pedestrian level (around 1.5 m high, see ) and under clear sky conditions (sunny or partly cloudy, with similar background weather conditions. For more information on background sky conditions under daily monitoring conditions, refer to Appendix).Footnote6 In addition to environmental measurements, the behaviours of the occupants were observed and recorded, including population statistics, behavioural maps, photography, descriptive notes and narratives. The study observed hourly differences between the test sites and the spaces within each site. Due to the limitations in equipment and manpower, the mobile measurement method was adopted in this study (Yow Citation2007; Yang, Lau, and Qian Citation2011; Drach, Krüger, and Emmanuel Citation2018). The duration of each round’s measurement should be limited to less than 1 h to minimize the time variations.
Figure 6. Processes of monitoring the outdoor daylight parameters on site (source: photographed by authors).
4. Results and analysis
4.1. Daylight patterns – trend analysis
4.1.1. Daytime horizontal illuminance level
Most test spaces in the 11 sites showed strong outdoor daylight between morning and early afternoon (10:00 am-16:00 pm). The horizontal illuminance level (HIL) peak at the 11 sites mostly appeared between 11:00 am and 14:00 pm (except for Site F), then began a sharp decline in the late afternoon and reached a low point between 17:00 pm and 18:00 pm. Notably, the HIL waves of the 11 test sites presented significant fluctuations in the morning (9:00 am-12:00 pm). Due to the rotation of the earth, the angle of solar radiation increases, resulting in more frequent variations in cloud cover and atmospheric turbidity ().Footnote7
Figure 7. Hourly changes of daytime average horizontal illuminance level of the 11 sites.7
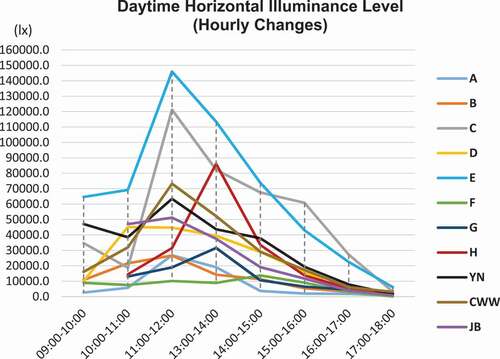
Of the 11 test sites, the daytime average HIL (D-HIL) of open space Site E was the highest (67,330 lx), followed by low density mid- to high-rise site C (51,981 lx) and site YN (32,425 lx). Sites D, H, CWW and JB have similar daylight illumination performance, with an average D-HIL of 23,512 to 28,633 lx. The lowest D-HIL of sites A, B, F, H, and G is between 7,683 and 12,473 lx, accounting for 1/7 to 1/5 of the illumination in Site E. Obviously, sites E and C showed a much larger HIL range in their daytime test spaces than the other nine sites. According to the gradient of D-HIL, the 11 test sites can be divided into three groups, which are “high D-HIL” (sites C, E and YN: D-HIL ≥ 30,000 lx), “moderate D-HIL” (sites D, H, CWW and JB: 20,000 ≤ D-HIL <30,000 lx), and “low D-HIL” (sites A, B, F and G: D-HIL < 20,000 lx) ().
Figure 8. Peak hours horizontal illuminance level (11:00 am-16:00 pm average) and daytime average illuminance level (D-HIL) of the 11 sites.
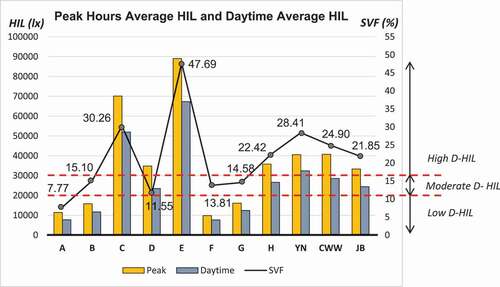
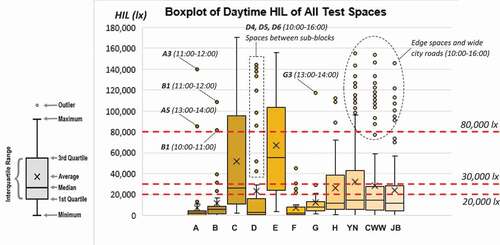
Compared with the sunlight exposure during peak hours (10:00 am-16:00 pm), the HIL of sites E and C was the highest, with the peak hours average HIL reaching 70,147 lx and 89,075 lx, respectively. The measuring spaces of these two sites ranged from 18,825 to 145,925 lx, and the major differences were shown between the monitoring spaces during peak hours. In comparison, the range of peak hours average HIL in sites H, YN, CWW and JB was 33,335 ~ 40,762 lx, significantly lower than sites E and C. Also, sites A, B, F, and G had the lowest HIL in peak hours, and the average HIL range was only 9,871 ~ 16,152 lx. It is worthy noted that the observed peak illuminance level of sites E and C was about seven to eight times as much as that of sites A, B, F and G. In addition, the average peak hours HIL at some monitoring spaces in sites E and C even exhibited 22 times the number of that in sites A, B, F, and G (site-level average). Within the same site (point level), large differences in hourly average HIL during peak hours could also be observed in this study, such as for sites A and D (Peak-HILA1 = 13,690 lx at 10:00 am-11:00 am, Peak-HILA4 = 419 lx at 11:00 am-12:00 pm; Peak-HILD2 = 2,580 lx at 14:00 pm-15:00 pm, Peak-HILD6 = 141,100 lx at 11:00 am-12:00 pm) ().
Figure 9. Boxplot of daytime horizontal illuminance level of all tested points in the 11 sites.
4.1.2. Daytime site illuminance uniformity
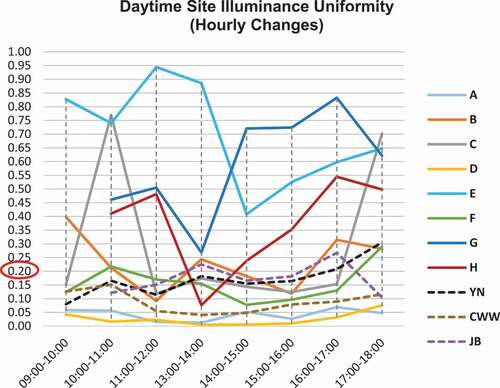
In terms of the daytime site illuminance uniformity (D-SUo), sites E, G and H possessed better illuminance uniformity than other test sites, and the range of hourly average SUo was 0.24 ~ 0.94. Site E showed the best D-SUo, with a D-SUo value of over 0.70, which was attributed to the uniform spatial geometry. In contrast, sites A and D had the lowest D-SUo, with values below 0.05. Significant differences in hourly average SUo were also observed at each site. The hourly average SUo values of 11 sites in the morning (before 11:00 am) and late afternoon (after 17:00 pm) were higher than those in the late morning (11:00 am-12:00 pm) and early afternoon (13:00 pm-16:00 pm) (). This shows the main effect of intense solar radiation, as the sun appears at a high angle in the late morning and early afternoon. When the sun angle is at its peak or high level, the difference in pedestrian daylighting between exposed areas and shaded spaces is the greatest. Similarly, the prominent hourly SUo fluctuations at sites E, G, and H were mainly due to the occasional increase in sky cloud cover that briefly obscured the sun during field measurements, resulting in a brief loss of sunlight. Although this situation cannot be avoided in empirical studies, this research monitored the hourly average value of HIL at multiple spaces within each site, so the results do not indicate unreasonable fluctuations in this study.
Figure 10. Hourly changes of site illuminance uniformity (SUo) of the 11 sites during the daytime (the minimum requirement of Uo in Japan is 0.20).
4.2. Correlation analysis
This section analyses the effects of different UDFs on outdoor daylighting and solar irradiation performance. Specifically, the analysed environmental parameters included daytime average illuminance level (D-HIL), morning average illuminance level (M-HIL), early afternoon average illuminance level (EA-HIL), late afternoon average illuminance level (LA-HIL) and daytime average site illuminance uniformity (D-SUo). The data were analysed via Microsoft Excel 2016 and IBM SPSS 20.0 statistical software. The determination coefficient (R2) is employed to measure how well the UDFs interpret the environmental parameters. In addition, the significance of their linear correlation was studied (P < 0.05 meant statistically significant) (Fang, Xu, and Chen Citation2017).
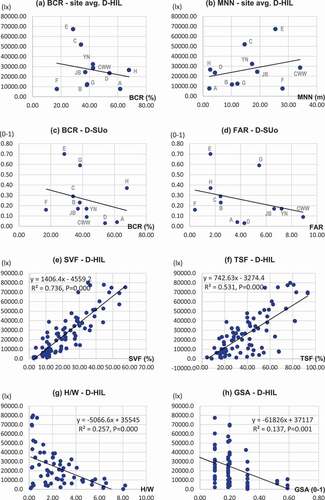
According to Pearson’s correlation test, most site-level UDFs showed no significant correlation with the detected environmental parameters (except D-SUo). In contrast, point-level UDFs presented a more significant correlation with these environmental parameters. BCR was negatively correlated with LA-HIL (r = −0.246, P = 0.024 < 0.05, 2-tailed). However, it was observed that most site-level UDFs (except MNN) were related to D-SUo (|r| = 0.280 ~ 0.397, P < 0.01 level, 2-tailed). In these site-level UDFs, BCR, FAR, MBH, and DOS were negatively correlated with D-SUo at low to medium levels (). Among these point-level UDFs, the positive correlation between SVF and D-HIL was the strongest (r = 0.858, P = 0.000 < 0.001, 2-tailed), followed by TSF, DSF, and ISF (; ). In contrast, H/W and GSA were negatively correlated with D-HIL, with the coefficients of −0.507 (P = 0.000 < 0.001, 2-tailed) and −0.370 (P = 0.001 < 0.01, 2-tailed) respectively (). GSA, SVF, and TSF were also critical point-level UDFs positively influencing D-SUo (r = 0.355, P = 0.001, 2-tailed; r = 0.307, P = 0.004 < 0.01, 2-tailed; r = 0.385, P = 0.000, 2-tailed) ().
Table 4. Pearson’s correlation between UDFs and examined environmental parameters
Table 5. Pearson correlation test among the 12 UDFs (except for the canyon axis orientation CAO)
Figure 11. Scatter plots for Site-level UDFs and Point-level UDFs against the daytime average horizontal illuminance level (D-HIL) and the daytime site illuminance uniformity (D-SUo): a) between BCR and site avg. D-HIL, (b) between MNN and site avg. D-HIL, (c) between BCR and D-SUo; (d) between FAR and D-Suo, (e) between SVF and D-HIL; (f) between TSF and D-HIL; (g) between H/W and D-HIL, and (h) between GSA and D-HIL.
4.3. Multivariable linear regression analysis
As Pearson’s correlation analysis revealed, different UDFs could lead to different effects on outdoor daylight patterns and sunlight exposure. Nevertheless, each aspect of the UDFs refers to each dimension of urban and architectural design, which exerts a comprehensive influence on environmental performance through mutual influence. Consequently, it is difficult to interpret and evaluate the environmental parameters for each check with a single UDF. Therefore, multivariate regression analysis should be performed to test the combined effects of the studied UDFs. Before the multivariate linear regression analysis, the correlation analysis between the UDFs was implemented to test whether multicollinearity issues between UDFs existed, such as FAR and MBH (r = 0.929, P = 0.000 < 0.001, 2-tailed), and DSF and ISF (r = 0.812, P = 0.000 < 0.001, 2-tailed) (). Thus, the stepwise method was adopted in the process of multivariate regression analysis. Besides, UDFs with high collinearity could not exist in the same regression model simultaneously (Fang, Xu, and Chen Citation2017). By neglecting UDFs of insignificant degree, the most critical UDFs were employed to demonstrate the effects of the examined environmental parameters (adjust R2 reaching 0.446 ~ 0.716), with significant explanatory power.
Table 6. Summary of the multivariable linear regression models of the examined environmental parameters
According to the regression results, some selected UDFs exerted a considerable influence on outdoor daylighting patterns. In these selected UDFs, SVF showed a broad interpretation of daylighting performance, followed by MBH and GSA (). Equation (6-a) indicated that D-HIL significantly positively correlated with SVF. Every 10% increase in SVF could lead to a substantial increase in D-HIL, accounting for 71.6% of the explained variation rate (F = 164.915, P < 0.05 level, 2-tailed) (). In the late afternoon, the effect of SVF decreased slightly but still played a dominant role, while MBH had adverse effects on outdoor HIL (LA-HIL). According to Equation (6-d), when the SVF value increased by 10%, LA-HIL increased by 3,403 lx, and when the MBH value increased by 1 m, it decreased by 23 lx. SVF and MBH could account for 59.6% LA-HIL variation (F = 49.008, P < 0.0001 level, 2-tailed) (). As multiple regression analysis revealed, the daylighting uniformity of outdoor sites could be determined by multiple UDFs, such as urban density factors, urban geometry factors, greening factors, and ground material factors. Equation (6-e) displayed that SVF and GSA exerted positive effects on D-SUo, while DOS had negative effects on D-SUo. If SVF increased by 10% and GSA increased by 0.1, D-SUo could be expected to increase by 0.1 and 0.05, respectively. Conversely, every 10-m reduction in DOS would increase the D-SUo by 0.004 (adjust R2 = 0.446, F = 18.452, P < 0.05 level, 2-tailed) ().
Table 6a. Regression analysis for average D-HIL of the 11 tested sites
Table 6b. Regression analysis for average M-HIL of the 11 tested sites
Table 6c. Regression analysis for average EA-HIL of the 11 tested sites
Table 6d. Regression analysis for average LA-HIL of the 11 tested sites
Table 6e. Regression analysis for D-SUo of the 11 tested sites
5. Discussion
5.1. Influence of urban morphologies on outdoor daylighting
This study indicated that urban neighbourhoods with higher SVF but lower H/W and GSA (sites C, E, YN, CWW and JB) were likely to achieve higher daytime average HIL (D-HIL) and daytime site illuminance uniformity (D-SUo), and vice versa (). In most of the spaces at sites C, E, YN, CWW and JB, one of the prominent problems with the daylighting environment was the constant excessive sun exposure and outdoor daylight glare (HIL≥20,000 lx) in the morning and afternoon, which could easily cause the shaded area in the canyon to remain at a very low level, due to the higher spatial openness and the height of the sun. The outdoor D-HIL at these five sites was mostly over 30,000 lx with the peak value of HIL reaching over 150,000 lx in some test spaces (e.g. the spaces of C1, E1~ E4, and OY6). Noticeably, the previous studies have concluded that higher BCR, lower MNN, and deeper canyons (high H/W) consistently produced significant shading effects, while street canyons with the N-S axis generally received higher shading effects than those with the E-W axis (Strømann-Andersen and Sattrup Citation2011; van Esch, Looman, and de Bruin-hordijk Citation2012; Martins, Adolphe, and Bastos Citation2014; Chatzipoulka, Compagnon, and Nikolopoulou Citation2016). In addition, this study revealed that SVF was more effective than H/W and street canyon orientation in estimating outdoor illuminance level and solar admittance capacity in a subtropical urban context. Since both outdoor illuminance level and solar admittance were affected by multiple shielding elements in the real urban environment, including vegetation, surrounding buildings, as well as building elements (e.g. roof shape, visor, billboards and street lamp), SVF calculation could more accurately describe the spatial heterogeneity of cities (Middel et al. Citation2018; Chatzipoulka et al. Citation2018).
Meanwhile, through reflecting the original excessive sunlight into the surrounding buildings and the sky, the rise of GSA is conducive to significantly reducing pedestrian horizontal illuminance level. Subsequently, with the increase of D-SUo throughout the site, the local glare at the pedestrian level in the canyon was alleviated, while the illuminance level of the surrounding building facade became greater (Miguet and Groleau Citation2002; Martins, Adolphe, and Bastos Citation2014). Urban renewal potential was enhanced by the use of ground materials with specific textures to guide or control the direction of light reflections (Miguet and Groleau Citation2002; Del Carpio et al. Citation2016), so as to maintain visually comfortable outdoor daylighting at the pedestrian level and improve indoor daylighting in a dense, compact but un-uniform urban environment (). However, compared with the incremental effect of SVF, the mitigation effect of GSA on D-HIL is negligible ( and Tables 7). In the meantime, although high albedo of the ground surface could reduce daytime air temperature and pedestrian horizontal glare, the nuisance to pedestrians from radiation increased, resulting in a hotter thermal sensation (Taleghani Citation2018).
Figure 12. Different types of light reflection changed by the ground surfaces (source: Miguet and Groleau Citation2002, redrawn by authors).
Notably, low-density large-scale urban morphological patterns (such as sites C, YN, CWW and JB) were more frequently exposed to strong sunlight during the day, resulting in visual discomfort of the outdoor space, which required a variety of strategies to create outdoor shading spaces, such as tree planting and architectural shading (). In contrast, sites A and D of high-density mid- to high-rise buildings, and Site F of high vegetation coverage, presented very low D-HIL due to their low spatial openness (. In this morphological feature, outdoor illuminance level can remain below 10,000 lx (mostly exhibited 1,500 ~ 6,000 lx) during the peak hours (10:00 am-16:00 pm). The D-HIL at these three sites was relatively low, mainly because of the mutual shading effect generated by the dense cluster of buildings (sites A and D) and the dense tree canopy (Site F). These conditions were effective in blocking and absorbing direct sunlight, thus reducing the amount of reflected light by the ground surface and creating a bright light environment in strong sunlight (Papadakis, Tsamis, and Kyritsis Citation2001; Kotzen Citation2003; Glicksman and Lin Citation2006; Tregenza and Wilson Citation2011; Mohajeri et al. Citation2016; Alavipanah, et al. Citation2018). However, the daylight uniformity of site A and Site D was extremely low, and there were temporal and spatial variations during the measurement. Some of the spaces in Site A showed a high density but random building layout (the canyon axis direction and the building height are random). When the sun reached a certain height, a strong solar beam could be received through the gaps or loopholes between the buildings with heterogeneous layouts (sunlight penetration) ( and ). Hence, these areas exhibited high brightness and solar potentials at certain times of the day (Cheng et al. Citation2006; Chatzipoulka, Compagnon, and Nikolopoulou Citation2016), such as spaces A3 and A5. The A3 space exhibited high hourly average HIL in the morning (9:00 am-12:00 pm), but the HIL decreased sharply in the early afternoon (13:00 pm-16:00 pm). The reverse was true for Space A5 (M-HILA3 = 52,183 lx, EA-HILA3 = 3,583 lx; M-HILA5 = 1,442 lx, EA-HILA5 = 28,807 lx). This is mainly due to the horizontal and vertical diversity of the architectural layouts of these two spaces. The A3 space was a small, irregular public space where the north and west buildings were higher than the buildings on the other side. When the sun moved westward, there would be obvious solar blocking phenomenon. In contrast, Space A5 possessed a NE-SW canyon orientation, where the buildings on the south-eastern side were higher than those on the north-western side. Therefore, when the sun was in the eastern part of the sky and the angle of the sun was small, it could effectively block out direct sunlight in the morning. In contrast, though Site D was characterized by high-density mid-rise buildings, the architectural layout was very unified. Also, it was divided into four sub-blocks by two village main roads that crossed at 90 degrees (). The performances of outdoor illumination in the spaces between the sub-blocks and within the area of each sub-block were significantly different. The performance of outdoor daytime illumination in the former space group was significantly higher than that in the latter space group.
Figure 13. Example of effects of sunlight interception and penetration during the daytime: (a) Site YN-Space NY5; (b) Site JB-Space M12; (c) Site A-Space A2; (d) Site A-Space A3; (e) Site D-Space D1, D2 and D3; (f) Site F-Space F2 (source: photographed by authors).
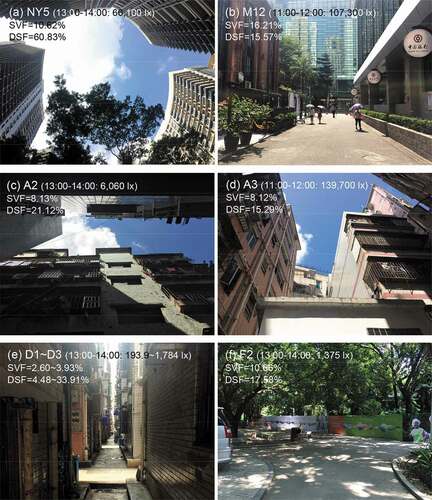
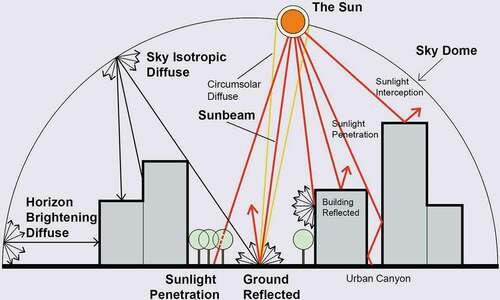
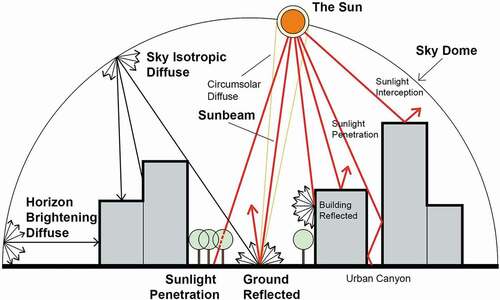
Figure 14. Mechanisms of outdoor illumination in cities: daylight and solar radiation patterns within urban canyons (source: drawn by authors, based on field observation and literature review of Miguet and Groleau Citation2002; Kotzen Citation2003; Tregenza and Wilson Citation2011; Douglas and James Citation2015; Giridharan Citation2016).
Meanwhile, the extremely low HIL could be observed in some areas of Site A and D, where artificial lighting was often used to enhance indoor daylighting for entertainment and small businesses on the ground floor (e.g. the spaces of A4, A5, and D1, where the HIL is always below 1,000 lx during the daytime). However, the artificial lighting of the interior space on the ground floor was determined by the daily life of the residents. In addition to the indigenous villagers, a large proportion of the residents living in Site A and D were migrant workers, young white-collar workers, new university graduates, and factory workers, who seldom stayed in the residential buildings during the working hours of the day. Most of these residents went out to work during the daytime. Therefore, in those high-density mid-rise urban villages, the so-called insufficient sunlight issue for most residents on the ground level (Zhang and Han Citation2009) became less prominent and not so urgent, due to the unique socio-cultural characteristics of sites A and D.
5.2. Daytime outdoor illumination and occupant use
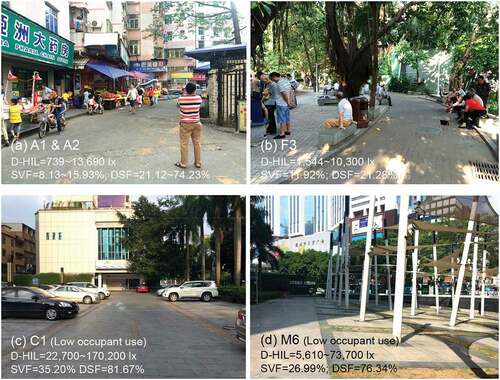
The combination of heat and visual comfort determined the occupants’ choice of location, stay duration and activities to participate in. Previous research suggested that people preferred to stay in the shade during both hot and cold seasons, in the light of past environmental experience and expectations (Lin Citation2009; Huang, Lin, and Lien Citation2015; Martinelli, Lin, and Matzarakis Citation2015; Cheung and Jim Citation2018). Although D-HIL in low SVF and high TCR spaces was much lower than that in modern urban neighbourhoods with high spatial openness, field observation of the study revealed that the former group of spaces (in sites A, D, and F) were consistently more attracted to urban residents with different social backgrounds than the latter (in sites C, YN, CWW and JB) (). Therefore, it could be estimated that in a typical summer day, the spaces located at the high-density mid-rise sites A and D and the vegetated urban park Site F possessed good visual and thermal comfort conditions (Yang, Lau, and Qian Citation2011; Jin et al. Citation2018; Wu et al. Citation2018; Pan Citation2019). Therefore, the average HIL range of sites A, D and F during peak hours (10:00 am-16:00 pm) could be referred for outdoor space design, thus ameliorating the environmental quality of daylighting (Peak-HILA = 1,932 lx ~ 26,805 lx; Peak-HILD = 15,994 lx ~ 45,113 lx; Peak-HILF = 7,530 lx ~ 13,739 lx). Moreover, to verify the social-ecological effects of sites A, D, and F under their specific morphological characteristics, more detailed and subjective investigations should be conducted in the future.
Figure 15. Examples of daytime occupant use of outdoor spaces in different types of urban (sub)neighbourhoods: (a) Site A – A1 and A2 (urban village); (b) Site F – F3 (urban park); (c) Site C – C1 (modern urban block); and (d) Site JB – M6 (urban open space) (source: photographed by authors).
6. Summary and conclusion
6.1. Major findings
Through measuring 11 open urban neighbourhood units that reflect the diversity of popular urban morphological patterns in Shenzhen’s urban centres, this research analyses the influence of multiple aspects of urban morphological characteristics on outdoor daylighting behaviours. By means of Pearson’s correlation and multiple linear regression analysis of urban design factors (UDFs) on the urban lighting indicators, some of the outdoor daylighting issues for the 11 sites and the most critical UDFs are also identified (Table 7). The main results are summarised as follows:
(a) Daytime outdoor visual comfort
Under typical summer daytime conditions, urban neighbourhoods with low BCR and TCR tend to experience outdoor glare and over lighting (avg. HIL≥ 30,000 lx), which may cause visual discomfort. On the other hand, this type of outdoor daylighting and solar exposure has a great potential for indoor lighting and heating, which can be used to collect and convert solar radiation into renewable and environmentally friendly energy sources.
It is expected that high-density mid-rise urban villages (sites A and D) and vegetated urban parks (Site F) will present favorable outdoor visual comfort during the day, with an average hourly pedestrian illumination of about 8,000 lx. With the mutual shading of the buildings as well as the “shading umbrella” created by the dense canopy of the trees (Emmanuel Citation1993), these urban morphological patterns achieve a good balance between sunlight interception and penetration.
(b) Influence of urban morphological characteristics
Urban morphological characteristics expressed by multiple UDFs can greatly influence daytime outdoor pedestrian illuminance levels and solar energy utilization. As for the evaluation of outdoor daylighting performance, point-level UDFs are more efficient than site-level UDFs.
Several key UDFs have been identified, which are different from the traditional density and geometric factors (i.e., BCR, FAR and H/W) adopted in Chinese urban planning and design standards, including SVF, MBH, GSA and DOS.
For every 10% increase in SVF, the daytime average illuminance level (D-HIL) will substantially increase, accounting for 71.6% of the explained rate of change. Simultaneously, late afternoon average illuminance level (LA-HIL) decreases by 23 lx with the increase of MBH by 1 m while increases by 3,403 lx with the increase of SVF by 10%. SVF and MBH together can explain 59.6% of the LA-HIL variation.
Regarding daytime site illuminance uniformity (D-SUo), SVF and GSA exert positive effects on D-SUo, while DOS has negative effects on D-SUo. If SVF increases by 10% and GSA increases by 0.10, D-SUo can be expected to increase by 0.10 and 0.05, respectively. In contrast, for every 10 m of DOS reduction, D-SUo increases by 0.004.
6.2. Insights from high-density mid-rise patterns
The study questions the media and academic criticism and negative comments about the “poor” daylighting environments in China’s high-density mid-rise urban villages (such as sites A and D). In such high-density mixed-living urban neighbourhoods, most residents tend to stay outdoors throughout the day to carry out a variety of activities (Zacharias et al. 2013; Al 2014; Pan Citation2019). For residents with diverse social backgrounds, the outdoor space of high-density mid-rise urban villages plays an equally important role as the indoor space (Remali et al. Citation2015; Sharifi Citation2019). In this high-density but socially and ecologically heterogeneous neighbourhood type, physical and social boundaries between indoor and outdoor areas are shaped, reconfigured, recombined, and gradually blurred in the long-term interaction between residents and the environment. The daylighting condition of outdoor spaces in urban villages has become an important index of residents’ daily life arrangements and outdoor activities to a large extent. Therefore, when the outdoor environment has visually and psychologically comfortable daylighting performance, it will always inspire people to go out of the room and experience nature. Noticeably, appropriately lit outdoor spaces have a positive impact on human physical and mental health, while reducing energy consumption for indoor artificial lighting and air conditioning.
7. Limitations and directions for future study
As the study was conducted in areas of low and middle latitudes, the results can be used to study and design urban outdoor daylight environments in these areas, excluding the high altitude area, due to different solar altitude angles at the same time throughout the day and different daily sunshine duration (Herrería-Alonso et al. 2020). There are some limitations in this study. First of all, due to the limitations of instruments and manpower, this study could not measure all the tested space simultaneously. Secondly, due to the main focus of the survey scale (neighbourhood-scale), this study only measures the geometric centre of each test space. Thirdly, the measurement was conducted in summer, and there is a lack of investigation on the different situations of sun height and daylight time in winter and transitional seasons. For the development of a more reliable standard for urban design and evaluation of outdoor daylighting in urban neighbourhoods, the perception and adaptation behaviour of residents is an important aspect, which was not investigated in this study. Future research could also measure vertical illumination in urban canyons to gain a deeper understanding. Follow-up studies could further assess urban outdoor daylight environment and space utilisation in cloudy or overcast weather conditions. Furthermore, it is necessary to study the relationship between the outdoor and indoor daylighting performances of various urban neighbourhood types and the energy consumption of indoor daylighting so as to promote a more intelligent urban integrated design process.
List of Nomenclature and Abbreviations
Table
Acknowledgements
This paper is developed from parts of the first author’s doctural thesis. All figures, photos, and tables are shown in this paper are by the authors (except for the ones that have been credited in the manuscript). The authors would like to thank the reviewers for their comments that helped to improve the manuscript. The authors also thank to Shenzhen Center for Design for their sharing of maps and site information of Hubei village neighbourhood to support urban morphological analysis in this paper.
Disclosure statement
No potential conflict of interest was reported by the authors.
Additional information
Notes on contributors
Wenjian Pan
Wenjian Pan, is Ph.D., architectural designer and urban researcher in the Department of Architecture & Urban Ecologies Design Lab (UEDL) at The University of Hong Kong. His current research interest examines the diverse environmental performances of China’s informal settlements (such as urban villages) and their impacts on city eco-systems, which aims to explore context and performance-based strategies for the achievement of inclusive urban renewal.
Juan Du
Juan Du, is Associate Professor in the Department of Architecture, Associate Dean (International and Mainland China Affairs), and Director of the Urban Ecologies Design Lab (UEDL) of the Faculty of Architecture at The University of Hong Kong. Her current research and design focus is on the relationship between urban planning and informal development within rapid urbanization, specifically on the “urban villages” of Shenzhen, and the “subdivided units” of Hong Kong.
Notes
1 Daylight climate zone (DCZ) is defined as the local outdoor illumination conditions and the meteorological factors that affect the changes of outdoor illumination.
2 Semi-cylindrical illuminance means “the average illuminance on the curved surface of an upright semi-cylinder.” In terms of the ability to evaluate faces apparently, Semi-cylindrical illuminance has been verified to have a better effect than the vertical illuminance (CIE Citation2000; Fotios Citation2017).
3 The Sunlight Space (Rizhao Jianju) refers to the minimum separation distance between the two rows of south-facing buildings in front and rear to ensure that the back row buildings receive no less than two hours of full-window sunshine (daylight) on the Winter Solstice (or the Great Cold Day). The sunlight space factor (SF) is defined as the ratio between the sunlight space (D) and the height of the eave that shelter the buildings (H-H1). H is the height of the front building, and H1 is the height of the windowsill of the rear building. SF = D/(H-H1).
It reveals that the concept of SF is highly related to the urban design factor of aspect ratio (H/W). According to the Standard for urban residential area planning and design(GB50180-2018), the SF in Guangzhou (23°08ʹ N) is suggested as 0.5 ~ 0.7, and Nanning (22°49ʹ N) 1.0, thus, SF for Shenzhen (22°27ʹ N ~ 22°52ʹ N) can be controlled as 0.8 ~ 1.0.
4 One lumen (1 lm) is defined as the luminous flux of light produced by a light source that emits one candela of luminous intensity over a solid angle of one steradian (1 cd).
5 Morning (M): 09:00–12:00); Early afternoon (EA): 13:00–16:00; Late afternoon (LA): 16:00–18:00.
6 The sky clearness can be divided into four levels based on the percentage of cloud area occupying the sky, including sunny (0 ~ 10%); partly cloudy (10 ~ 30%), cloudy (30 ~ 70%), and overcast (70 ~ 100%) (Meteorological Bureau Of Shenzhen Municipality).
7 Due to the instrument disorder and man-made negligence, the data collected in the mornings of 10 October 2017 and 11 October 2017 was missing.
8 The threshold of R2 in the regression analysis depends on the research nature. The present research adopts the standards by Cohen (Citation1988), which indicates that an (adjust) R2 value of 0.01, 0.09, and 0.24 represents low, medium, and high degrees of explanatory power respectively.
References
- Aida, M. 1982. “Urban Albedo as a Function of the Urban Structure – A Model Experiment.” Boundary Layer Meteorology 23 (4): 405–413. doi:https://doi.org/10.1007/BF00116269.
- Alavipanah, S., J. Schreyer, D. Haase, T. Lakes, and S. Qureshi. 2018. “The Effect of Multi-dimensional Indicators on Urban Thermal Conditions”. Journal of Cleaner Production 177: 115–123. doi:https://doi.org/10.1016/j.jclepro.2017.12.187.
- Alrubaih, M. S., M. F. M. Zain, M. A. Alghoul, N. L. N. Ibrahim, M. A. Shameri, and O. Elayeb. 2013. “Research and Development on Aspects of Daylighting Fundamentals”. Renewable and Sustainable Energy Reviews 21: 494–505. doi:https://doi.org/10.1016/j.rser.2012.12.057.
- Asl, S. R. M., and H. Safari. 2020. “Evaluation of Daylight Distribution and Space Visual Quality at Medical Centers through Spatial Layout.” Journal of Asian Architecture and Building Engineering. doi:https://doi.org/10.1080/13467581.2020.1800476.
- Ayoub, M. 2019. “100 Years of Daylighting: A Chronological Review of Daylight Prediction and Calculation Methods.” Solar Energy 194: 360–390. doi:https://doi.org/10.1016/j.solener.2019.10.072.
- Bellia, L., U. Blaszczak, F. Fragliasso, and L. Gryko. 2020. “Matching CIE Illuminants to Measured Spectral Power Distributions: A Method to Evaluate Non-visual Potential of Daylight in Two European Cities.” Solar Energy 208: 830–858. doi:https://doi.org/10.1016/j.solener.2020.08.021.
- Boyce, P. R. 2014. Human Factors in Lighting. Baton Rouge: CRC Press.
- Chatzipoulka, C., R. Compagnon, J. Kaempf, and M. Nikolopoulou. 2018. “Sky View Factor as Predictor of Solar Availability on Building Facades.” Solar Energy 170: 1026–1038. doi:https://doi.org/10.1016/j.solener.2018.06.028.
- Chatzipoulka, C., R. Compagnon, and M. Nikolopoulou. 2016. “Urban Geometry and Solar Availability on Facades and Ground of Real Urban Forms: Using London as a Case Study.” Solar Energy 138: 53–66. doi:https://doi.org/10.1016/j.solener.2016.09.005.
- Cheng, V., K. Steemers, M. Montavon, and R. Compagnon 2006. “Urban Form, Density, and Solar Potential”. In Conference Proceedings of the 23rd International Conference on Passive and Low Energy Architecture (PLEA 2006), Geneva, Switzerland, 6–8 September.
- Cheung, P. K., and C. Y. Jim. 2018. “Subjective Outdoor Thermal Comfort and Urban Green Space Usage in Humid-subtropical Hong Kong.” Energy and Buildings 173: 150–162. doi:https://doi.org/10.1016/j.enbuild.2018.05.029.
- CIE (International Commission on Illumination). 2000. Guide to the Lighting of Urban Areas (CIE 136–2000). https://cie.co.at/publications/guide-lighting-urban-areas
- Cohen, J. 1988. Statistical Power Analysis for the Behavioural Sciences. 2nd ed. New York: Academic Press.
- CPC Central Committee. 2016. Zhonggong Zhongyang Guowuyuan Guanyu Jinyibu Jiaqiang Chengshi Guihua Jianshe Guanli Gongzuo de Ruogan Yijian (Several Opinions on Further Strengthening the Management of Urban Planning and Construction). Xinhua Net.
- Cronin, T. W., S. Johnsen, J. Marshall, and E. J. Warrant. 2014. Visual Ecology. Princeton: Princeton University Press.
- DeKay, M. 2010. “Daylighting and Urban Form: An Urban Fabric of Light.” Journal of Architectural and Planning Research 27 (1): 35–56.
- Del Carpio, J. A. V., D. L. Marinoski, G. Trichês, R. Lamberts, and J. V. S. de Melo. 2016. “Urban Pavements Used in Brazil: Characterization of Solar Reflectance and Temperature Verification in the Field”. Solar Energy 134: 72–81. doi:https://doi.org/10.1016/j.solener.2016.04.044.
- Douglas, I., and P. James. 2015. Urban Ecology: An Introduction. Milton Park, Abingdon, Oxon; New York, NY: Routledge.
- Drach, P., E. L. Krüger, and R. Emmanuel. 2018. “Effects of Atmospheric Stability and Urban Morphology on Daytime Intra-urban Temperature Variability for Glasgow, UK.” Science of the Total Environment 627: 782–791. doi:https://doi.org/10.1016/j.scitotenv.2018.01.285.
- Du, J. 2020. The Shenzhen Experiment: The Story of China’s Instant City. Cambridge, Massachusetts: Harvard University Press.
- Durvasula, S., C. Kok, P. N. Sambrook, R. G. Cumming, S. R. Lord, L. M. March, R. S. Mason et al. 2010. “Sunlight and Health: Attitudes of Older People Living in Intermediate Care Facilities in Southern Australia.” Archives of Gerontology and Geriatrics 51 (3): e94–e99. doi:https://doi.org/10.1016/j.archger.2010.01.008.
- Emmanuel, R. 1993. “A Hypothetical ‘Shadow Umbrella’ for Thermal Comfort Enhancement in the Equatorial Urban Outdoors.” Architectural Science Review 36 (4): 173–184. doi:https://doi.org/10.1080/00038628.1993.9696759.
- Fang, J. Q., Y. Y. Xu, and F. Chen. 2017. Weisheng Tongjixue (Health Statistics). Beijing: People’s Medical Publishing House.
- Fotios, S. 2017. “Measure for Measure. Semi-cylindrical Illuminance: A Semi-conceived Measure?” Lighting Journal 82 (2): 34–35.
- Galatioto, A., and M. Beccali. 2016. “Aspects and Issues of Daylighting Assessment: A Review Study.” Renewable and Sustainable Energy Reviews 66: 852–860. doi:https://doi.org/10.1016/j.rser.2016.08.018.
- Giridharan, R. 2016. “Chapter 8: Urban Climate Modeling: Challenges in the Tropics.” In Urban Climate Challenges in the Tropics: Rethinking Planning and Design Opportunities, edited by R. Emmanuel, 255–304. London: Imperical College Press.
- Glicksman, L., and J. Lin. 2006. Sustainable Urban Housing in China: Principles and Case Studies for Low-Energy Design. Dordrecht: Springer Netherlands.
- Harvard Medical School. 2010. “A Prescription for Better Health: Go Alfresco. Spending Time outside Might Have Some Health Benefits – And the ‘Greening” of Exercise Might Have Some More.” Harvard Health Letter 35 (9): 1.
- He, Y., S. H. Ding, and Y. Lin. 2012. “The Design Method for Daylighting in High Density Urban Environments of Chongqing.” New Architecture 1: 100–102.
- Herrería-Alons, S., A. Suárez-González, M. Rodríguez-Pérez, R. F. Rodríguez-Rubio, and C. López-García. 2020. “A Solar Altitude Angle Model for Efficient Solar Energy Predictions.” Sensors 20 (5): 1391. doi:https://doi.org/10.3390/s20051391.
- Huang, K. T., T. P. Lin, and H. C. Lien. 2015. “Investigating Thermal Comfort and User Behaviors in Outdoor Spaces: A Seasonal and Spatial Perspective.” Advance in Meteorology 2015: 1–11. doi:https://doi.org/10.1155/2015/423508.
- ISO 7726. 1998. Ergonomics of the Thermal environment-Instruments for Measuring Physical Quantities. Geneva: International Standard Organization (ISO).
- JCIE (Japanese National Committee of CIE). 1985. Zhaoming Shouce (A Manual for Lighting Design). Beijing: China Architecture & Building Press.
- Jiang, X. J., D. Ye, and L. Wang. 2020. “The Evolution of Global Healthy City Movement and the Function of Urban Planning.” Urban Planning International 35 (6): 128–134.
- Jin, H., P. Cui, N. H. Wong, and M. Ignatius. 2018. “Assessing the Effects of Urban Morphology Parameters on Microclimate in Singapore to Control the Urban Heat Island Effect.” Sustainability 10 (1): 206. doi:https://doi.org/10.3390/su10010206.
- Jin, Z. F., and Y. X. Zhu. 2001. Jianzhu Huanjingxue (Study of Architectural Environment). Beijing: China Architecture & Building Press.
- Kotzen, B. 2003. “An Investigation of Shade under Six Different Tree Species of the Negev Desert Towards Their Potential Use for Enhancing Micro-climatic Conditions in Landscape Architectural Development.” Journal of Arid Environments 55 (2): 231–274. doi:https://doi.org/10.1016/S0140-1963(03)00030-2.
- Leder, S. M., F. O. R. Pereira, A. Claro, and M. G. Ramos. 2006. “Impact of Urban Design on Daylight Availability.” In Proceedings of the 23rd Conference on Passive and Low Energy Architecture, Geneva, Switzerland, 6–8 September.
- LEED (Leadership in Energy and Environmental Design). 2018. LEED V4 for Neighbourhood Development. Washington, DC: U.S. Green Building Council.
- Lin, T. P. 2009. “Thermal Perception, Adaptation and Attendance in a Public Square in Hot and Humid Regions.” Building and Environment 44 (10): 2017–2026. doi:https://doi.org/10.1016/j.buildenv.2009.02.004.
- Lynch, K. 1981. Good City Form. Cambridge, MA: MIT Press.
- Ma, J., X. Yao, G. Liu, X. M. Su, R. Dang, H. Hu, and Z. Li. 2009. “Investigation on Exterior Luminous Environment of Residential Area in the City.” China Illuminating Engineering Journal 20 (4): 9–13.
- Martinelli, L., T. P. Lin, and A. Matzarakis. 2015. “Assessment of the Influence of Daily Shadings Pattern on Human Thermal Comfort and Attendance in Rome during Summer Period.” Building and Environment 92: 30–38. doi:https://doi.org/10.1016/j.buildenv.2015.04.013.
- Martins, T. A. L., L. Adolphe, and L. E. G. Bastos. 2014. “From Solar Constraints to Urban Design Opportunities: Optimization of Built Form Typologies in a Brazilian Tropical City.” Energy and Buildings 76: 43–56. doi:https://doi.org/10.1016/j.enbuild.2014.02.056.
- Mead, M. N. 2008. “Benefits of Sunlight: A Bright Spot for Human Health.” Environmental Health Perspectives 116 (4): A160–167. doi:https://doi.org/10.1289/ehp.116-a160.
- Middel, A., J. Lukasczyk, and R. Maciejewski. 2017. “Sky View Factors from Synthetic Fisheye Photos for Thermal Comfort Routing – A Case Study in Phoenix, Arizona.” Urban Planning 2 (1): 19–30. doi:https://doi.org/10.17645/up.v2i1.855.
- Middel, A., J. Lukasczyk, R. Maciejewski, M. Demuzere, and M. Roth. 2018. “Sky View Factor Footprints for Urban Climate Modeling”. Urban Climate 25: 120–134. doi:https://doi.org/10.1016/j.uclim.2018.05.004.
- Miguet, F., and D. Groleau. 2002. “A Daylight Simulation Tool for Urban and Architectural Spaces – Application to Transmitted Direct and Diffuse Light through Glazing.” Building and Environment 37 (8): 833–843.
- Mohajeri, N., G. Upadhyay, A. Gudmundsson, D. Assouline, J. Kämpf, and J.-L. Scartezzini. 2016. “Effects of Urban Compactness on Solar Energy Potential”. Renewable Energy 93: 469–482. doi:https://doi.org/10.1016/j.renene.2016.02.053.
- MOHURD. 2012. Standard for Daylighting Design of Buildings GB 50033-2013 (Implemented in 2013). Beijing: China Architecture & Building Press.
- MOHURD. 2013. Standard for Lighting Design of Buildings GB 50034-2013 (Implemented in 2014). Beijing: China Architecture & Building Press.
- MOHURD. 2016. Code for Thermal Design of Civil Building GB 50176-2016 (Implemented in 2017). Beijing: China Architecture & Building Press.
- MOHURD. 2018. Standard for Urban Residential Areas Planning and Design GB50180-2018. Beijing: China Architecture & Building Press.
- MOHURD. 2019. Assessment Standard for Green Building GB/T 53078-2019. Beijing: China Architecture & Building Press.
- Montavon, M. 2010. Optimisation of Urban Form by the Evaluation of the Solar Potential.
- Nasrollahi, N., and E. Shokri. 2016. “Daylight Illuminance in Urban Environments for Visual Comfort and Energy Performance.” Renewable and Sustainable Energy Reviews 66: 861–874. doi:https://doi.org/10.1016/j.rser.2016.08.052.
- Ng, E. 2003. “Studies on Daylight Design and Regulation of High-density Residential Housing in Hong Kong.” Lighting Research & Technology 35 (2): 127–139. doi:https://doi.org/10.1191/1477153503li087oa.
- Nicol, F., M. Wilson, and C. Chiancarella. 2006. “Using Field Measurements of Desktop Illuminance in European Offices to Investigate Its Dependence on Outdoor Conditions and Its Effect on Occupant Satisfaction, and the Use of Lights and Blinds.” Energy and Buildings 38 (7): 802–813. doi:https://doi.org/10.1016/j.enbuild.2006.03.014.
- Norton, B., M. Balick, R. Hobday, C. Fournier, J. L. Scartezzini, J. Solt, and A. Braun. 2017. “Daylight: Contexts and Concepts.” In Changing Perspective on Daylight: Science, Technology, and Culture, 4–8. Washington, DC: Science/AAAS, Custom Publishing Office.
- Oke, T. R. 1988. “The Urban Energy Balance.” Progress in Physical Geography: Earth and Environment 12 (4): 471–508. doi:https://doi.org/10.1177/030913338801200401.
- Pan, W. J. 2019. Diverse Environmental Performances of Urban Villages and Insights for Enhancing Quality of Urban Renewal in Shenzhen. Department of Architecture, The University of Hong Kong, Hong Kong SAR, China.
- Papadakis, G., P. Tsamis, and S. Kyritsis. 2001. “An Experimental Investigation of the Effect of Shading with Plants for Solar Control of Buildings.” Energy and Buildings 33 (8): 831–836. doi:https://doi.org/10.1016/S0378-7788(01)00066-4.
- Regent Instruments Inc. 2016. WinSCANOPY 2016a for Hemispherical Image Analysis. Canada: Regent Instruments Inc.
- Remali, A. M., S. Porta, O. Romice, and H. Abudib. 2015. “Street Quality, Street Life, Street Centrality.” In Suburban Urbanities: Suburbs and the Life of the High Street, edited by L. Vaughan, 104–129. London: UCL Press.
- Rode, P., C. Keim, G. Robazza, P. Viejo, and J. Schofield. 2014. “Cities and Energy: Urban Morphology and Residential Heat-energy Demand.” Environment and Planning. B, Planning & Design 41 (1): 138–162. doi:https://doi.org/10.1068/b39065.
- Rosso, F., A. L. Pisello, F. Cotana, and M. Ferrero. 2016. “On the Thermal and Visual Pedestrians‘ Perception about Cool Natural Stones for Urban Paving: A Field Survey in Summer Conditions.” Building and Environment 107: 198–214. doi:https://doi.org/10.1016/j.buildenv.2016.07.028.
- Salat, S. 2011. Cities and Forms: On Sustainable Urbanism. Hermann: CSTB Urban Morphology Laboratory.
- Saratsis, E., T. Dogan, and C. F. Reinhart. 2017. “Simulation-based Daylight Analysis Procedure for Developing Urban Zoning Rules.” Building Research & Information 45 (5): 478–491. doi:https://doi.org/10.1080/09613218.2016.1159850.
- Sarralde, J. J., D. J. Quinn, D. Wiesmann, and K. Steemers. 2015. “Solar Energy and Urban Morphology: Scenarios for Increasing the Renewable Energy Potential of Neighbourhoods in London.” Renewable Energy 73: 10–17.
- Sharifi, A. 2019. “Resilient Urban Forms: A Review of Literature on Streets and Street Networks.” Building and Environment 147: 171–187. doi:https://doi.org/10.1016/j.buildenv.2018.09.040.
- Shenzhen Climate Centre. 2011. Assessment Report on Solar and Wind Energy Resources in Shenzhen. (brief version). Shenzhen: Shenzhen Climate Centre.
- Sim, D. 2019. Soft City: Building Density for Everyday Life. Washington: Island Press.
- Standardization Administration of China. 2008. Measurement Methods for Lighting GB/T 5700-2008. Beijing: Standards Press of China.
- Stewart, I. D., and T. R. Oke. 2012. “Local Climate Zones for Urban Temperature Studies.” Bulletin of the American Meteorological Society 93 (12): 1879–1900. doi:https://doi.org/10.1175/BAMS-D-11-00019.1.
- Strømann-Andersen, J., and P. A. Sattrup. 2011. “The Urban Canyons and Building Energy Use: Urban Density versus Daylight and Passive Solar Gains.” Energy and Buildings 43 (8): 2011–2020. doi:https://doi.org/10.1016/j.enbuild.2011.04.007.
- Summerskill, W., H. Wang, and R. Horton. 2018. “Healthy Cities: Key to a Healthy Future in China.” The Lancet 391 (10135): 2086–2087. doi:https://doi.org/10.1016/S0140-6736(18)30608-1.
- Taleghani, M. 2018. “The Impact of Increasing Urban Surface Albedo on Outdoor Summer Thermal Comfort within a University Campus.” Urban Climate 24: 175–184. doi:https://doi.org/10.1016/j.uclim.2018.03.001.
- Taylor, J. R. 2015. “The China Dream in an Urban Dream: Assessing the CPC’s National New-Type Urbanization Plan.” Journal of Chinese Political Science 20 (2): 107–120. doi:https://doi.org/10.1007/s11366-015-9341-7.
- Tong, Y. Y., and B. Lighthart. 1997. “Solar Radiation Has a Lethal Effect on Natural Populations of Cultural Outdoor Atmospheric Bacteria.” Atmospheric Environment 31 (6): 897–900. doi:https://doi.org/10.1016/S1352-2310(96)00235-X.
- Tregenza, P., and M. Wilson. 2011. Daylighting: Architecture and Lighting Design. Abingdon, Oxon, New York: Routledge.
- Turan, I., A. Chegut, D. Fink, and C. Reinhart. 2020. “The Value of Daylight in Office Spaces.” Building and Environment 168: 106503. doi:https://doi.org/10.1016/j.buildenv.2019.106503.
- van Esch, M., R. Looman, and G. J. de Bruin-hordijk; De Bruin-Hordijk. 2012. “The Effects of Urban and Building Design Parameters on Solar Access to the Urban Canyon and the Potential for Direct Passive Solar Heating Strategies.” Energy and Buildings 47: 189–200. doi:https://doi.org/10.1016/j.enbuild.2011.11.042.
- Wang, J., M. C. Wei, and X. K. Ruan. 2020. “Characterization of the Acceptable Daylight Quality in Typical Residential Buildings in Hong Kong.” Building and Environment 182: 107094. doi:https://doi.org/10.1016/j.buildenv.2020.107094.
- Wirz-Justice, A., D. J. Skene, and M. Münch. 2020. “The Relevance of Daylight for Humans.” Biochemical Pharmacology 114304. doi:https://doi.org/10.1016/j.bcp.2020.114304.
- Wu, W., H. Y. Ren, M. Yu, and Z. Wang. 2018. “Distinct Influences of Urban Villages on Urban Heat Islands: A Case Study in the Pearl River Delta, China.” International Journal of Environmental Research and Public Health 15 (8): 1666. doi:https://doi.org/10.3390/ijerph15081666.
- Yang, F. 2009. The Effect of Urban Design Factors on the Summertime Heat Islands in High-Rise Residential Quarters in Inner-City Shanghai. Department of Architecture, The University of Hong Kong, Hong Kong SAR, China.
- Yang, F., S. S. Y. Lau, and F. Qian. 2011. “Urban Design to Lower Summertime Outdoor Temperatures: An Empirical Study on High-rise Housing in Shanghai.” Building and Environment 46 (3): 769–785. doi:https://doi.org/10.1016/j.buildenv.2010.10.010.
- Yang, S. C., and L. Y. Shi. 2017. “Prediction of Long-term Energy Consumption Trends under the New National Urbanization Plan in China.” Journal of Cleaner Production 166: 1144–1153. doi:https://doi.org/10.1016/j.jclepro.2017.08.092.
- Yannas, S. 2001. “Toward More Sustainable Cities.” Solar Energy 70 (3): 281–294. doi:https://doi.org/10.1016/S0038-092X(00)00091-8.
- Yasushi, A. 2006. Juzhu Huanjing: Pingjia Fangfa Yu Lilun (Living Environment: Evaluation Methods and Theories). Beijing: Tsinghua University Press.
- Ye, L., Z. J. Cheng, Q. Q. Wang, W. S. Lin, and F. F. Ren. 2013. “Overview on Green Building Label in China.” Renewable Energy 53: 220–229. doi:https://doi.org/10.1016/j.renene.2012.11.022.
- Yow, D. M. 2007. “Urban Heat Islands: Observation, Impacts, and Adaptation.” Geography Compass 1 (6): 1227–1251. doi:https://doi.org/10.1111/j.1749-8198.2007.00063.x.
- Yun, G., and K. S. Kim. 2013. “An Empirical Validation of Lighting Energy Consumption Using the Integrated Simulation Method.” Energy and Buildings 57: 144–154. doi:https://doi.org/10.1016/j.enbuild.2012.10.028.
- Zhang, H., and Y. B. Han. 2009. “Study on Environmental Problems of Urban Villages and Strategies for Improvement.” Theory Study (7): 56–58.
- Zhang, J., L. Xu, V. Shabunko, S. E. R. Tay, H. Sun, S. S. Y. Lau, T. Reindl, et al. 2019. “Impact of Urban Block Typology on Building Solar Potential and Energy Use Efficiency in Tropical High-density City”. Applied Energy 240: 513–533. doi:https://doi.org/10.1016/j.apenergy.2019.02.033.