
 ?Mathematical formulae have been encoded as MathML and are displayed in this HTML version using MathJax in order to improve their display. Uncheck the box to turn MathJax off. This feature requires Javascript. Click on a formula to zoom.
ABSTRACT
Unsafe behavior is a critical risk factor in the construction industry, but it cannot be quantitatively evaluated by the traditional risk matrix (RM) method. Based on accident cases in the building construction industry in China, probabilistic reasoning from unsafe behaviors to accidents is explored using a Bayesian network (BN) to modify the RM method. The unsafe behaviors involved in 287 accident cases of four types (fall, collapse, struck-by and lifting) are used to construct a BN model. The parameters of the model are revised via Beta and Dirichlet distributions, and the conditional probabilities of the occurrence of accidents caused by unsafe behaviors are then obtained to determine the impact of unsafe behaviors on different types of accidents. A list of behavioral risk levels for the four accident types is generated by considering the initial probabilities and the conditional probabilities. The results show that the MRM method is feasible and effective, and unsafe behaviors that have a great impact on the four accident types are identified. The MRM method provides a method for quantitatively evaluating behavioral risk and enhances behavioral risk management on construction sites; thus, it is of theoretical and practical significance.
1. Introduction
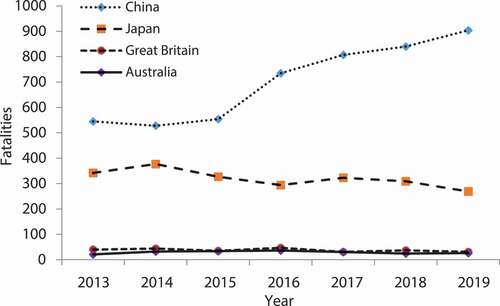
The construction industry is regarded as one of the most high-risk industries worldwide. Statistics show that from 2003 to 2019 in Australia, the number of fatalities due to work-related traumatic injury was 3936, with construction employees representing 14.9% of the total (Safe Work Australia Citation2020). In Great Britain, fatal injuries in the main industries numbered 111 in 2019/20, with construction workers representing 36% (HSE Citation2019). In Japan in 2019, the number of laborer deaths was 845, of which construction workers accounted for 31.8% (MHLW Citation2019). Compared with these developed countries, China had 1732 accidents and 1752 fatalities in its construction industry in the first half of 2018 (Ministry of Emergency Management Citation2018). These data reflect that the safety situation in the construction industry remains serious. Accidents are regarded as discrete events without a uniform frequency, and their occurrences are difficult to predict due to uncertain contributing factors (Shao et al. Citation2019). It is well known that the most effective way to improve safety performance is to prevent accidents and reduce uncertainty before accidents occur (Fung et al. Citation2010).
Risk is defined as the effect of uncertainty on objectives (ISO Citation2018). It is determined based on the probability of an event and its potential negative consequences (Markowski and Mannan Citation2008; Ni, Chen, and Chen Citation2010). In construction projects, risk factors are mainly derived from 5M1E (that is, man, machine, raw material, method, measurement and the environment), in which safety risk consists of unsafe conditions and unsafe behaviors. At construction sites, hazards such as dangerous chemicals and pressure vessels are strictly controlled and stored separately, and their safe distances are limited. However, as a critical type of safety risk, the unsafe behavior of individuals and groups is not easy to control because these individuals and groups are involved in numerous construction tasks. Thus, the risk management of unsafe behaviors is relatively weak, and unsafe behavior is a main factor leading to accidents. Haslam et al. (Citation2005) found that 70% of accidents are attributed to workers or work teams. Li et al. (Citation2015) reported that approximately 80% of all accidents on construction sites are caused by unsafe human behaviors. Additionally, because some types of behavioral risk change dynamically due to fluid and intensive construction work, their associations with accidents are strong. For instance, the absence or improper use of personal protective equipment (PPE) contributes greatly to falling accidents (Zhang and Fu Citation2017). Therefore, behavioral risk should receive more attention in the construction industry.
To control unsafe behaviors, behavioral risk levels should be initially determined, and corresponding measures should then be taken. Traditional methods for determining safety risk levels include the LEC evaluation method (Jiang, Lv, and Liu Citation2016) and the risk matrix (RM) method (Youli, Yingjian, and Xiaoxia Citation2018). The RM method is widely used; however, quantitative evaluation is lacking in the determination of probability and consequence. A Bayesian network (BN) is effective for expressing uncertain knowledge and reasoning to provide decision support. Thus, it is suitable for exploring the probabilistic transmission paths from unsafe behaviors to accidents. Each node in a BN corresponds to a variable, and edges show conditional dependencies between variables (Bartlett and Cussens Citation2017). Taking unsafe behaviors and accidents as nodes, their probability connections could be built in a BN. The impact of unsafe behaviors on accidents is reflected by the conditional probabilities of unsafe behaviors leading to accidents. By integrating BN into the RM method, the consequences of behavioral risk could be quantitatively identified, and the impact of specific behavioral risks on different types of accidents could be explored.
Accordingly, this paper regards behavioral risk evaluation in the construction industry as the research object, and its primary aim is to use BN to determine behavioral risk consequences as a means of avoiding the subjectivity that exists in the traditional RM method. A case study method in which the cases are from building construction in China is adopted as the research methodology. The research hypothesis is that the consequences of behavioral risk can be quantitatively identified by integrating BN into the RM method. Furthermore, the proposed MRM method can dynamically evaluate the impact of behavioral risk on different types of accidents.
2. Literature review
2.1. Application of the RM method to safety risk evaluation
Given its ease of use and intuitive presentation of results, the RM method is widely used (e.g., Sun, Park, and Lee Citation2017). Due to the continuous innovation and improvement of theories and methods, many scholars have improved the RM method by integrating it with other risk evaluation methods to make it more practical and effective. With regard to determining the risk levels of events, Li et al. (Citation2020) combined the fuzzy fault tree analysis method with the dynamic fuzzy logic method and integrated the RM method to determine the levels of safety risk in the mine industry. Duan et al. (Citation2016) proposed a RM analysis framework based on potential risk impact that combined the fuzzy probability method with a Bayesian belief network model for risk evaluation and ranking. Lu et al. (Citation2015) used a RM composed of a probability ranking criterion and a consequence ranking criterion to obtain comprehensive quantitative results on natural gas pipeline leakage risk. Luo, Wu, and Duan (Citation2018) proposed a quantitative risk evaluation method that combined a risk matrix, a fault tree and a fishbone diagram model to determine the risk of leakage of a spherical natural gas tank. To enhance the rationality and accuracy of the traditional RM method, Lopes, Oliveira, and e Costa (Citation2015) used multi-criteria decision analysis methods in the health and safety evaluation of an occupational health and safety unit to design and deploy RMs. Ruan, Yin, and Frangopol (Citation2015) proposed a RM that integrates risk attitudes based on utility theory to support the risk management process. Markowski and Mannan (Citation2008) and Abul-Haggag and Barakat (Citation2013) developed fuzzy risk matrices to improve boundary categories and address precise value problems of frequency and severity in traditional risk matrices. However, the evaluation process was greatly affected by the empirical knowledge of experts, and individual bias led to deviations in the results. The impact of behavioral risk on different types of accidents was not discussed in the RM method.
2.2. Applications of a BN to unsafe behavior
Studies have long examined how to use probability theory to effectively deal with uncertain information and knowledge. BN is a representative inference and learning model (e.g., Ko and Han Citation2015; Seo, Shin, and Han Citation2010). Factors influencing unsafe behavior have been explored in several studies. By integrating human factors analysis and a classification system with BN, Mirzaei Aliabadi et al. (Citation2018) found that personnel factors (e.g., lack of safety knowledge) had a high influence on unsafe acts. Mohammadfam et al. (Citation2017) adopted BN based on expert opinions and Dempster-Shafer theory to establish causal relationships among various factors influencing the safety behavior of employees. Ma, Chong, and Liao (Citation2019) developed a causal human error model based on the cognitive reliability and error analysis method and a dynamic BN to analyze the sensitive factors that affected the occurrence of human errors in elevator installations. Ghasemi et al. (Citation2017) used a safety behavior sampling technique and BN to explore the influence of personal and temporal factors on employees’ unsafe behavior at a construction site. Chen, Qiao, and Zeng (Citation2019) used the BN to establish cause-effect relationships between the states of coal miners and unsafe behaviors. Some studies have explored the impact of unsafe behaviors on accidents. Naghavi-Konjin et al. (Citation2020) developed a BN model for ranking the factors that contribute to occupational incidents in the petroleum industry and found that procedural violations were the most influential factor in determining the probability of occupational incidents. Bai and Zhao (Citation2020) integrated Dynamic Fault Tree Analysis and BNs to analyze the occupational safety risks of high-altitude fall accidents in construction, and found that not wearing a seat belt was one of the main influencing factors. The existing studies in which BN has been applied to the analysis of unsafe behaviors have mainly focused on identifying the factors that influence these behaviors, and the impact of unsafe behaviors on accidents should be further explored.
Briefly stated, the traditional RM method is subjective in determining the probabilities and consequences of safety risk. The impact of safety risk events on different types of accidents has not been explored. Furthermore, there are limitations in exploring the impact of unsafe behaviors on accidents through BN. Therefore, this paper proposes the MRM method to quantitatively determine the probabilities and consequences of behavioral risk. The conditional probabilities that unsafe behaviors will lead to accidents are calculated by BN to evaluate the consequences of behavioral risk. The objectivity of the risk evaluation process is enhanced via the MRM method.
3. Methodology
This paper uses a case study method to verify the feasibility of MRM (Yin Citation2017). At the worldwide level, construction workers are three times more likely to die and two times more likely to suffer injuries at work than workers averaged over all other occupational sectors (Sousa, Almeida, and Dias Citation2014). shows the number of fatal injuries in the construction industry based on data obtained from the government websites of several countries. Overall, the number of fatal injuries in China increased and exceeded 900 in 2019; this figure is much higher than the numbers reported for several developed countries (HSE Citation2019; MHLW Citation2019; MOHURD Citation2019; Safe Work Australia Citation2020). Moreover, the number of deaths in the construction sector has been higher than that in the coal mine sector, and construction has ranked first in the number of deaths among all industrial production sectors since 2012 in China (Zhang et al. Citation2019). Many of these fatalities are caused by unsafe behaviors. Considering their negative impact, behavioral risk evaluation is of great significance for improving safety performance in the Chinese construction industry. As a labor-intensive task, building construction has the characteristic of high risk. Cheng et al. (Citation2010) noted that of 800 occupational accidents analyzed, 57% were related to building construction projects. In addition, the convenience of local data access makes collection and analysis of the data practical. Therefore, a case study method is used in this evaluation of behavioral risks associated with building construction in China.
Figure 1. Fatal injuries in the construction industry.
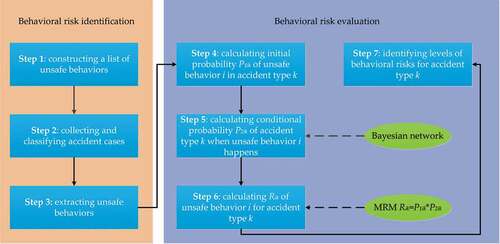
shows the framework of this case study. (i) A list of unsafe behaviors is constructed from related safety standards and operating procedures. (ii) Historical accident cases in building construction are collected from government websites and classified. (iii) According to the definitions of unsafe behaviors on the list, unsafe behaviors are extracted from the historical accident cases. (iv) The initial probability P1ik of unsafe behavior is calculated based on the frequency of this behavior in different types of accidents. (v) Through BN, the conditional probability P2ik of unsafe behaviors leading to accident type k is calculated. (vi) The risk Rik of unsafe behavior i for accident type k is calculated via the MRM method. (vii) Behavioral risk levels for accident type k are identified to measure the impact of unsafe behaviors on different types of accidents.
Figure 2. Framework used in behavioral risk identification and evaluation.
3.1. Behavioral risk identification
It is necessary to define unsafe behaviors to ensure that they can be extracted from reports of accident cases. Based on the relevant safety standards and operating procedures, a list of unsafe behaviors is initially created. The unsafe behaviors on this list are mainly extracted from GB 6441–1986 (Citation1986) in China. In this safety standard, 49 unsafe behaviors are included, but some of them are related only to the mining industry. Therefore, other safety standards and operating procedures such as JGJ 80–2016 (Citation2016) and GB 50278–2010 (Citation2010) are also used to identify unsafe behaviors in the construction industry. Finally, a total of 73 unsafe behaviors across 19 types related to building construction are identified.
Data on accident cases in selected provinces between 2010 and 2018 are then collected from government websites in China, mainly from the websites of the Ministry of Housing and Rural-Urban Development and the Work Safety Administration. The availability of detailed reports on accident cases makes it convenient to extract unsafe behaviors. In addition, the authenticity and reliability of the data can be guaranteed because the data are obtained from government notices. However, some factors affect the amount of data available. Many accidents, especially those that occurred prior to 2010, have been removed from the websites, and some accidents lack detailed reports and therefore cannot be used in further analysis. Additionally, some accidents caused by unsafe conditions or the environment have been eliminated. Finally, a total of 303 accident cases involving unsafe behaviors are initially collected. Of these cases, the four accident types fall (F), collapse (C), struck-by (S) and lifting (L) account for more than 94%. Because other types of accidents are too few in number, they are not considered in the analysis. Finally, 287 accident cases are identified, among which F accounts for the largest number (191 cases, 67%), followed by C (39 cases, 14%), S (33 cases, 11%), and L (24 cases, 8%), as shown in . Then, 211 groups involving 37 unsafe behaviors are extracted from the four types of accidents; one example of extracting a group of unsafe behaviors from a fall accident is shown in . The 37 unsafe behaviors are represented by their assigned numbers in the following analysis. The Appendix A lists the 37 unsafe behaviors and the number of instances of each.
Figure 3. Percentages of the four types of accident cases.
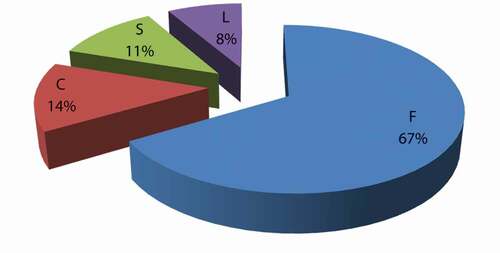
Table 1. One example of extracting a group of unsafe behaviors associated with a fall accident
3.2. Bayesian network
The BN has been increasingly used in a wide range of applications since it was first proposed by Pearl (Pearl Citation1988). A BN is composed of two parts: a directed acyclic graph (DAG) and an associated joint probability distribution (JPD) (Wang and Chen Citation2017; Wu et al. Citation2015). It allows users to deal with incomplete data easily and to learn the causal relationships between variables. Therefore, it can be used to describe how unsafe behaviors can lead to accidents.
3.2.1. Principle of BN parameter estimation
In this study, the nodes in the BN model are unsafe behavior nodes and accident nodes. The conditional probability of an accident node is expressed as P2, and the equation for its calculation is as follows:
where P2i represents the conditional probability of an accident node when unsafe behavior Bi is an output variable; Bij represents the state of unsafe behavior Bi, j= 1, 2 (representing occurring and not occurring, respectively); and Yk represents the state of accident nodes, k= 1, 2, 3, 4 (representing the occurrence of accident type S, C, F, and L, respectively).
In traditional algorithms, the initial probability P1ik of unsafe behavior Bi would be input into EquationEquation (1)(1)
(1) as a prior probability. In this study, however, the initial probabilities of some unsafe behaviors are low, even 0. Limited by the quantity of the collected accident cases, it cannot be assumed that the probabilities of these unsafe behaviors occurring in a certain type of accident are 0. Thus, a Beta distribution and a Dirichlet distribution are introduced to modify P1ik in the parameter estimation of BN.
Since there are no data except for the accident case data with which to identify the prior probabilities of unsafe behavior nodes, the non-informative priors approach is adopted. This strategy assumes that a variable node has the same probability of appearing in each result. Because an unsafe behavior node belongs to a dichotomous variable, the distributions of its prior probability and posterior probability satisfy the Beta distribution. The posterior probability of unsafe behavior Bi is represented as P(Bi), which is calculated by modifying the prior probability based on the accident cases. Under non-informative priors, hyperparameters α and β of the Beta distribution are 1. The posterior probability of unsafe behavior Bi is calculated using EquationEquation (2)(2)
(2) :
where n is the frequency of unsafe behavior Bi in the accident cases and N is the number of accident cases.
Accident node Y belongs to a polytomous variable including the four types S, C, F, and L. In addition, Y has only one parent node regardless of which unsafe behavior node is used as an output variable. The prior and posterior probability distributions of Y satisfy the Dirichlet distribution; thus, the prior and posterior probability distributions of Y∩Bi also satisfy the Dirichlet distribution. P(Yk∩Bij) is calculated as follows:
where Njk represents the number of accident cases when the state of parent node Bi is j and the state of child node Y is k. The result of hyperparameter ajk is 1/4 in this study.
Substituting EquationEquations (2)(2)
(2) and (Equation3
(3)
(3) ) into EquationEquation (1)
(1)
(1) , the modified equation of the conditional probability is as follows:
3.3. The MRM method
RM was originally devised by the acquisition reengineering team at the Air Force Electronic Systems Center (ESC) in April 1995 to evaluate the risk of purchase projects in the life cycle (Garvey and Lansdowne Citation1998). RM is built with the combination of assessments regarding the probability (P) of risk occurrence and the consequences (C) of risk. The levels of risk are then identified to develop strategies for risk management. Risk (R) is computed as R= P*C.
Safety risk in construction is defined as the combination of the probability of causing accidents and the consequences of potential accidents (Yang et al. Citation2012). Considering that the consequences of potential accidents caused by unsafe behaviors are identified via BN, the equation used by the MRM method is as follows:
where Rik is the risk level of unsafe behavior i causing accident type k. Lik is the level of probability of unsafe behavior i, which is determined by the initial probability P1ik of unsafe behavior i. Sik is the severity level of the consequence of accident type k caused by unsafe behavior i, which is determined by the conditional probability P2ik of accident type k when unsafe behavior i occurs.
4. Process and result of behavioral risk evaluation
4.1. The initial probabilities of unsafe behaviors
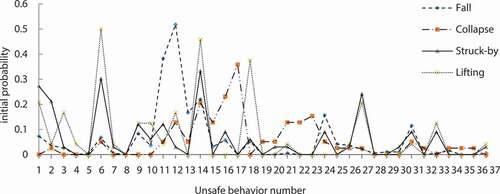
The initial probabilities of unsafe behaviors are determined by the relative frequencies at which these unsafe behaviors occur in the four types of accidents. For instance, in falling accidents, the frequency of unsafe behavior 14 (engaging in specialized operation without a permit) is 42, and the total number of accidents involving falls is 191. Thus, the initial probability of this unsafe behavior occurring in association with falling accidents is approximately 0.22. The initial probabilities of the occurrence of 37 unsafe behaviors in the four types of accidents are shown in . The nodes of unsafe behaviors with high initial probabilities are 11 and 12 (fall), 17 (collapse), and 6 and 14 (struck by and lifting). The initial probabilities are used to determine the risk probabilities in the MRM method.
Figure 4. The initial probabilities of unsafe behaviors in the four types of accidents.
4.2. The conditional probabilities of unsafe behaviors leading to accidents
IBM SPSS Modeler 14.2 (IBM, Armonk, NY, USA) is used to build the BN model and to calculate the conditional probabilities that specific unsafe behaviors will lead to accidents. This software package is widely used, and its Bayesian modeling function has advantages in parameter learning. In the process of building the BN model, one unsafe behavior node is the output variable, and the remaining unsafe behaviors are input variables. The conditional probability distributions of different types of accidents caused by unsafe behaviors can then be obtained.
First, Microsoft Excel 2007 (Microsoft, Redmond, Washington, USA) is used to create an input file with 287 rows (accident cases) and 37 columns (unsafe behaviors). As shown in , if an unsafe behavior occurs in association with an accident, the behavior is marked “Yes” in a row; otherwise, it is marked “No”. Second, the structural and parameter learning method of BN is designed. Two types of BN structures can be selected in the software package: tree-augmented native (TAN) and Markov blanket. In addition, there are two options for parameter learning methods: maximum likelihood and Bayesian adjustment for small cell counts. The contributions of all unsafe behaviors to accidents can be considered in the first BN structure (TAN). Moreover, the second parameter learning method (Bayesian adjustment for small cell counts) can be used to modify the prior probabilities of unsafe behaviors. In this way, more reasonable results can be obtained for behaviors with fewer occurrences and uneven distributions in the original data sample. Therefore, the TAN structure and the Bayesian adjustment method for small cell counts are selected. Ultimately, the file is input into the software package, and root nodes are identified to generate different BN structures. Taking unsafe behavior 2 as the root node as an example, the visualization of the BN is shown in .
Figure 5. The structure of the BN topologies with unsafe behavior 2 as the output variable.
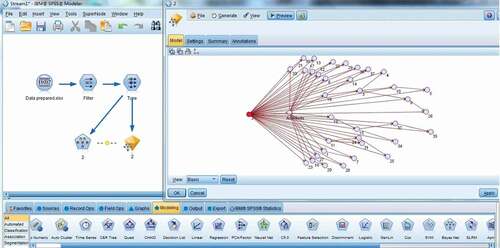
Table 2. Input file for BN
The structure of the BN topologies is obtained when the 37 unsafe behaviors are all determined as output variables, and the conditional probability table (CPT) of accident nodes is generated under different unsafe behavior nodes. However, the JPDs of each node are the same regardless of which unsafe behavior is the output variable. The CPT of the 37 unsafe behaviors causing the four types of accidents is obtained by the BN model; partial data are shown in . From a theoretical perspective, the sum of the conditional probability distributions from unsafe behaviors to accidents is 1 and cannot be 0. However, the table shows that the sum of the probability distributions is not 1. In addition, when unsafe behavior 12 occurs, the calculated result of the conditional probability of accident type S is 0. This issue will not affect the research results since it is caused by the rounding of the calculation results by the software.
Table 3. CPT showing partial data for the 37 unsafe behaviors leading to the four types of accidents
4.3. Behavioral risk level identification
The traditional RM included 4 × 4, 5 × 5 and other types (Peeters and Peng Citation2015); the probability and the potential consequences were usually divided into five levels, but the risk was divided into only three levels, high, medium and low (e.g., Afenyo et al. Citation2017; Luo, Wu, and Duan Citation2018). Some studies have added extra risk levels to reduce the vagueness of RM to a certain extent (Isaac and Edrei Citation2016). According to the aforementioned calculation results, the value interval of initial probability P1 is [0, 0.52], and the value interval of conditional probability P2 of accidents caused by unsafe behaviors is (0, 1). P1 and P2 are then divided into equal intervals to identify the five levels of Lik and Sik (e.g., Cox Citation2008), as shown in . However, the identification of three risk levels is not useful for further analysis since the impact of some unsafe behaviors could hardly be revealed. Therefore, the structure of MRM is determined as 5 × 5, and the behavioral risk levels are divided into four categories, as shown in .
Figure 6. MRM for determining behavioral risk levels.
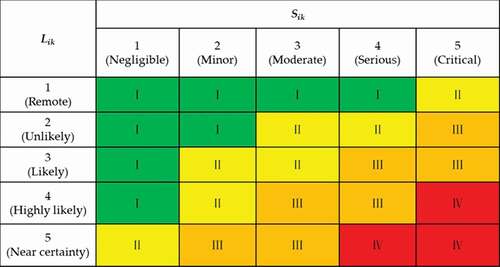
Table 4. Levels of Lik and Sik.
The MRM method identifies the risk levels Rik of the unsafe behaviors with respect to the four accident types, as shown in . Most unsafe behaviors are risk level I, but some behaviors have high risk levels, especially those with risk levels III and IV. Among them, the unsafe behaviors with risk level IV of causing falling accidents are 12 (failing to use all personal protective equipment) and 11 (implementing inadequate protection measures for holes or borders). According to the Work Safety Law of the People’s Republic of China (NPC Citation2014) and Training and Appraisal of Safety Technologies for Special Operation Personnel (State Administration of Work Safety Citation2010), since working at heights is a specialized operation, workers should obtain permits and apply PPE (e.g., safety belt, safety helmet and safety shoes) before starting work. In addition, falling accidents are easily caused by inadequate protection measures on site (e.g., holes and borders). For collapse accidents, the unsafe behavior with risk level IV is 17 (installing or dismantling formwork support systems without following the recommended procedures). Support system instability caused by this unsafe behavior is a critical cause of collapse during building construction. There are no unsafe behaviors with risk level III or IV associated with struck-by accidents. The unsafe behaviors with risk level II are 2 (entering dangerous areas), 27 (issuing improper commands), 1 (remaining in unsafe areas) and 6 (operating machines and equipment without following the recommended procedures); these behaviors should be given more attention than others. In regard to lifting accidents, the unsafe behaviors with risk level III are 18 (installing or dismantling machines and equipment without following the recommended procedures) and 6 (operating machines and equipment without following the recommended procedures). Because lifting tasks involve multiple man-machine operations, requiring workers to obey the operating procedures is the key to controlling behavioral risk. Compared with the results shown in , there are some differences. For instance, unsafe behavior 14 (engaging in specialized operation without a permit) has the highest initial probability in strike-by accidents. However, it is not included in the unsafe behaviors specified as risk level II in . This indicates that MRM considers the consequences of behavioral risk by integrating with BN. Furthermore, it can be seen that the MRM method dynamically evaluates the impact of behavioral risk on different types of accidents. For instance, the risk level of unsafe behavior 12 (failing to use all personal protective equipment) is IV in accidents involving falls, but it is I in accidents involving collapse.
Table 5. Behavioral risk levels for the four accident types
4.4. The rationality test of behavioral risk levels
The rationality of behavioral risk levels is tested by a sensitivity analysis of BN. This analysis aims to identify critical factors for target events among numerous uncertain factors. The impact of the unsafe behaviors on the four types of accidents is identified by analyzing the sensitivity of the accident node. Mutual information (MI) is often used as a generalized correlation measure that demonstrates the amount of information that two variables share with each other. By comparing the MI between the accident node and the unsafe behavior nodes in the BN model, the sensitivity of the unsafe behavior nodes to the accident node can be determined. In addition, the method has an overall view; that is, when the sensitivity of a single node is assessed, the impact of other related nodes is taken into consideration (Wang et al. Citation2011). In BN, the MI of a single node can be identified by its prior probability, its posterior probability and the probability connection between other nodes (Wu et al. Citation2014). The higher the MI of an unsafe behavior node is, the stronger is its impact on the accident node. Therefore, unsafe behaviors with higher MI should receive more attention for accident prevention. As another widely used BN software package, Netica 5.18 (Norsys Software Corp., Vancouver, Canada) is selected to conduct a sensitivity analysis using MI function. The results are shown in . The top 5 unsafe behavior nodes ranked by MI are 17, 12, 6, 11 and 27, suggesting that the impact of these unsafe behaviors on the four types of accidents is strong. Similar to the behavioral risk levels determined in , these unsafe behaviors are also associated with high risk of the four types of accidents. Thus, the rationality of the behavioral risk levels is tested.
Table 6. MI of partial unsafe behavior nodes
5. Discussion
The construction industry is one of the most dangerous industries, and unsafe behavior is regarded as a critical factor causing accidents. In determining behavioral risk levels, the traditional RM method has the deficiency of subjectivity in quantifying the probabilities and consequences of risk. Therefore, this paper proposed an MRM method in which the conditional probabilities that specific unsafe behaviors will lead to accidents were analyzed from historical accident cases through BN as a means of evaluating the consequences of behavioral risk. Taking behavioral risk evaluation in Chinese building construction as a case study, the behavioral risk levels of four types of accidents (F, C, S and L) were determined via the MRM method. Furthermore, the rationality and effectiveness of the MRM method were tested through MI. The two main contributions of this study are as follows:
This study improves the RM method. The RM method is a typical semiquantitative assessment tool (Ni, Chen, and Chen Citation2010) that subjectively determines risk probabilities and consequences based on expert experience, thus inevitably affecting the objectivity of the evaluation results. The overall risk category (risk score) obtained with a traditional method by categorizing the frequency and severity of consequences is imprecise and vague, and this produces significant uncertainties concerning the risk category (Markowski and Mannan Citation2008). To overcome the limitations of the traditional RM method, fuzzy logic ideas were used to quantify two parameters, likelihood and severity, in the matrix (e.g., Gul and Ak Citation2018). The Borda index was also introduced into the RM method to improve the precision of safety risk classification (e.g., Zhang et al. Citation2018). Additionally, risk assessors should receive in-depth training in the design and use of risk matrices (Peace Citation2017). Moreover, some studies determined the probability or consequence of risk based on BNs and then constructed a risk matrix (e.g., Zhang, Zhang, and Bai Citation2017). In this study, the initial probabilities are calculated from historical accident data based on the frequency of unsafe behaviors. More importantly, through the conditional probabilities that unsafe behaviors will lead to accidents in the BN model, the consequences of behavioral risk are determined. Like the aforementioned studies, this study improves the subjectivity of the traditional RM method. However, compared to studies in which the probability or consequence of nodes in BNs was identified by expert judgment, this study is more objective in determining the initial probabilities and consequences of behavioral risk.
Unsafe behaviors with a great impact on the four types of accidents are identified. Via the MRM method, this paper determines the behavioral risk levels for various accident types, especially falling and collapse accidents; these risk levels include level IV behavioral risk, which should be addressed. Unsafe behaviors 12 (failing to use all personal protective equipment) and 11 (implementing inadequate protection measures for holes or borders), which can lead to falling accidents, are high risk when working at heights, and this has also been proven in other studies. Zhang and Fu (Citation2017) found that working without a safety belt, without a safety helmet or without either led to 51% of 56 accidents and that 21% of these 56 accidents had causal factors related to inadequate safety protection. On the list of behavioral risk levels for collapse accidents, unsafe behavior 17 (installing or dismantling formwork support systems without following the recommended procedures) is high risk. By analyzing fatal accidents in Chinese construction, Shao et al. (Citation2019) found that the supporting systems used in various construction activities can contribute to falling accidents due to their temporary and transitory nature. In addition, the same behavioral risks contribute differently to different types of accidents. For instance, unsafe behavior 6 (operating machines and equipment without following the recommended procedures) contributes more to lifting accidents than to other types of accidents, especially mechanical damage and lifting damage, which are usually caused by improper operation under insufficient light (Amiri et al. Citation2016). Determining the behavioral risk levels for different types of accidents is conducive to generating strategies for controlling unsafe behaviors in different phases and areas during construction and for achieving lean risk management. Therefore, this study bridges the gap created by the fact that existing studies (e.g., Zhang and Fu Citation2017) have mainly explored the impact of specific behavioral risks on certain types of accidents but have ignored their impact on different types of accidents.
Through the aforementioned contributions, BN can provide solutions for quantitatively evaluating the consequences of behavioral risk. In addition, the MRM method can distinguish the impact of specific behavioral risks on different types of accidents. Therefore, the proposed research hypotheses are verified. Despite these potential benefits, this method also has weaknesses. The amount of data used in the analysis affects the results of behavioral risk evaluation. However, the databases available on the government websites are not complete. Some regions have no databases on construction accidents, and some accidents are recorded without detailed reports. Thus, the amount of data is relatively small, and the accuracy of the determined behavioral risk level should be further improved. Future studies will consider obtaining historical accident data from additional sources, such as interviews with government departments and construction companies. Historical accident data for other construction types (e.g., highway, railway and bridge construction) will also be analyzed. Moreover, the MRM method will be applied to the evaluation of behavioral risks at construction sites to further verify its effectiveness.
6. Conclusion
Unsafe behavior is a critical factor in safety risk management in construction. Based on historical accident data on Chinese building construction, this paper determined behavioral risk probabilities through the initial probabilities of unsafe behaviors and determined behavioral risk consequences through conditional probabilities of unsafe behaviors that lead to accidents in BN. The proposed MRM method addressed the issue of subjectivity in the traditional RM method. The results identified the behavioral risk levels for four types of accidents (F, C, S and L) and thus explored the impact of unsafe behaviors on these different types of accidents.
With regard to theoretical aspects, the RM method was improved. Through probabilistic reasoning of BN, the conditional probabilities of unsafe behaviors leading to accidents were obtained from historical accident data and used to determine the consequences of behavioral risk to make the identification of behavioral risk levels more objective. The MRM method provides new thinking that transforms the RM method from a qualitative method into a quantitative method. Moreover, this study explored dynamic behavioral risk level identification for different types of accidents. The occurrence of different types of accidents is affected by different unsafe behaviors. The same unsafe behaviors have different impacts on different types of accidents. The probability connections between unsafe behavior nodes and accident nodes in BN reflect the impact of behavioral risk on different types of accidents, thus addressing a disadvantage of the traditional RM method, the fact that it does not consider the different consequences of risk events. With regard to practical aspects, lean management of behavioral risk on construction sites was enhanced. According to the Pareto principle, controlling unsafe behaviors that have a great impact on accidents can effectively prevent accidents. The research findings presented in this work evaluated the behavioral risk levels associated with four types of accidents and identified unsafe behaviors that have a significant impact on certain types of accidents. For instance, unsafe behaviors 12 and 11 in falling accidents and unsafe behavior 17 in collapse accidents carry the highest risk levels. These behaviors should be given increased attention and should be critically monitored and controlled by managers/engineers on sites. Managers/engineers could develop behavioral risk control strategies in construction areas in which different types of accidents occur frequently to improve risk management. To control unsafe behavior 12, safety knowledge education and training should be administered before workers enter the construction work area, and managers/engineers should strictly monitor the use of PPE. During construction, managers/engineers should check whether or not workers wear all PPE either by on-site inspection or by video surveillance. Similarly, since unsafe behavior 17 has a high risk of leading to collapse accidents, safety inspections should be strengthened in areas in which formwork is installed or dismantled. In addition, the same behavioral risk has different impacts on different types of accidents. For example, because unsafe behavior 11 makes a greater contribution to falling accidents than do the other behaviors, measures to prevent this behavioral risk should focus on when and where accidents involving falls frequently occur. With the generation and reuse of construction data in the future, the MRM method has great potential for wide application in evaluating more risk factors.
Disclosure statement
No potential conflict of interest was reported by the author(s).
Additional information
Funding
References
- Abul-Haggag, O. Y., and W. Barakat. 2013. “Application of Fuzzy Logic for Risk Assessment Using Risk Matrix.” International Journal of Emerging Technology and Advanced Engineering 3 (1): 49–54.
- Afenyo, M., F. Khan, B. Veitch, and M. Yang. 2017. “Arctic Shipping Accident Scenario Analysis Using Bayesian Network Approach.” Ocean Engineering 133: 224–230. doi:https://doi.org/10.1016/j.oceaneng.2017.02.002.
- Amiri, M., A. Ardeshir, M. H. Fazel Zarandi, and E. Soltanaghaei. 2016. “Pattern Extraction for High-risk Accidents in the Construction Industry: A Data-mining Approach.” International Journal of Injury Control and Safety Promotion 23 (3): 264–276. doi:https://doi.org/10.1080/17457300.2015.1032979.
- Bai, X.-P., and Y.-H. Zhao. 2020. “A Novel Method for Occupational Safety Risk Analysis of High-altitude Fall Accident in Architecture Construction Engineering.” Journal of Asian Architecture and Building Engineering 1–12. doi:https://doi.org/10.1080/13467581.2020.1796675.
- Bartlett, M., and J. Cussens. 2017. “Integer Linear Programming for the Bayesian Network Structure Learning Problem.” Artificial Intelligence 244: 258–271. doi:https://doi.org/10.1016/j.artint.2015.03.003.
- Chen, Z., G. Qiao, and J. Zeng. 2019. “Study on the Relationship between Worker States and Unsafe Behaviours in Coal Mine Accidents Based on a Bayesian Networks Model.” Sustainability 11 (18): 5021. doi:https://doi.org/10.3390/su11185021.
- Cheng, C.-W., -S.-S. Leu, -C.-C. Lin, and C. Fan. 2010. “Characteristic Analysis of Occupational Accidents at Small Construction Enterprises.” Safety Science 48 (6): 698–707. doi:https://doi.org/10.1016/j.ssci.2010.02.001.
- Cox, L. A. 2008. “What’s Wrong with Risk Matrices?” Risk Analysis: An International Journal 28 (2): 497–512. doi:https://doi.org/10.1111/j.1539-6924.2008.01030.x.
- Duan, Y., J. Zhao, J. Chen, and G. Bai. 2016. “A Risk Matrix Analysis Method Based on Potential Risk Influence: A Case Study on Cryogenic Liquid Hydrogen Filling System.” Process Safety and Environmental Protection 102: 277–287. doi:https://doi.org/10.1016/j.psep.2016.03.022.
- Fung, I. W., V. W. Tam, T. Y. Lo, and L. L. Lu. 2010. “Developing a Risk Assessment Model for Construction Safety.” International Journal of Project Management 28 (6): 593–600. doi:https://doi.org/10.1016/j.ijproman.2009.09.006.
- Garvey, P. R., and Z. F. Lansdowne. 1998. “Risk Matrix: An Approach for Identifying, Assessing, and Ranking Program Risks.” Air Force Journal of Logistics 22 (1): 18–21.
- GB 50278–2010. 2010. “Code for Construction and Acceptance of Crane Installation Engineering.” Beijing, China: China Machinery Industry Federation (CMIF).
- GB 6441–1986. 1986. “The Classification Standerd for the Casualty Accidents of Enterprise Staff and Worlkers.” Beijing, China: Standardization Administration.
- Ghasemi, F., O. Kalatpour, A. Moghimbeigi, and I. Mohammadfam. 2017. “Selecting Strategies to Reduce High-risk Unsafe Work Behaviors Using the Safety Behavior Sampling Technique and Bayesian Network Analysis.” Journal of Research in Health Sciences 17 (1): 372.
- Gul, M., and M. F. Ak. 2018. “A Comparative Outline for Quantifying Risk Ratings in Occupational Health and Safety Risk Assessment.” Journal of Cleaner Production 196: 653–664. doi:https://doi.org/10.1016/j.jclepro.2018.06.106.
- Haslam, R. A., S. A. Hide, A. G. Gibb, D. E. Gyi, T. Pavitt, S. Atkinson, and A. R. Duff. 2005. “Contributing Factors in Construction Accidents.” Applied Ergonomics 36 (4): 401–415. doi:https://doi.org/10.1016/j.apergo.2004.12.002.
- HSE. 2019. “Health and Safety Statistics for the Construction Sector in Great Britain.” Health and Safety Executive. http://www.hse.gov.uk/statistics/fatals.htm
- Isaac, S., and T. Edrei. 2016. “A Statistical Model for Dynamic Safety Risk Control on Construction Sites.” Automation in Construction 63: 66–78. doi:https://doi.org/10.1016/j.autcon.2015.12.006.
- ISO. 2018. Risk management–Guidelines. Geneva, Switzerland: International Organization for Standardization.
- JGJ 80–2016. 2016. “Technical Code for Safety of Working at Height of Building Construction” Beijing, China: Ministry of Housing and Urban-Rural Development of the People’s Republic of China (MOHURD).
- Jiang, G., H. Lv, and L. Liu. 2016. “Process Safety Evaluation Model Based on LEC and Grey Theory.” Journal of Mechanical Engineering Research and Developments 39 (1): 24–29.
- Ko, Y., and S. Han. 2015. “Development of Construction Performance Monitoring Methodology Using the Bayesian Probabilistic Approach.” Journal of Asian Architecture and Building Engineering 14 (1): 73–80. doi:https://doi.org/10.3130/jaabe.14.73.
- Li, H., M. Lu, S.-C. Hsu, M. Gray, and T. Huang. 2015. “Proactive Behavior-based Safety Management for Construction Safety Improvement.” Safety Science 75: 107–117. doi:https://doi.org/10.1016/j.ssci.2015.01.013.
- Li, W., Y. Ye, Q. Wang, X. Wang, and N. Hu. 2020. “Fuzzy Risk Prediction of Roof Fall and Rib Spalling: Based on FFTA–DFCE and Risk Matrix Methods.” Environmental Science and Pollution Research 27(8): 8535–8547.
- Lopes, D., M. Oliveira, and C. B. e Costa. 2015. “Occupational Health and Safety: Designing and Building with MACBETH a Value Risk-matrix for Evaluating Health and Safety Risks.” In Journal of Physics: Conference Series (Vol. 616, No. 1, p. 012010). IOP Publishing. Mini EURO Conference on Improving Healthcare: new challenges, new approaches 30 March to 1 April 2015, Coimbra, Portugal
- Lu, L., W. Liang, L. Zhang, H. Zhang, Z. Lu, and J. Shan. 2015. “A Comprehensive Risk Evaluation Method for Natural Gas Pipelines by Combining A Risk Matrix with A Bow-tie Model.” Journal of Natural Gas Science and Engineering 25: 124–133. doi:https://doi.org/10.1016/j.jngse.2015.04.029.
- Luo, T., C. Wu, and L. Duan. 2018. “Fishbone Diagram and Risk Matrix Analysis Method and Its Application in Safety Assessment of Natural Gas Spherical Tank.” Journal of Cleaner Production 174: 296–304. doi:https://doi.org/10.1016/j.jclepro.2017.10.334.
- Ma, Z., H.-Y. Chong, and P.-C. Liao. 2019. “Development of a Time-variant Causal Model of Human Error in Construction with Dynamic Bayesian Network.” Engineering, Construction and Architectural Management 28: 291–307. doi:https://doi.org/10.1108/ECAM-03-2019-0130.
- Markowski, A. S., and M. S. Mannan. 2008. “Fuzzy Risk Matrix.” Journal of Hazardous Materials 159 (1): 152–157. doi:https://doi.org/10.1016/j.jhazmat.2008.03.055.
- MHLW. 2019. “The Statistical Data of Accidents and Injuries in the Workforce.” Ministry of Health Labour and Welfare in Japan. https://www.mhlw.go.jp/bunya/roudoukijun/anzeneisei11/rousai-hassei/index.html
- Ministry of Emergency Management. 2018. “Report on the Safety Situation of the Chinese Construction Industry in the First Half of 2018.” Ministry of Emergency Management of the People’s Republic of China. https://www.mem.gov.cn/gk/tzgg/tb/201807/t20180725_230568.shtml
- Mirzaei Aliabadi, M., H. Aghaei, O. Kalatpour, A. R. Soltanian, and A. Nikravesh. 2018. “Analysis of Human and Organizational Factors that Influence Mining Accidents Based on Bayesian Network.” International Journal of Occupational Safety and Ergonomics 26(4): 670-677.
- Mohammadfam, I., F. Ghasemi, O. Kalatpour, and A. Moghimbeigi. 2017. “Constructing a Bayesian Network Model for Improving Safety Behavior of Employees at Workplaces.” Applied Ergonomics 58: 35–47. doi:https://doi.org/10.1016/j.apergo.2016.05.006.
- MOHURD. 2019. “Notification of Production Safety Accidents in Housing and Municipal Construction.” Ministry of Housing and Urban-Rural Development of the People’s Republic of China. http://www.mohurd.gov.cn/zlaq/zlaqzcfb/index.html
- Naghavi-Konjin, Z., S.-B. Mortazavi, H. Asilian-Mahabadi, and E. Hajizadeh. 2020. “Ranking the Occupational Incident Contributory Factors: A Bayesian Network Model for the Petroleum Industry.” Process Safety and Environmental Protection 137: 352–357. doi:https://doi.org/10.1016/j.psep.2020.01.038.
- Ni, H., A. Chen, and N. Chen. 2010. “Some Extensions on Risk Matrix Approach.” Safety Science 48 (10): 1269–1278. doi:https://doi.org/10.1016/j.ssci.2010.04.005.
- NPC. 2014. Work Safety Law of the People’s Republic of China. Beijing, China: National People’s Congress (NPC).
- Peace, C. 2017. “The Risk Matrix: Uncertain Results?” Policy and Practice in Health and Safety 15 (2): 131–144. doi:https://doi.org/10.1080/14773996.2017.1348571.
- Pearl, J. 1988. Probabilistic Reasoning in Intelligent Systems: Networks of Plausible Inference. Ëan Mateo, California: Morgan Kaufmann.
- Peeters, W., and Z. Peng. 2015. “An Approach Towards Global Standardization of the Risk Matrix.” Journal of Space Safety Engineering 2 (1): 31–38. doi:https://doi.org/10.1016/S2468-8967(16)30037-4.
- Ruan, X., Z. Yin, and D. M. Frangopol. 2015. “Risk Matrix Integrating Risk Attitudes Based on Utility Theory.” Risk Analysis 35 (8): 1437–1447. doi:https://doi.org/10.1111/risa.12400.
- Safe Work Australia. 2020. “Work-related Traumatic Injury Fatality Time Series.” Safe Work Australia. https://www.safeworkaustralia.gov.au/doc/work-related-traumatic-injury-fatality-time-series
- Seo, D., S. Shin, and B. Han. 2010. “Reliability-based Structural Safety Evaluation of Reinforced Concrete Members.” Journal of Asian Architecture and Building Engineering 9 (2): 471–478. doi:https://doi.org/10.3130/jaabe.9.471.
- Shao, B., Z. Hu, Q. Liu, S. Chen, and W. He. 2019. “Fatal Accident Patterns of Building Construction Activities in China.” Safety Science 111: 253–263. doi:https://doi.org/10.1016/j.ssci.2018.07.019.
- Sousa, V., N. M. Almeida, and L. A. Dias. 2014. “Risk-based Management of Occupational Safety and Health in the Construction industry–Part 1: Background Knowledge.” Safety Science 66: 75–86. doi:https://doi.org/10.1016/j.ssci.2014.02.008.
- State Administration of Work Safety. 2010. Training and Appraisal of Safety Technologies for Special Operation Personnel. Beijing, China: State Administration of Work Safety.
- Sun, J.-W., K.-H. Park, and M.-J. Lee. 2017. “A Multi-Level Asset Management Decision Method considering the Risk and Value of Bridges.” Journal of Asian Architecture and Building Engineering 16 (1): 163–170. doi:https://doi.org/10.3130/jaabe.16.163.
- Wang, Y. F., M. Xie, K. M. Ng, and M. S. Habibullah. 2011. “Probability Analysis of Offshore Fire by Incorporating Human and Organizational Factor.” Ocean Engineering 38 (17): 2042–2055. doi:https://doi.org/10.1016/j.oceaneng.2011.09.009.
- Wang, Z. Z., and C. Chen. 2017. “Fuzzy Comprehensive Bayesian Network-based Safety Risk Assessment for Metro Construction Projects.” Tunnelling and Underground Space Technology 70: 330–342. doi:https://doi.org/10.1016/j.tust.2017.09.012.
- Wu, X., B. Ding, L. Zhang, Y. Chen, L. Xue, and R. Song. 2014. “Research on Risk Management of Subway Construction Based on Bayesian Network.” China Safety Science Journal 24 (1): 84–89.
- Wu, X., H. Liu, L. Zhang, M. J. Skibniewski, Q. Deng, and J. Teng. 2015. “A Dynamic Bayesian Network Based Approach to Safety Decision Support in Tunnel Construction.” Reliability Engineering & System Safety 134: 157–168. doi:https://doi.org/10.1016/j.ress.2014.10.021.
- Yang, X., T. Yan, Z. Ni, and J. Dong. 2012. “Analysis and Countermeasures on the Risks in the Construction of Wuhan Subway River-crossing Tunnel.” Safety and Environmental Engineering 19 (3): 107–110.
- Yin, R. K. 2017. Case Study Research and Applications: Design and Methods. 2455 Teller Road Thousand Oaks, California 91320: Sage publications.
- Youli, Y., P. Yingjian, and L. Xiaoxia. 2018. “Research on Safety Risk Management of Civil Construction Projects Based on Risk Matrix Method.” In IOP Conference Series: Materials Science and Engineering, 062080. Zhuhai, China: IOP Publishing.
- Zhang, H., and G. Fu. 2017. “Analysis on Human Unsafe Acts Contributing to Falling Accidents in Construction Industry.” In International Conference on Applied Human Factors and Ergonomics, 178–185. The Westin Bonaventure Hotel, Los Angeles, California, USA: Springer.
- Zhang, J., W. Zhang, P. Xu, and N. Chen. 2019. “Applicability of Accident Analysis Methods to Chinese Construction Accidents.” Journal of Safety Research 68: 187–196. doi:https://doi.org/10.1016/j.jsr.2018.11.006.
- Zhang, N., Z. Zhang, Z. Rui, J. Li, C. Zhang, Q. Zhang, W. Zhao, and S. Patil. 2018. “Comprehensive Risk Assessment of High Sulfur-containing Gas Well.” Journal of Petroleum Science and Engineering 170: 888–897. doi:https://doi.org/10.1016/j.petrol.2018.07.016.
- Zhang, X., X. Zhang, and Y. Bai. 2017. “Risk Management Method Based on Bayesian Network-Risk Matrix–Dynamic Risk Management of Excavation Project of Existing Buildings.” Safety and Environmental Engineering 24 (6): 176–183.