
 ?Mathematical formulae have been encoded as MathML and are displayed in this HTML version using MathJax in order to improve their display. Uncheck the box to turn MathJax off. This feature requires Javascript. Click on a formula to zoom.
ABSTRACT
This is a proposal for a nonlinear analytical model that was developed to predict the structural response of post-tensioned beam with unbonded tendon. The structural response includes deflections under the service load before or after cracking, as well as the ultimate load capacity. A comprehensive procedure for the deflection calculation was implemented, considering the additional shear deformation and tension stiffening effect. The shear deformation calculation is based on the Timoshenko beam theory, considering the shear modulus reduction upon cracking. Furthermore, a modification of the tension stiffening model from CEB–FIP Model Code 1990 is proposed to account for the significant strain concentration in the post-yielding region. A fixed-point iterative procedure is introduced in the prediction model to compute the incremental strain in the unbonded tendon. Each iteration brings the estimated strain increase in the tendon closer to the actual value until it is reasonably accurate. Predictive accuracy of the proposed model in both load–deflection relationships and strain rates, as a function of deflections, is successfully validated against experimental beam tests and a nonlinear finite element analysis considering concrete plasticity, respectively.
Graphical Abstract

1. Introduction
Unlike the bonded post-tensioned beam, primarily analyzed based on a simple sectional analysis, the unbonded post-tensioned beam depends on the member performance, rather than section analysis, because the bond mechanism between the tendon and the surrounding concrete is no longer valid. The increasing strain of the unbonded tendon should be investigated by averaging the change in the length of the concrete adjacent to the tendon between the end anchorages. Therefore, the overall beam deformation becomes necessary and should be conducted in both elastic uncracked/cracked and plastic regions to consider the contribution of tendon elongation to the structure performance at every load stage.
Numerous studies on the unbonded prestressed beam have been performed over the decades to explore structural performance in both serviceability and ultimate limit state. For example, Joseph Warwaruk, Sozen, and Siess (Citation1962) conducted experimental tests with various major variables of the reinforcement amount, concrete strength, effective stress, and loading patterns to evaluate the deformation and the flexural strength of the unbonded post-tensioned beam. Especially, concept of mean concrete strain was introduced to calculate ultimate increasing strain of the unbonded tendon and determine its ultimate strength capacity. Chakrabarti (Citation1995), and Tao and Du (Citation1985) developed an empirical equation to predict the ultimate stress in unbonded tendons and represented the effect of bonded steel on unbonded beam’s performance. However, it can only be appropriate to estimate the ultimate strength of the unbonded post-tensioned beam, but it is challenging to apply in the service load. Meanwhile, Balaguru (Citation1981), Harajli and Kanj (Citation1992), Harajli, Khairallah, and Nassif (Citation1999), and more recently by Au, Du, and Cheung (Citation2005) proposed flexural behavior models, including the service load behavior before and after cracking, yielding state, and ultimate state. Vu, Castel, and François (Citation2010) introduced an analytical model for calculating both the overall elongation of the unbonded tendon and incremental deflection from cracking to fracturing based on non-linear macro-finite element method.
Despite the considerable number of studies on the relationship between the increasing strain of the unbonded tendon versus various factors (e.g., span-to-depth ratio, loading type, and section configuration), studies considering the effect of the shear deformation and the tension stiffening on the overall elongation of the unbonded tendon are still lacking. This study provides a nonlinear analytical model to calculate the structural performance of the prestressed beams with unbonded tendons considering the effects of tension stiffening and transverse shear deformation. The tension stiffening effect is the result of the bond mechanism between the reinforcement and the concrete, which notably increases the beam’s bending stiffness in both elastic crack and post-yielding regions. The authors propose a tension stiffening model developed from the CEB–FIP Model Code 1990 to predict the post-yielding deflection. The deflection due to shear is added based on the Timoshenko beam formula considering the shear modulus reduction caused by the crack, according to Rahal (Citation2010). The analytical model proposed herein can be applied to all loading stages from before the cracking to the ultimate fracture. The strain evolution in terms of material strain versus beam deformation was investigated to evaluate the member strain activation from the application of applied load to fracture caused by concrete crushing. The deflection ductility, based on the equivalent elastro-plastic yield and limiting concrete compressive strain, was also evaluated. The proposed analytical model was implemented in MATLAB. Its predictive accuracy was validated against both existing test results performed by Joseph Warwaruk, Sozen, and Siess (Citation1962), Hussien et al. (Citation2012), Harajli (Citation1990), Tao and Du (Citation1985) and a nonlinear finite element analysis considering concrete plasticity.
2. Analytical model
2.1. Material constitutive laws
This study used a parabola–rectangle stress–strain model for the concrete compression part, following Eurocode 2 (Citation2004). The behavior of the concrete in tension was assumed as linear elastic as illustrated in .
Figure 1. Behavior of the concrete in tension and compression.
For the concrete in tension, the stress can be computed based on EquationEquation (1)(1)
(1) .
For the concrete in compression, the stress–strain relationship is composed of two phrases:
The bilinear stress–strain relationship illustrated in was used for both prestressing and non-prestressing steel.
Figure 2. Bilinear stress–strain diagram for both prestressing and non-prestressing steel.
2.2. Sectional flexure analysis
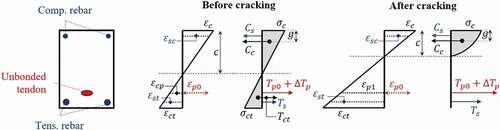
describes the stress–strain distribution of the cross-section before and after cracking, ignoring the concrete’s tensile strength after cracking. The tensile force, , induced by unbonded tendon, increases in proportion to the average strain of the adjacent concrete over the tendon length, regardless of how the cross-section behaves under a specific internal force. After the function of the unbonded tendon’s strain evolution is determined, as discussed in Section 2.5, a sectional analysis can be performed, similar to that in the reinforced concrete section, as well as in the bonded prestressed concrete beam.
Figure 3. Stress–strain distribution of the cross-section before and after cracking.
The compression force of concrete, , in a given concrete compression strain at the extreme top fiber,
, can be achieved by integrating the concrete stress,
, distributed over the compression zone that follows concrete stress–strain relationship.
where is the compressive strain at the extreme-compression fiber;
is the width of the considered section;
is the distance from the extreme top fiber to the point corresponding to the concrete stress level; and
is the neutral axis depth. The distance from the extreme concrete compression fiber to the line of action of the concrete compression force is expressed as EquationEquation (5)
(5)
(5) :
In uncracked region, contribution of concrete in tension zone is significant and should be considered in the section analysis. However, the concrete tensile force is neglected once a crack occurs. The contribution of both compression and tension rebars to the sectional force equilibrium can be computed based on the strain compatibility theory. In contrast, the tendon force is divided into two parts: the initial jacking force ( and increasing force (
) induced by the overall elongation of the unbonded tendon.
The neutral axis depth, , is the only unknown computed based on the equilibrium condition using the trial-and-error method as illustrated in .
Figure 4. Trial-and-error procedure for the section analysis.
2.3. Tension stiffening
When tensile stress of the concrete at the extreme fiber exceeded the mean tensile strength, , cracks occurred and led to the decrease of the tensile stress of concrete to zero. However, the concrete between cracks still captivated the tensile stresses because of the bond mechanism, which notably affected the beam deflection and crack formation. This mechanism is known as tension stiffening. Various tension stiffening models have been developed to evaluate the tension stiffening effect, including those of CEB–FIP Model Code (Citation1990), Collins and Mitchell (Citation1987), Bentz (Citation2005), Stramandinoli and La Rovere (Citation2008), and Branson (Citation1968). These models can be generally categorized into three groups based on purpose: (1) modifying the constitutive relationship of the tensile concrete; (2) modifying the constitutive tensile reinforcement relationship; and (3) modifying the stiffness by using an average moment-curvature, section stiffness, or the member’s material strain. The first two models are popular in model tension stiffening in numerical analysis, while the third one (i.e., stiffness modification methods) is better known in analytical analysis. This study discusses some available stiffness modification methods specified in building standards and proposes a modification of the CEB–FIP tension stiffening model to consider acute strain concentration.
The Australian standard (AS3600-2009) based on Branson’s formula, considers tension stiffening by calculating the so-called effective stiffness between the fully cracked and uncracked stiffnesses. This approach only gives a reasonable prediction of the tension stiffening effect within the uncracked and elastic cracked region as shown in . All test specimen information is discussed details in section Section 3.1.
Figure 5. Comparison of the experimental mid-span deflection to the analytical model.
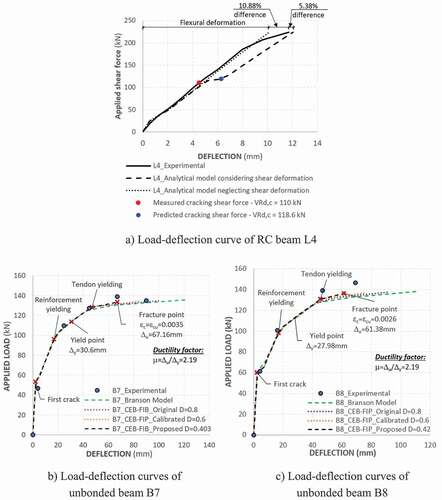
Figure 5. Continued
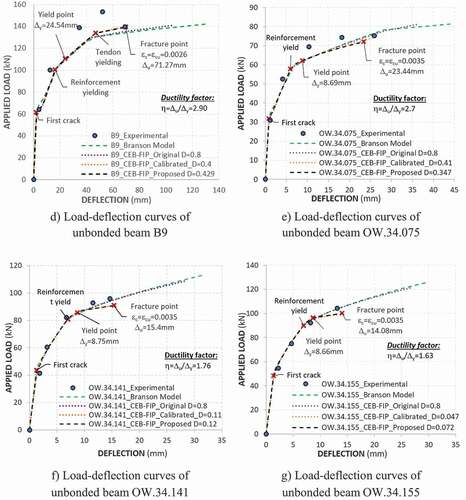
Figure 5. Continued.
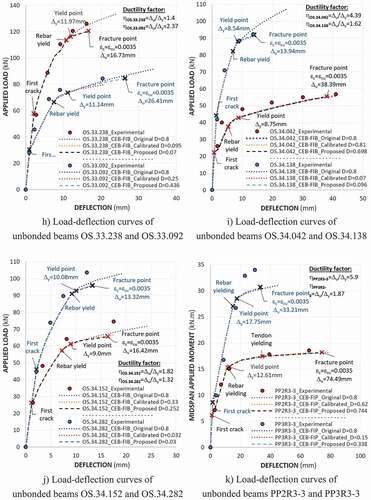
Figure 5. Continued.
The CEB–FIP model is proposed as a practical model to consider the tension stiffening effect in all load stages through a modification of the steel strain from the strain in the cracked region, , to the mean steel strain,
, which is the average element strain between two adjacent cracks. shows the typical element strain distribution between the adjacent cracks.
Figure 6. Typical element strain distribution between adjacent cracks (CEB–FIB Model Code Citation1990).
In the uncracked region, :
In the crack formation region, :
In the stabilized cracking region, :
In the post-yielding region, :
where for the short-term loading (pure tension);
for the long-term or repeated loading (pure tension); and
is the coefficient considered as the ratio of
and the yield stress
.
The application of original CEB–FIP tension stiffening model on the partially unbonded beam analysis gives a good prediction of tension stiffening effect on the load–deflection relation in both crack formation and stabilized cracking regions, except for the post-yielding region as shown in . According to Joseph Warwaruk, Sozen, and Siess (Citation1962), the “average” curvature of the unbonded beam section, obtained by the mean strain of the extreme concrete fiber or the mean reinforcement strain, was smaller than that derived for a bonded beam because of the relatively higher acute strain concentration. In the CEB–FIP Model Code (London: Thomas Telford Citation1990), the tension stiffening effect in the post-yielding region mostly considered the reinforcement properties represented by factor D However, the tensile stresses of both the concrete and the unbonded tendon also contribute to the post-yield tension stiffening behavior of the partially unbonded beam and reflect the effect of the strain concentration. Therefore, this study proposed a modification of factor D that considered not only the reinforcement properties but also the impact of the concrete and unbonded tendon tensile stresses to give a better prediction of the post-yielding stiffness. Calibrated values of D have been investigated to fit the analytical load–deflection curve with 15 existing beam tests ()). The proposed factor D was then developed based on natural exponential regression model accounting contribution of concrete tensile strength, reinforcement, and unbonded tendon
(10–1).
where is mean tensile strength of concrete;
, and
are the contents of the reinforcement and the unbonded tendon, respectively; and
, and
are the yielding strengths of the reinforcement and the unbonded tendon, respectively.
,
are curve fitting factors which describe the model most closely passes through the given data points measured by coefficient of determination –
.
,
are contribution factors of concrete and unbonded tendon, respectively, contributed to post-yielding stiffness in comparison with reinforcement. It is true that unique curve fitting factors,
and
, are found to obtain the highest value of
for each combination of
and
. tried various values of
and
to pick up optimal combination which regards to the best value of
. The optimal model was then presented details in and EquationEquation (10–2
(10-2)
(10-2) ).
Figure 7. Relationship between coefficient of determination – and contribution factors –
,
.
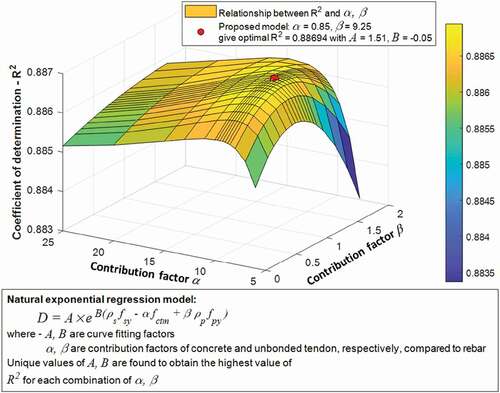
Figure 8. Proposed tension stiffening factor at post-yielding region for unbonded post-tensioned beam.
The increased deflection is proportional to the overall elongation of the unbonded tendon, which may significantly affect the unbonded beam’s final capacity. Therefore, the proposed coefficient is limited to 0.8 to conservatively control the increasing strain of the unbonded tendon because the strength capacity is more important than the deflection in the post-yielding region.
2.4. Effect of shear on deflection
This section proposes a method of computing the effect of shear on the beam deflection, followed by the overall elongation of the unbonded tendon. The stress displacement relations are given by EquationEquation (11)(11)
(11) according to the Timoshenko beam theory:
where is the total beam deflection;
is the flexure rotation;
is the shear rotation;
is the internal shear force;
is the shear modulus; and
is the section area. The shear correction coefficient,
, was introduced to represent the difference in the constant state of the shear stress in the Timoshenko beam theory and the actual stress through the beam depth. The
values for the sectional shape were discussed in various studies, including those of Gere and Timoshenko (Citation1991), Cowper (Citation1966), and Hutchinson (Citation2001), among others. Normally,
for a rectangular section. The shear modulus,
, was typically calculated based on the elastic theory. However, the post-cracking region recognizes a significant reduction in the shear modulus due to the loss in rigidity. Thus, calculating the shear modulus,
, can be performed following the three states of shear deformation behavior: uncracked, flexural cracked, and diagonal cracked.
In the uncracked state, where the concrete’s tensile stress at the extreme bottom fiber,, was smaller than the concrete mean tensile strength,
, the shear modulus,
, was calculated following the elastic theory:
where is the Young’s modulus, and
is the Poisson’s ratio of concrete.
In the flexural crack region , Paulay and Loeber (Citation1974) reported that both the flexural stiffness and the capacity of transferring the shear stress using the aggregate interlocking mechanism decreased. However, the flexural crack generally occurred from the tension fiber of the cross-section to the compression fiber, indicating that the concrete in the compression zone can be treated as uncracked with no shear reduction. Hence, a combination of the elastic shear modulus and the post-cracking shear modulus was used in the concrete compression and tension zones, as represented in EquationEquation (13)
(13)
(13) .
where is the effective shear modulus at the flexure cracked region;
is the post-cracking shear modulus in EquationEquation (14)
(14)
(14) ; and
is the neutral axis depth of the considered section.
Meanwhile, in the diagonal crack region, where the internal shear force, , exceeded the concrete shear capacity of the section following Eurocode 2 (Citation2004),
, the post-cracking shear modulus,
, was used throughout the section because the diagonal cracks are assumed to be smeared throughout the whole shear region. Rahal (Citation2010) suggested a simple empirical equation for calculating the post-cracking shear modulus in terms of the tangent slope of the shear stress–strain curve as shown in EquationEquation (14)
(14)
(14) . The equation seems to be a reliable approach for capturing the effect of the crack on the shear modulus.
where indices and
of the bending and shear reinforcement are computed as follows:
The upper limit for controlling over-reinforcement, , is given by EquationEquation (16)
(16)
(16) :
The flowchart in presents the detailed procedure for computing the effect of shear on deformation.
Figure 9. Procedure for the shear deformation computation.
Shear deformation was often negligible in most of slender beam with appearance of diagonal crack, such as beam specimen B7 performed by Hussien et al. (Citation2012). ) showed that beam specimen B7 reached to fracture point at applied shear force of 66.65 kN (total applied load of 133.3 kN), which was smaller than cracking shear foce of ; and hence, the influence of shear on deflection, in this case, was smaller than 2%. However, significant reduction in shear modulus after diagonal cracking should be recognized and accounted in deformation. Beam specimen L4 (Pan Z et al.), which is critical in shear, was used to verify the rationality of proposed shear deformation analysis. ) indicated that predicted cracking shear force of beam L4 is 110 kN, which was well agree with measured cracking shear force of 118.6 kN. With an applied shear force of 224 kN, the deflection was 10.38% different from test results if shear deformation was neglected, whereas the error decreased to 5.38% when shear deformation was consider as shown in ).
2.5. Calculation of the increasing strain of the unbonded tendon
The increasing strain of the unbonded tendon, , is assumed equal to the average change in the strain of the concrete adjacent to the tendon, which denotes that the concrete strain at every location can be computed based on the mean tension reinforcement strain and the concrete strain at the extreme top fiber following the strain compatibility relationship in EquationEquations (20
(20)
(20) ) and (Equation21
(21)
(21) ).
where is the concrete strain adjacent to the tendon at location
. Note that the mean reinforcement strain,
, and the concrete strain at the extreme top fiber,
, were computed based on the section analysis. According to the proposed procedure in , an increasing tendon strain,
, must be pre-assigned to solve the equilibrium equation. In other words, the increasing tendon strain,
, and the concrete strain at the same level,
, were functionally related to each other, which was difficult to solve. Therefore, this study proposed a computational procedure using the fixed-point iteration method to analyze the effect of tendon elongation. An initial guess of the increasing strain in the unbonded tendon,
, was generated to compute the new estimate
expressed by the iterative equation, EquationEquation (19)
(19)
(19) :
Thus, each iteration brings the estimated increasing strain in the tendon closer to the actual value of the root of EquationEquation (17)(17)
(17) . presents a detailed procedure in the flowchart.
Figure 10. Deflection computation procedure in all loading stages.
2.5.1. Calculation of deflections
Once the overall elongation of the unbonded tendon was found following the fixed-point iteration method, all sectional parameters, especially the effective flexure curvature, , and the shear curvature,
, can be determined following the procedures in . The deflection at every beam location,
, can then be predicted by integrating the effective flexure–shear curvature,
twice as expressed in EquationEquation (20)
(20)
(20) :
where
A detailed procedure of the deflection calculation is described in the flowchart in .
3. Experimental validation of the model
3.1. Test specimen information
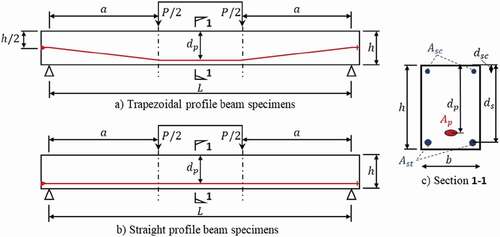
One reinforced concrete beam specimen performed by Pan, Li, and Lu (Citation2014) for shear deflection validation, 17 unbonded beam specimens from the literature of Warwaruk, Sozen, and Siess (Citation1962), Hussien et al. (Citation2012), Harajli (Citation1990), Tao and Du (Citation1985) were proposed herein. All selected specimens were simply supported rectangular beams subjected to either cyclic or monotonic loading. The Hussien et al. (Citation2012) unbonded tendons had a trapezoidal profile, whereas those from Harajli (Citation1990), Warwaruk, Sozen, and Siess (Citation1962), Tao and Du (Citation1985) had a straight profile. and summarize the configurations and characteristics of each test specimen. All specimens were tested under two concentrated loads at distance from the supports.
Table 1. Decription of the beam specimens
Figure 11. Typical beam specimen dimensions.
3.2. Discussion of results
3.2.1. Behavior of the unbonded beam
) through 5 m illustrates the load–deflection curves of the observed beams. These load–deflection curves usually exhibit three behavior stages: uncracked elastic behavior, cracked elastic behavior, and post-yielding (inelastic) behavior.
In the uncracked elastic region, beams in both experiment and analytical models deflected downward in a linear rate with load and continued to do so until the first crack occurred, where the concrete stress exceeded the concrete tensile strength, . illustrates an acceptable agreement between the predicted first crack and that measured experimentally. Note that the concrete tensile strength,
, was taken as a function of the concrete compressive strength,
, following Eurocode 2 (Citation2004), which could be different from the experimental result. The cracking moment in the unbonded beam was evidently greater than that in the reinforced concrete beam due to the help of the pre-compressive force from the tendon. prove that the higher the amount of the prestressing force applied, the higher the cracking moment increased.
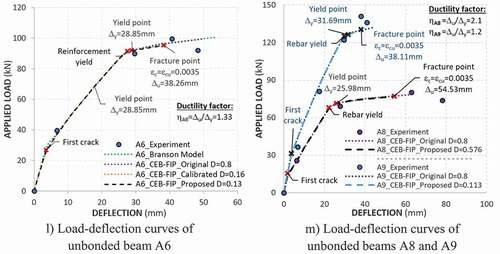
For the second region (i.e., cracked elastic), ) indicates that the first crack was well-defined by a significant change in the slope of the load–deflection curve for beam PP2R3-3 with a low ratio of both tendon and reinforcement. In contrast, the crack was unclear for beam PP3R3-3 with a high steel ratio. The change in the load–deflection curve slope after the first crack was caused by a rapid increase in the deflection derived from the transfer of the tensile force from the cracked concrete to the reinforcement. The cracks then propagated, developed, and progressed upward, and the deflection rapidly increased, which represents the behavior after the crack occurrence in concrete. Meanwhile, both rebar and tendon stress still behave in the elastic range. In this stage, shows that analytical curves generally lie under experiment curves because the cracked concrete was assumed to contribute no strength to the beam load capacity.
After reaching the yield point, a significant rise in the deflection generally occurred because both concrete and reinforcement fully activated their strengths and came to the yield region. However, the load capacity of beams PP3R3-3, OW.34.075, OW.34.141, OW.34.155, etc. still considerably increased and was continuously up to fracture. This resulted from the fact that the unbonded strain did not reach to yield point and still activated its strength to the load capacity when the deflection increased.
3.2.2. Effect of tension stiffening on load–deflection relationship
shows that Branson (Citation1968) and the original CEB–FIP Model Code (Citation1990) could predict the deflection versus load in the region before yield point well. However, there was an overestimation of both deflection and load capability in post-yielding region compared with the experimental results because the two models did not thoroughly represent tension stiffening effect after yield point. In some cases (i.e., beams OW.34.075, OW.34.141, OW.34.155, OS.33.238, OS.33.092, and OS.34.138), analytical load capacity, following either Branson (Citation1968) or original CEB-FIP Model Code (Citation1990), is much higher than those measured experimentally. It is because post–yielding deformation, in case of unbonded beam, not only represents deflection ductility but also directly affects average strain of unbonded tendon. The higher the increment in the tendon strain, the higher the tendon strength activated to the flexural capacity of the beam, especially before tendon yields. For example, in beams OW.34.075, OW.34.141, and OW.34.155, where the tendon did not yield, the differential errors in load capability between the analytical model using original CEB-FIP tension stiffening and experiment results corresponded to approximately 8%, 14%, and 16%, respectively, as shown in .
Table 2. Comparison of load capacity and deflection at maximum load between test result and analytical model
Therefore, this study calibrated various coefficient values in the CEB–FIP model to fit the analytical curves with the experimental results. An empirical equation of
was then proposed and expressed in Equation 10 based on exponential regression of 15 beam specimens (). Two beam specimens A8, A9 collected from Tao and Du (Citation1985) were considered as unseen data to verify capability of regression model. The proposed model predictions for the global load–deflection curves during loading process were well agree with experiments ( and ). Average ratios of proposed model to experimental results were 0.96 and 1.01 for load capacity and deflection at maximum load, respectively.
4. Strain evolution
4.1. Introduction of nonlinear finite element model
Unbonded beams B7 and B8 were simulated using nonlinear finite element models in ABAQUS. Concrete plasticity was adopted to formulate the material nonlinearity by using Drucker–Prager coefficients with a modification in dilation angles and viscosities suggested by Hong (Citation2019) (). Behavior of concrete in compression followed Kent & Park model with a modification for high concrete strength, whereas tension stress–strain relationships of concrete was calculated following nonlinear tension softening model. Trilinear stress–strain relationship was used for both reinforcement and unbonded tendon.
Table 3. Drucker–Prager coefficients for concrete damage plasticity model
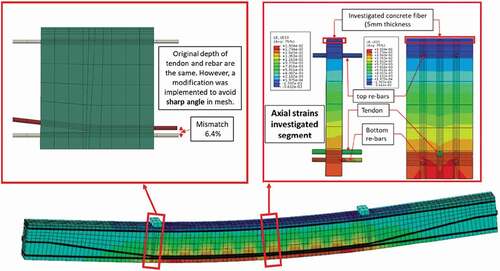
An Abaqus model is composed of parts (concrete body, longitudinal rebar, stirrup, unbonded tendon, etc.). summarizes detailed setup of interaction betweet each part. Meshes size of 40 mm was selected. presents a modification of tendon profile to avoid sharp angle in mesh.
Table 4. Interaction setup between each element in numerical model
Figure 12. Strain observation in the numerical model.
4.2. Strain comparison between proposed analytical model and a nonlinear finite element analysis considering concrete damaged plasticity
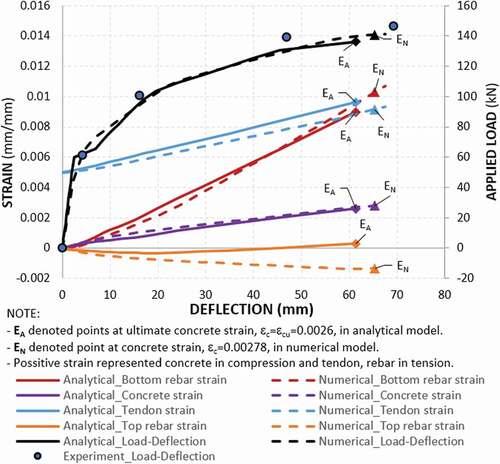
A numerical analysis of unbonded beams B7 and B8 was used to compare strain rates with proposed analitycal model. In this comparison, the mean strain of bonded reinforcement, , computed by the analytical model was considered for comparison to the maximum principal strain value of the 40 mm-long critical element analyzed by the numerical model.
illustrate good agreement in the load–deflection curve and concrete and reinforcement strain rate between the two models. However, in , because of difference in concrete model, there is a slight difference in ultimate concrete strain for beam B8, which are 0.0026 and 0.0028 for analytical and numerical models, respectively. Proposed model selected a simple parabola–rectangle stress–strain relationship, whereas numerical model used a modification of the Kent and Park model. The main differences between two concrete models were the strain reaching peak stress ( and the ultimate strain (
) illustrated in . The secondary difference was the tendon profile modification in numerical model, of which the tendon has to slightly lifted up to avoid sharped-edge elements as illustrated in . Consequently, the tendon strain rate in the numerical model was slightly slower than that in the analytical model.
Table 5. Strain comparisons between simple parabola–rectangle concrete model and modified Kent & Park concrete model
Figure 13. Strain comparison of unbonded beam B7 between proposed analytical model and numerical model.
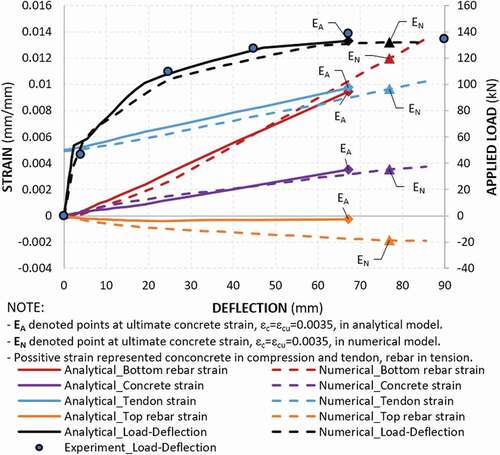
Figure 14. Strain comparison of unbonded beam B8 between proposed analytical model and numerical model.
4.3. Strain evolution based on the analytical model analysis
In this investigation, the unbonded tendon strain included initial and increasing strains that can be considered at any location. Both concrete and reinforcement strains are taken as strains at the critical crack section. The left side of comprehensively represents a strain evolution of materials in an ordinary measure, while the right side illustrates the strain activation of materials in terms of normalized rate. The concrete strain was normalized by the strain at the peak stress, , which is a function of concrete strength,
, in accordance with the stress–strain relationship ( and EquationEquation (3))
(3-3)
(3-3) . Likewise, both tendon and reinforcement strain were normalized by their yielding strain,
and
.
Figure 15. Continued.
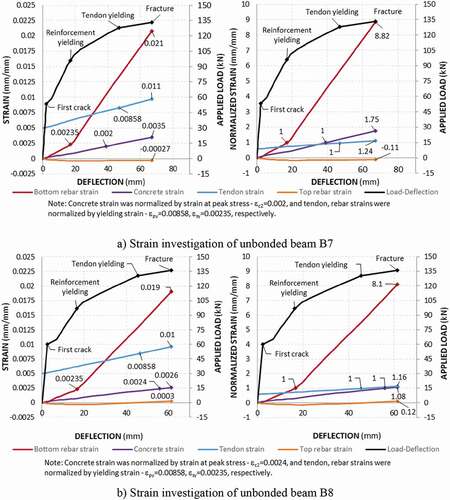
Figure 15. Continued.
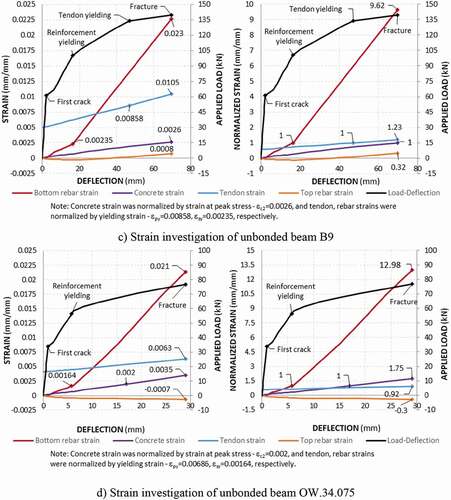
Figure 15. Continued.
Figure 15. Continued.
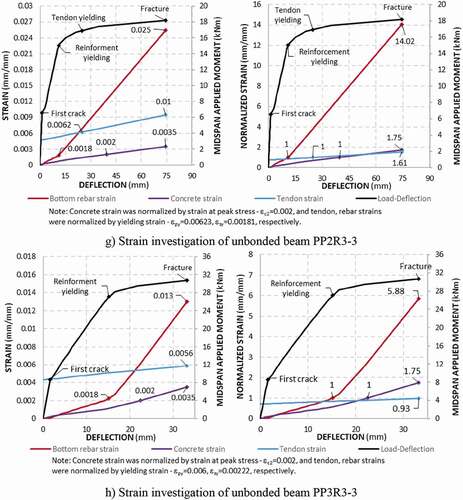
clearly shows that the unbonded tendon steadily activates its strain in a linear proportion to the beam deflection. This activation is consistent with the statement that elongation of unbonded tendon will be equal to averaging the change in the length of the concrete adjacent to the tendon between end anchorages. Moreover, the tension rebar strain increased at the same rate with the adjacent concrete before the first crack occurrence caused by the perfect bond mechanism. After first cracking, tension rebar increased its strain rate to captivate total tensile force of the cross-section because of a significant decrease in tensile strength of concrete caused by cracking. Both tension rebar and concrete in the compressive zone raised their strain rate at the point of reinforcement yielding.
5. Conclusion
The analytical model proposed in this study allows to compute both deflection and strength capacity of the unbonded post-tensioned beam at every load stage before or after cracking. The proposed model offers several features for an accurate analysis, including the following:
(1) The model performs a trial-and-error procedure to solve force equilibrium criterion at any given load stage.
(2) The model considers the effect of tension stiffening resulting from the bond mechanism between conventional reinforcement and concrete. Tension stiffening model in the post-yielding region, considering significant strain concentration was developed based on CEB–FIP Model (Citation1990).
(3) The model considers shear deformation on the overall deflection of the structure and the global elongation of the unbonded tendon by computing additional shear rotation, , following the Timoshenko beam theory. A shear modulus reduction in post-cracking region is conducted by using a simple empirical equation suggested by Rahal (Citation2010).
(4) The model calculates strain increment of the unbonded tendon based on a computational procedure using the fixed-point iteration method.
An agreement was obtained between the analytical and experimental results collected from existing beam tests. The predictive accuracy in strain increment was also validated against nonlinear finite element model considering the concrete plasticity. In addition, an investigation of strain increment versus deflections of considered test beams was performed to study strain activation mechanisms in concrete, rebar, and unbonded tendon.
Nomenclature
Table
Disclosure statement
No potential conflict of interest was reported by the authors.
Additional information
Funding
Notes on contributors
Manh Cuong Nguyen
Manh Cuong Nguyen is currently enrolled as a Combined Master & Ph.D. candidate in the Department of Architectural Engineering at Kyung Hee University, Republic of Korea. His research interest includes precast structures.
Won-Kee Hong
Won-Kee Hong is a Professor of Architectural Engineering at Kyung Hee University. Dr. Hong received his Masters and Ph.D. degrees from UCLA, and he worked for Englelkirk and Hart, Inc. (USA), Nihhon Sekkei (Japan) and Samsung Engineering and Construction Company (Korea) before joining Kyung Hee University (Korea). He also has professional engineering licenses from both Korea and the USA. Dr. Hong has more than 30 years of professional experience in structural engineering. His research interests include new approaches to construction technologies based on value engineering with hybrid composite structures. He has provided many useful solutions to issues in current structural design and construction technologies as a result of his research combining structural engineering with construction technologies. He is the author of numerous papers and patents, both in Korea and the USA. Currently, Dr. Hong is developing new connections that can be used with various types of frames, including hybrid steel–concrete precast composite frames, precast frames and steel frames. These connections would contribute to the modular construction of heavy plant structures and buildings as well. He recently published a book titled as “Hybrid Composite Precast Systems: Numerical Investigation to Construction” (Elsevier).
References
- Au, F. T. K., J. S. Du, and Y. K. Cheung. 2005. “Service Load Analysis of Unbonded Partially Prestressed Concrete Members.” Magazine of Concrete Research 57 (4): 199–209. doi:https://doi.org/10.1680/macr.2005.57.4.199.
- Balaguru, P. N. 1981. “Increase of Stress in Unbonded Tendons in Prestressed Concrete Beams and Slabs.” Canadian Journal of Civil Engineering 8 (2): 262–268. doi:https://doi.org/10.1139/l81-033.
- Bentz, E. C. 2005. “Explaining the Riddle of Tension Stiffening Models for Shear Panel Experiments.” Journal of Structural Engineering 131 (9): 1422–1425. doi:https://doi.org/10.1061/(ASCE)0733-9445(2005)131:9(1422).
- Branson, D. E. 1968. “Design Procedures for Computing Deflections.” Journal Proceedings 65 (9): 730–742, September.
- Chakrabarti, P. R. 1995. “Ultimate Partially Stress for Unbonded Post-Tensioning Tendons in Prestressed Beams.” Structural Journal 92 (6): 689–697.
- Collins, M. P., and D. Mitchell. 1987. Prestressed Concrete Basics. Ottawa, Ontario: Canadian Prestressed Concrete Institute.
- Cowper, G. R. 1966. “The Shear Coefficient in Timoshenko’s Beam Theory.” ASME Journal of Applied Mechanics 33: 335–340. doi:https://doi.org/10.1115/1.3625046.
- European committee for standardization. 2004. BS EN 1992-1-1:2004. Eurocode 2: Design of Concrete Structures – Part1-1: General Rules and Rules for Buildings.
- Gere, J. M., and S. P. Timoshenko. 1991. Mechanics of Materials. 3rd SI ed. Cheltenham, UK: Nelson Thornes Ltd.
- Harajli, M., N. Khairallah, and H. Nassif. 1999. “Externally Prestressed Members: Evaluation of Second-order Effects.” Journal of Structural Engineering 125 (10): 1151–1161. doi:https://doi.org/10.1061/(ASCE)0733-9445(1999)125:10(1151).
- Harajli, M. H. 1990. “Effect of Span-depth Ratio on the Ultimate Steel Stress in Unbonded Prestressed Concrete Members.” Structural Journal 87 (3): 305–312.
- Harajli, M. H., and M. Y. Kanj. 1992. “Service Load Behavior of Concrete Members Prestressed with Unbonded Tendons.” Journal of Structural Engineering 118 (9): 2569–2589. doi:https://doi.org/10.1061/(ASCE)0733-9445(1992)118:9(2569).
- Hong, W. K. 2019. Hybrid Composite Precast Systems: Numerical Investigation to Construction. Woodhead Publishing, Elsevier.
- Hussien, O. F., T. H. K. Elafandy, A. A. Abdelrahman, S. A. Baky, and E. A. Nasr. 2012. “Behavior of Bonded and Unbonded Prestressed Normal and High Strength Concrete Beams.” HBRC Journal 8 (3): 239–251. doi:https://doi.org/10.1016/j.hbrcj.2012.10.008.
- Hutchinson, J. R. 2001. “Shear Coefficients for Timoshenko Beam Theory.” Journal of Applied Mechanics 68 (1): 87–92. doi:https://doi.org/10.1115/1.1349417.
- London: Thomas Telford. 1990. CEB – FIP Model Code for Concrete Structures. Comite Euro-international du Beton-Federation international. London, UK: Thomas Telford Ltd.
- Pan, Z., B. Li, and Z. Lu. 2014. “Effective Shear Stiffness of Diagonally Cracked Reinforced Concrete Beams.” Engineering Structures 59: 95–103. doi:https://doi.org/10.1016/j.engstruct.2013.10.023.
- Paulay, T., and P. J. Loeber. 1974. “Shear Transfer by Aggregate Interlock.” Special Publication 42: 1–16.
- Rahal, K. N. 2010. “Post-cracking Shear Modulus of Reinforced Concrete Membrane Elements.” Engineering Structures.” 32 (1): 218–225. doi:https://doi.org/10.1016/j.engstruct.2009.09.008.
- Standards Australia, Sydney, New South Wales, Australia. 2. AS1012.9. 2014. Australian Standard for Concrete Structures. AS3600-2009. Australia: SAI Global Limited.
- Stramandinoli, R. S., and H. L. La Rovere. 2008. “An Efficient Tension-stiffening Model for Nonlinear Analysis of Reinforced Concrete Members.” Engineering Structures 30 (7): 2069–2080. doi:https://doi.org/10.1016/j.engstruct.2007.12.022.
- Tao, X., and G. Du. 1985. “Ultimate Stress of Unbonded Tendons in Partially Prestressed Concrete Beams.” PCI Journal 30 (6): 72–91. doi:https://doi.org/10.15554/pcij.11011985.72.91.
- Vu, N. A., A. Castel, and R. François. 2010. “Response of Post-tensioned Concrete Beams with Unbonded Tendons Including Serviceability and Ultimate State.” Engineering Structures 32 (2): 556–569. doi:https://doi.org/10.1016/j.engstruct.2009.11.001.
- Warwaruk, J., M. A. Sozen, and C. P. Siess. 1962. “Investigation of Prestressed Reinforced Concrete for Highway Bridges, Part III: Strength and Behavior in Flexure of Prestressed Concrete Beams.” Engineering Experiment Station Bulletin No 464.