
 ?Mathematical formulae have been encoded as MathML and are displayed in this HTML version using MathJax in order to improve their display. Uncheck the box to turn MathJax off. This feature requires Javascript. Click on a formula to zoom.
ABSTRACT
The sustainable development of the construction industry in China requires in-depth analysis of the industrial chain related to the construction industry and the transformation of its production mode. Through analysis of input–output tables over years of 2007, 2010, 2012, 2015 and 2017 and the adoption of average propagation length (APL) model, this paper investigates the changes of China’s construction industry from a macro level. The results show that the construction industry has stronger economic linkages with the Manufacture of Nonmetallic Mineral Products, the Manufacture and Processing of Metals and Metal Products and the Mining Industry than any other industries. The economic distance between the Manufacture of Nonmetallic Mineral Products and the construction industry is the shortest, taking 1 as its value in all 5 years, which indicates the growth of the construction industry has the strongest positive effect on the development of the industry. In addition, the correlation coefficient between the construction industry and most industries showed an upward trend from 2007 to 2015, and slightly decreased in 2017. In general, the complexity of the construction industry chain has an increasing trend. The linkages between industries have increased and the construction industry chain is relatively stable.
Graphical Abstract
1. Introduction
As one of the important pillar industries of China’s national economy, the construction industry has made great contributions to the development of the national economy (Giang and Pheng Citation2011; Barber and El-Adaway Citation2015; Ho Citation2016; Lam and Oshodi Citation2016). However, the construction industry not only promotes rapid economic development but also brings severe environmental problems. 40% of global energy consumption and 25% of carbon dioxide emissions are from the construction industry (WBCSD Citation2009; WGBC Citation2010; Song, Liu, and Langston Citation2006; Chuai et al. Citation2015). In the “Twelfth Five-Year Plan”, it is clearly pointed out that China’s current economic growth rate declined and the domestic environment was further deteriorated,all industries need to take the strategic adjustment of economic structure as the main direction of accelerating the transformation of economic development mode.
Under such external circumstances, the economic structure of China’s construction industry is in urgent need of adjustment, and the adjustment will also affects the growth rate and development trend of the economy. In addition, the construction industry is connected with other industries extensively(Polenske and Sivitanides Citation1990; Gundes Citation2011). The construction industry provides important infrastructure and material foundations for many physical and non-physical production entities. And it also offers a broader growing space for other industries. On the other hand, other industries provide necessary products and service support for the construction industry. Therefore, the analysis on the relationship between the construction industry and other industries helps to identify the interactive linkages between construction industries and other industries. It also clarifies the way how the construction industry pushes the development of national economy in China. Such kind of analysis is essential to achieve the coordinated development between the construction industry and other industries. Besides, it is also useful to obtain the sustainable progress of national economy.
The research on the economic structure of the construction industry gives references to policy makers in their formulation of development strategies on the construction industry as well as the whole national economy. From this aspect, such kind of research will promote the healthy and sustainable development of the national economy in the long run. From the perspective of the industry chain, this paper defines the leading economic industry chain in a macro level and analyses the linkage between construction industry and other related economic industries. It is of great importance for the government of China to determine the national economic strategy and formulate relevant policies by analysing the industrial china relationships and its trend of evolution.
2. Literature review
Foreign scholars began to study the construction industry earlier. Many studies show that the construction industry plays an obvious role in promoting economic growth (Hillebrandt Citation2000; Giang and Pheng Citation2011; Barber and El-Adaway Citation2015; Lam and Oshodi Citation2016). There is a positive correlation between the output of construction industry and the total output of economy. Industrialization, economic scale, production technology and other factors will affect the production activities of construction industry(Lopes, Ruddock, and Ribeiro Citation2002; Hosein and Lewis Citation2005; Dietzenbacher Citation2002). Most of the above factors are interrelated, and the total-sector changes and the relationship between sectors can be observed from the input–output analysis.The input–output table, which was proposed by Wassily Leontief in the 1930s (Leontief Citation1936), is capable to quantify the supply and demand relationship between departments or regions. With the usage of input–output tables, the analysis of production relationship among industries or regions becomes more rigorous and scientific. The input–output table theory believes that the production activities of every industrial entity are closely related to and interdependent with other industries. Some sectors provide their outputs as production factors to other sectors while the production outcomes of these other sectors are also essential materials required by the production activities of these sectors. The quantification of this supply–demand relationship provides data support for solving inter-departmental or inter-regional production adjustment problems(WGBC Citation2010). The input–output tables are constantly employed by studies conducted among various industries. The significant role of the construction industry in stimulating economic growth has been proved in the input–output analysis (Reis and Rua Citation2009). There is a close relationship between the construction industry and many other sectors in economic activities(Polenske and Sivitanides Citation1990; Gundes Citation2011). Construction has been proved to have strong demand pull power and low supply driving force, which can be obtained from the backward and forward linkage indicators (Gregori and Pietroforte Citation2015). This characteristic shows that construction activities simultaneously stimulate the development of multiple industries, and the construction industry stimulates economic activities through the intermediate input from various departments. Some studies using input–output have shown that when a developed economy undergoes deindustrialization, the contribution of construction to the economy declines because of the decline in the contribution of the manufacturing and non-industrial sectors to construction. Pietroforte et al. found that when Australia, Japan, the United States and other developed countries entered the stage of non industrialization, the economic impact of construction industry showed a downward trend(Pietroforte, Gregori, and Falagario Citation2009). Ilhan and yaman (Citation2011) found that similar phenomena exist in Ireland, the Netherlands and Sweden (Ilhan and Yaman Citation2011).
The research on construction industry in China started relatively late, mainly focusing on the efficiency evaluation of construction industry and the relationship between construction industry and other industries. Jingke Hong studied the energy supply industry chain of construction industry, and found that the two industries of “non-metallic mineral products manufacturing” and “metal smelting and rolling” have the greatest correlation with the construction industry, the input of these two sectors is the main source of energy for the construction industry. However, the direct impact of the investment in “production and distribution of electric power and heat” and “oil and gas exploitation” on the construction industry is not as great as that of “non-metallic mineral products manufacturing” and “metal smelting and rolling”, but these two industries have a huge indirect impact on the energy use of the construction industry (Hong, Shen, and Xue Citation2016). From the entire life cycle perspective of the industry chain, Yuan Chang selected 23 industries that were strongly related to the construction industry and calculated the embodied carbon and CO2 emissions of the construction industry. The results showed that the energy consumption in the process of the construction and operation of the building accounted for 40% of the national energy consumption, and the CO2 emissions in this process accounted for 25% of the country total CO2 emissions. “Building material manufacturing industry and Electricity”, “heat production and supply industry” are the main industries that provided energy for the construction industry(Chang et al., Citation2010).Using data envelopment analysis and input–output models, Junna Yan studied the regional differences in the comprehensive performance of China’s construction industry, and conducted cross-industry correlation analysis. The results show that the construction industry of four provinces-Hebei, Shanghai, Hubei and Yunnan-had higher efficiency in 2007. The coordination from the mining industry, Non-metallic mineral products manufacturing industry and the Smelting and Pressing of Metals industry lead to the efficiency changes of the construction industry (Yan et al. Citation2016) . From perspective of the industry chain, Lei Zhang studied CO2 emissions of the construction sectors of 41 countries from 1995 to 2009. Through analysing the forward and the backward linkages of the construction industry chain, Lei Zhang’s results show that the upstream industry of the construction industry had a greater contribution to CO2 emissions, while the downstream industry of the construction industry produced less CO2 emissions (Zhang et al. Citation2019). Jingke Hong and other scholars conducted in-depth research on energy use in the construction industry from both sectoral and regional aspects. Their research results displayed that the construction industry in provinces like Shanxi, Liaoning, Heilongjiang, Henan and Sichuan had low energy efficiency. In terms of Industry Association, non-metallic mineral products manufacturing and metal smelting and suppressing industries have the largest relative contribution value to the energy of construction industry (Hong et al. Citation2016). With the data from the world input–output database, Zhang L analysed the connection between CO2 emissions of various industries and the construction industry from the aspects of consumption and production. The results indicated that there was an upward trend in the forward and the backward linkages among the the global construction industry (Zhang et al. Citation2020) . With the input–output model, Cathy C. W. studied the impact of Hong Kong’s construction industry on the regional economy. The results showed that the stimulation effect of Hong Kong’s construction industry on economic growth had weakened, but its impact on external exports had increased. Besides, its forward and backward linkages with other industries were reduced (C C W, Hsu, and Pratt et al. Citation2019).
Usually, the linkage between industries can be measured by two dimensions: strength and length. As for the strength, the Leontief inverse matrix calculated by the input–output model is usually used. The length, which is the influence distance between industries is usually measured by the average propagation length (APL) proposed by Dietzenbacher et al (Dietzenbacher, Romero Luna, and Bosma Citation2003; Dietzenbacher and Romero Citation2015). With consideration of direct and indirect effects between industries and regions, the APL model calculated the economic distance through the whole industry chain. The strength and the length of the inter-industry linkages are important for us to see the production structure and connections between departments in the production chain intuitively. Many scholars have shown interests in APL. Lu and Xu used the Sherman–Morrison formula to analyse the quantitative relationship between the APL index and the direct input coefficient (Lu and Xu Citation2013). Oosterhaven and Bouwmeester discussed the application conditions and scope of APL (Oosterhaven and Bouwmeester Citation2013). In empirical analysis, APL model is also employed by many scholars. With APL model, Dietzenbacher and Romero identified important production chains in the European trade network (Dietzenbacher and Romero Citation2015). In the real estate industry, Dietzenbacher and Temurshoev calculated the economic distance and displayed the economic connection between consumers and the real estate companies through APL model (Dietzenbacher and Temurshoev Citation2008). Franco et al. got the economic distance between countries and studied the impact of trade-related R&D investment on total factor productivity with the tool of APL (Franco, Montresor, and Vittucci Marzetti Citation2011). Diakantoni and Escaith calculated the economic distance of the cost-driven industry chain in the international trade network, and found out the most closely connected departments based on the economic distance and the connection strength between departments (Diakantoni and Escaith Citation2012). De Backer and Miroudot sorted the positions of different countries in the international production network with APL (De Backer and Miroudot Citation2014). Erik D and Romero studied the economic linkage between six European countries and determined the role each country plays in the production system with APL index(Erik and Romero Citation2007).Ye Anning identified the agricultural industry chain in Heilongjiang Province of China and calculated the degree of industrial relevance (Ye and Zhang Citation2019). Using APL index, Delin Fang studied the relationship between carbon emissions and added value among different industries in 30 provinces in China (Fang, Duan, and Chen Citation2020).
Based on the above analysis, we can see that when it comes to the industry connections between construction industry and other industries in China, researchers usually only focus on the inter-industry linkage. The analysis about the linkage strength and economic distance under the perspective of the industry chain is absent, and this makes it difficult to identify the role of different industries in the industry chain. Furthermore, it is also hard to reflect the influence of the construction industry on China’s macro-economy development. The transformation direction of the construction industry is thus unclear. To fill in this gap, this paper identified the industrial chain of China’s construction industry and calculated the linkage strength and economic distances between industries with input–output analysis and APL index. After determining the connections between the industries, the author diagrammed the industrial chain of the construction industry of China. Based on data and figures, this paper then analysed the evolution of the construction industrial chain in China. The conclusions of this paper provide references for the transformation of the construction industry.
3. Methodology
3.1. input–output analysis
shows the what a typical input–output table looks like, where represents the production value of department i that will be consumed by department j in its production activities,
shows the total output of department i,
is the total input of department j,
represents final demand, and
is the total added value.
Table 1. Illustration of input–output table
The direct consumption coefficient refers to the quantity of goods and services from various departments that are directly consumed by a certain department to produce another unit of total output. represents the direct consumption coefficient and A is the direct consumption coefficient matrix. The calculation formula is as follows:
The complete consumption coefficient refers to the quantity of various goods and services which are consumed directly or indirectly by a certain department in order to produce another unit of total output. is used to represent the total consumption coefficient and B is the total consumption coefficient matrix. The calculation formula is as follows:
The direct distribution coefficient refers to the ratio of the amount of an intermediate product, which is allocated by i-th department to j-th department, to the total output of that product. and H represent the direct distribution coefficient and the direct distribution coefficient matrix. The calculation formula is as follows:
The complete distribution coefficient is calculated based on the direct distribution coefficient. Its definition and calculation method are similar to the total consumption coefficient. and G are used to represent the complete distribution coefficient and the complete distribution coefficient matrix respectively, then the formula is:
The direct consumption coefficient and the total consumption coefficient measure the degree of backward correlation between industries. The degree of forward linkage between industries is represented by the direct distribution coefficient and the complete distribution coefficients. The degree of backward correlation measures to what extend the production factors of the industry rely on other industries’ supply. The degree of forward linkage shows to what extend the industry provides production factors to other industries.
3.2. Influence and inductive coefficients
The influence coefficient reflects the demand ripple extent of various sectors of the national economy by a unit final demand increase in a sector. It can be expressed as the following formula:
When, it shows that the impact of department j on social production is greater than the average level of society; when
, it shows the influence of the department j on social production is smaller than that of the social average. The larger the influence coefficient, the bigger the pulling effect of j department on other sectors .
The inductive coefficient reflects the demand induction of a certain department by a unit final use increase of the various departments of the national economy. To be specific, the demand induction of this department is also its output provided to other departments for their production activities. The inductive coefficient can be calculated by the following formula:
When, the degree of demand induction in department i is greater than that of the social average;
, indicates that the demand induction level of the department i is less than that of the social average.
Usually, sectors with larger influence coefficients are regarded as the “pillar industries” of national economy and these sectors have an important forward traction effect on the development of the entire national economy. Sectors with larger inductive coefficients are treated as the “basic industries” of the national economy. They have a backward pulling effect on the development of the entire national economy.
3.3. The APL model
In economic activities, there are complex linkages among different departments. These linkages are categorized as the industry linkage which involves various inputs and outputs. The direct and indirect linkages between industries can be measured by the total consumption coefficient and the complete distribution coefficient. Generally, these two coefficients are mainly used to analyse the relationship between two industries. The drawback is the industrial chain can not be formed. Besides, the function of different sectors in the industrial chain is also impossible to present by these two coefficients. Therefore, Dietzenbacher proposed the Average Propagation Length (APL) model (Dietzenbacher, Romero Luna, and Bosma Citation2003; Dietzenbacher and Romero Citation2015). This model uses the number of steps in the economic connection between departments as their economic distance. The smaller the APL, the shorter the economic distance between industries and the smaller the number of intermediate links between industries. The shorter the economic distance, the closer the correlations between different industries. APL is calculated as follows:
To filter the important industrial chains of a national economy from the complex data, we first need to select a correlation coefficient threshold. Because the setting of this threshold value has some subjectivity, the standard scale introduced can also introduce different subjective criteria. However, the comparison of the economic distances and correlations between sectors in the same national economy is still possible.
In this paper, we construct functions and the APL is rounded to be integer. In consistent with previous research, the average of the total consumption coefficient and the complete distribution coefficient is taken as the economic linkage coefficient between industries. When this coefficient is bigger than the selected threshold – the value of a, we then consider the APL value. represents the economic linkage coefficient of the two industries. F is the economic coefficient matrix, and
is the economic distance between industries. The formula is as follows:
Among them,represents
is rounded to integer number and a takes value of 0.2.
3.4. Data sources
The research in this paper adopted five national input–output tables as research data, which involve input–output tables of 17 departments in 2007, 2010, 2012, 2015 and 2017, the specific data can be found in the Chinese Statistical Yearbook of the corresponding year.See more details in . The construction industry is treated as research object of this paper. This research tries to find industries that are closely related to the construction industry.
Table 2.. 17 sectors of the input–output table
4. Results
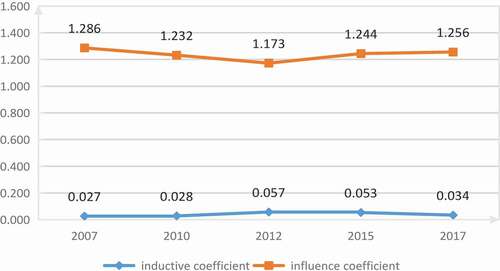
To fully identify the role of the construction industry in the development of national economy, this paper calculated the influence coefficient and the inductive coefficient of the construction industry. As shown in , the influence coefficient of China’s construction industry is greater than 1 in all 5 years. This indicates the construction industry is a “pillar industry” in the national economy and has an important role in promoting the development of the national economy. Also, its pulling effect on national economy is more significant than the average pulling effect of all sectors. The inductive coefficient of the construction industry, on the contrary, is far less than 1 in all 5 years; which shows that the construction industry is not a “basic industry” and provides less production materials for other industries. When each department in national economy increases a unit input, the demand induction of the construction industry is smaller than that of the social average. The construction industry seldom provides raw material for other industries so its pulling effect on other industries is limited. But the production process of the construction industry consumes a large amount of materials from other industries which means the production activities of the construction industry involve participation of other industries. Therefore, the pulling effect of the construction industry on other industries is significant. Changes of the influence coefficient and the inductance coefficient are not dramatic. The small fluctuation shows the construction industry chain is relatively stable and its transformation will be a long-term process. To study China’s macro-economic development from the perspective of industrial chain and the position of construction industry in economic development, it is necessary to analyze and study the leading industrial chain in China.
Figure 1. The influence and inductance coefficients of the construction industry.
In order to make the analysis method easier to understand and the data more intuitive, this paper uses tables to present the economic linkage coefficients calculated from input–output tables, APL value, and economic distances between industries (see , and ). The department names are replaced by corresponding numbers. The numbers in the economic linkage indicator table that are bigger than the threshold are highlighted in bold. It can be seen from that compared to Manufacture and Processing of Metals and Metal Products (NO.8) and Manufacture of Machinery and Equipment (NO.9), the construction industry (NO.12) ranks third in increasing demand of various industries () . However, its promotion effect on other industries is the smallest (
). This is because the outputs of the construction industry are final products which are seldom used in other industries. However, the production process of the construction industry needs other industries to provide raw materials. This result is in consistent with previous research (Gregori and Pietroforte Citation2015). also shows that the largest linkage coefficient (f7.12 = 0.54) exists between the construction industry and the Manufacture of Nonmetallic Mineral Products. The closest economic relationship happens in these two industries. This is because the Manufacture of Nonmetallic Mineral Products industry produces construction material for the construction industry. The rapid development of the construction industry has increased the demand of construction materials, which stimulates the growth of the Manufacture of Nonmetallic Mineral Products industry. Therefore, the development of these two industries is closely related. The APL value represents the number of economic connection steps between two industries. More details can be seen in . APL value represents both the forward cost-driven effect of industry i on industry j and the demand-driven effect of industry j to industry i. For example, in , 4.45 in the first row and second column means the cost-driven effect of industry 1 on industry 2 requires 4.45 steps, and the demand-driven effect of industry 2 on industry 1 also requires 4.45 steps. The APL value in on the diagonal is relatively small. This shows the industry affect itself most directly. displays the economic distance between industries. The economic distance is obtained from and by selection and calculation. The results show that there is barely driven effect of the construction industry on the development of other industries (
); however, the pulling effect of the construction industry on six industries is significant (
). From , we can conclude that Manufacture of Nonmetallic Mineral Products industry (NO7, 17.12 = 1) is closely connected with the construction industry and the pulling effect of the construction industry on it is most significant. The reason is that Manufacture of Nonmetallic Mineral Products industry is an industry that provides non-metallic building materials for the construction industry. Cement, lime, glass, masonry and many other materials are produced by this industry, so the development of the construction industry has increased the demand of this industry which promotes its rapid development.
Table 3. 2017 Economic linkage indicators between China industries
Table 4. 2017 APL values between China industries
Table 5. 2017 Economic distances between China industries
According to the average value of the economic linkage coefficients calculated over 5 years, it can be concluded that there are eight industries closely related to the construction industry, as shown in .
Table 6. The abbreviated name of each sector
This paper draws five industrial chains to show those industries that have closely connections with the construction industry over 5 years (see ).
Figure 2. China construction industry chain in 2007.
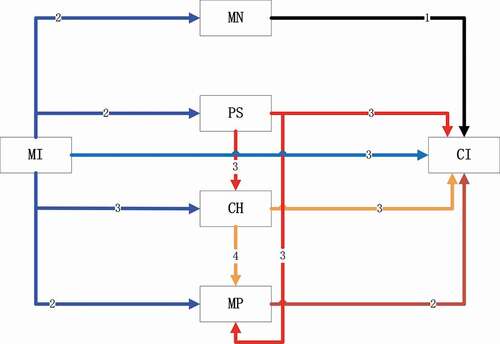
Figure 3. China construction industry chain in 2010.
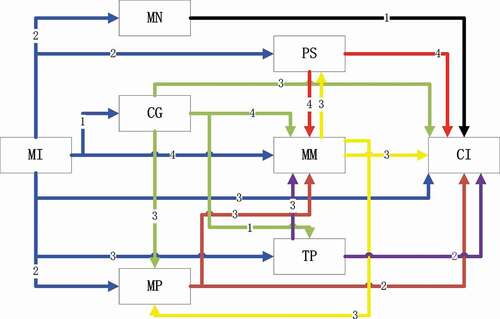
Figure 4. China construction industry chain in 2012.
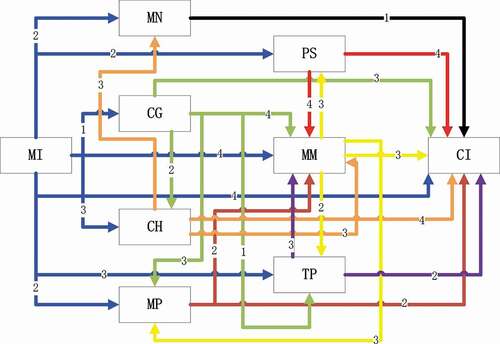
Figure 5. China construction industry chain in 2015.
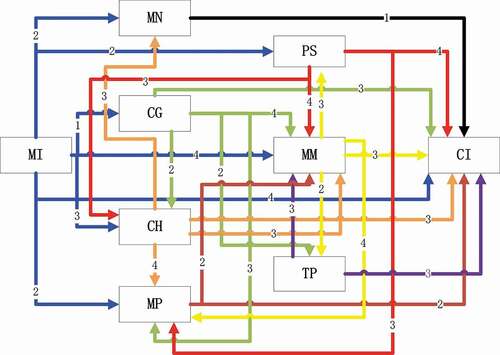
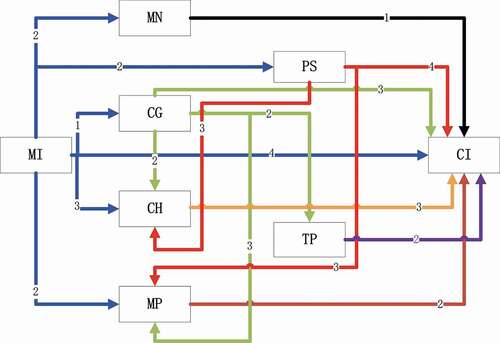
Figure 6. China construction industry chain in 2017.
shows the economic distance between the construction industry and the non-metallic mineral products industry in 2007 takes value 1 indicating the smallest economic distance happens between these two industries. The Manufacture of Nonmetallic Mineral Products industry provides construction materials for the construction industry. Its development depends strongly on the construction industry. The pulling effect of the construction industry on its development is significant. Manufacture and Processing of Metals and Metal Products and the construction industry are also connected quite closely. The economic distance takes 2 as its value. The Manufacture and Processing of Metals and Metal Products industry provides steel, aluminium and other metal building materials for the construction industry, and the development of the construction industry also brings prosperity into the growth of this industry. The economic distances between the construction industry and Mining Industry (MI), Production and Supply of Electric Power, Heat Power and Water (PS), and Chemical Industry all take value of 3. These three industries directly or indirectly promote the development of the construction industry. The closest economic distance between the mining industry and the construction industry can be achieved through two ways. First, the construction industry is directly connected to the mining industry through three economic units. The second way is the construction industry correlates to the Manufacture of Nonmetallic Mineral Products industry through one economic unit while the Manufacture of Nonmetallic Mineral Products industry is further connected to the mining industry through another two economic units. Therefore, the mining industry is indirectly related to the construction industry through the Manufacture of Nonmetallic Mineral Products industry. And the economic distance between these two industries is in total 3.
shows that there were seven industries closely related to the construction industry in 2007. The Manufacture of Nonmetallic Mineral Products industry has the closest economic distance with construction industry. The economic distance between these two industries is 1. This indicates there is significant pulling effect of the Manufacture of Nonmetallic Mineral Products industry on the construction industry. The reason is the Manufacture of Nonmetallic Mineral Products industry provides bricks, lime and other building materials for the construction industry. The economic distances between the Manufacture and Processing of Metals and Metal Products industry, the transportation and postal warehousing industry, and the construction industry all take value of 2. This result implies that the development of these two industries is directly related to that of the construction industry, and the construction industry has a great pulling effect on these two industries. To be specific, the Manufacture and Processing of Metals and Metal Products industry provides construction materials such as steel and aluminium materials for the construction industry. The production materials of the construction industry require transportation and storage services from the transportation and postal warehousing industry. Therefore, these two industries have played an important role in promoting the development of the construction industry. The economic distances between the construction industry and industry of manufacture of Machinery and Equipment as well as the mining industry take value of 3. The economic distance is 4 when it comes to the economic relationship between the construction industry and the industry of Production and Supply of Electric Power, Heat Power and Water.
implies that there were 8 industries closely related to the construction industry in 2012. The construction industry brings prosperity into many industries’ development. Compared with 2010, the chemical industry became closely related to the construction industry in 2012. As shown in , the economic distance between the construction industry and the chemical industry is 4. The economic distance between the construction industry and most other industries does not change except the mining industry whose economic distance changes from 3 to 4. This indicates the industrial chain which is related to the construction industry is relatively stable.
From , we can see the complexity of the industrial chain reaches its peak. The economic distance between the industry of Manufacture of Nonmetallic Mineral Products and the construction industry takes value of 1 indicating the closest correlation exists in these two industries. The industry of Manufacture and Processing of Metals and Metal Products is connected with the construction industry with economic distance of 2. The Coking, Gas and Processing of Petroleum, Manufacture of Machinery and Equipment industry, Chemical Industry, Transportation and postal warehousing industry and the construction industry have economic distance which takes 3 as its value. The Production and Supply of Electric Power, Heat Power and Water industry as well as the mining industry are correlated with the construction industry with an economic distance of 4. Compared with 2012, the economic distance between Transportation and postal warehousing industry and the construction industry changed from 2 to 3, indicating this industry had profound influence on the construction industry. Also, Production and Supply of Electric Power, Heat Power and Water generate a close association with Chemical Industry and the industry of Manufacture and Processing of Metals and Metal Products. These industries expand their ways of affecting the construction industry.
As shown in , there were 7 industries connected with the construction industry closely in 2007. The Manufacture of Nonmetallic Mineral Products industry is connected to the construction industry most closely. Its economic distance with construction industry is 1. The industry of Manufacture and Processing of Metals and Metal Products and the transportation and the postal warehousing industry follow right after the Manufacture of Nonmetallic Mineral Products industry. Their economic distances with the construction industry are 2. The industry of Cooking, Gas and Processing of Petroleum and the chemical industry have an economic distance of 3 with the construction industry, followed by the mining industry and the electricity, heat production and supply industry which have an economic distance of 4 with the construction industry.
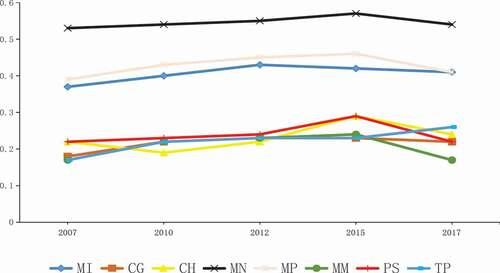
As shown in , the economic correlation coefficients of three industries–the mining industry, Manufacture of Nonmetallic Mineral Products, and Manufacture and Processing of Metals and Metal Products – with the construction industry are much larger than any other coefficients. This is because the development of these three industries is most directly driven by the construction industry. The construction industry requires energy supply from the mining industry while its building materials come from the Manufacture of Nonmetallic Mineral Products, and Manufacture and Processing of Metals and Metal Products. From 2007 to 2015, there was an upward trend in the correlation degree of various industries with the construction industry. In 2017, the degree of correlation slightly declined. Before 2015, the construction industry developed rapidly and it played an essential effect on promoting China’s national economy. In addition, its pulling effect on other industries was also very significant. After 2015, the construction industry slowed down its development speed. Its motivating effect on other industries also weakened. The ratio of the construction industry’s output to the GDP also showed the same changing trend. Before 2015, this ratio showed an upward trend, and it declined slightly in 2017. The ratio in 2007, 2010, 2012, 2015, and 2017 were 5.3 %, 5.7%, 6.9%, 7.0% and 6.8%, respectively. The construction industry, as an industry with high-energy consumption and high emissions, must be transformed under the pressures of environment deterioration and the Chinese central government’s commitment of reducing emissions. Green building has the advantages of energy saving, emission reduction and building materials saving. China has issued a series of policies to promote the rapid development of green building. The construction industry has gradually begun to introduce green building materials to replace traditional building materials, and the government also encourages enterprises to use clean energy. According to the Notice of Special Inspection on the Progress of Building Energy Efficiency and Green Building, released by the General Office of the Ministry of Housing and Urban–Rural Development of the People’s Republic of China, the proportion of newly built green buildings in the country has reached 28.5%, indicating that green buildings have been vigorously promoted. According to the data released in the National Enterprise Innovation Survey Yearbook, the number of construction and manufacturing enterprises that realize technological innovation has further increased. According to the data released by China Statistical Yearbook, the direct consumption coefficient of the construction industry for the three industries of mining, non-metallic mineral products and metal products manufacturing decreased in 2017 compared with that in 2015, which means that the input of the three industries consumed by the production of one unit of the construction industry decreased. This indicates that with the support of national policies, the construction industry has been continuously realizing sustainable transformation through technological innovation and the development of green buildings. The correlation coefficient between construction industry and these three industries decreased because the intermediate input of mining, non-metallic mineral products and metal products manufacturing industry consumed by the production unit of construction industry. This is similar to the research results of previous studies (Song, Liu, and Langston Citation2006) .
Figure 7. Correlation coefficient between the construction industry and others industries.
As shown by the industry chains over years of 2007–2017, the most stable industries related to the construction industry are the mining industry, Non-metallic Mineral Products, and Manufacture and Processing of Metals and Metal Products, and the electricity, heating and water supply industry. In all industry-chain network maps, these industries are always highly related to the construction industry. There are also several industries whose correlation with the construction industry is relatively unstable. For example, Cooking, Gas and Processing of Petroleum, Chemical Industry, Manufacture of Machinery and Equipment, Transportation and postal warehousing.
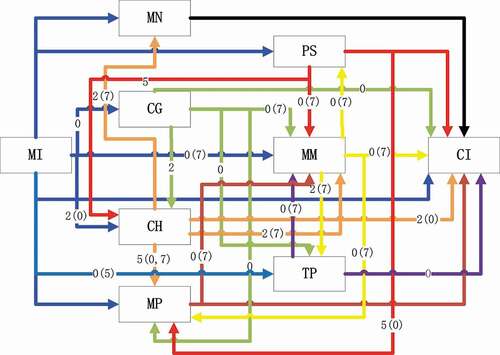
After analysing the industrial-chain network maps over years of 2007–2017, this paper points out those industries that have most stable relationships with the construction industry. They are the chemical industry, non-metallic mineral products, metal smelting and pressing processing, general, special, transportation, electrical manufacturing, the supply of electric power, steam and hot water, gas production and supply industry. shows the changes of the industrial chain from 2007 to 2017 with gaps. The numbers in parentheses indicate years when industrial linkages have significantly declined, and the numbers outside the parentheses represent years when industrial linkages have significantly increased. The numbers 0, 2, 5, and 7 represent 2010, 2012, 2015 and 2017, respectively. A line without numbers means that the industries at both ends of the line have maintained a high correlation degree in the industry chain over all research years. As shown by the figure, industries such as Mining Industry, Manufacture of Non-metallic Mineral Products, Manufacture and Processing of Metals and Metal Products, Production and Supply of Electric Power, Heat Power and Water are connected with the construction industry stably, and the correlation remains unchanged over all the research years. It indicates implicitly that these industries have been key industries promoting the development of the construction industry. Other industries, though maintaining relatively stable relationship with the construction industry, experienced some changes in their linkages with the construction industry in some years. For example, Manufacture of Machinery and Equipment. Its correlation degree with the construction industry experienced dynamic changes, increasing significantly in 2010 and declining in 2017. The changes of the industrial chains over the years show that the development of the construction industry is more dependent on Mining Industry, Manufacture of Non-metallic Mineral Products, Manufacture and Processing of Metals and Metal Products, Production and Supply of Electric Power, Heat Power and Water. Other industries, such as Manufacture of Machinery and Equipment and the industry of Cooking, Gas and Processing of Petroleum, also played a vital role in the development of the construction industry as intermediate industries. As can be seen from the figure, the industry of Cooking, Gas and Processing of Petroleum promoted the development of five industries and it also had pulling effect on one industry. The promotion effect of Manufacture of Machinery and Equipment is on four industries while its pulling influence is on six industries. On the whole, the complexity of the industrial chain is increasing indicating the correlation between different industries becomes closer. As the demand industry consuming the output of most industries, the construction industry’s pulling effect on most other industries is further enhanced.
Figure 8. The China construction industry chain network map from 2007 to 2017.
5. Conclusion and policy implication
5.1. Conclusion
This paper analyses the industrial chain of the construction industry with input–output tables of China from year 2007, 2010, 2012, 2015 and 2017. Furthermore, several industrial-chain network diagrams are stretched. The conclusions are as follows.
(1) There are eight industries that are closely related to the development of the construction industry. Among them, the economic correlation coefficients between the mining industry, the non-metallic mineral products industry, the metal product manufacturing industry and the construction industry are significantly stronger than that of other industries. The pulling effect of the construction industry on these three industries is significant. The development of these industries is strongly dependent on the construction industry.The result is in consistent with previous research (Chang et al., Citation2010).
(2) From 2007 to 2015, the economic correlation coefficients between the construction industry and most other industries that related closely to the construction industry showed an upward trend. In 2007, the correlation declined slightly. This is in line with the development trend of the construction industry. Before 2015, the ratio of the construction industry’s GDP to the country’s GDP kept on rising. But the decline trend of the ratio showed up after 2015. This indicated that the abnormal and rapid development of the real estate industry was controlled, and the country begun to pay attention to the green development of the construction industry, gradually replacing traditional energy sources with new and clean energy. In addition, green and energy-saving materials have been continuously used in construction projects; therefore, the connection degree between many industries that provide building materials and the construction industry is weakened.
(3) The increasing complexity of the construction industrial chain shows the development of every industry is related to various other industries under the context of the fast-growing modern industry. The advancement of one industry can lead to the development of multiple industries. The entire industrial chain becomes a whole and it is relatively stable.
(4) Through analyse the changes of the industrial-chain network map, this paper finds out that the mining industry, non-metallic mineral products industry, metal product manufacturing, power and heat and other industries are highly connected with the construction industry over the research years. This shows that these industries are essential for the development of the construction industry. The relationship between other industries and the construction industry is dynamically changing over these years, but on the whole the correlation is still quite close. The minimum economic coefficient is 0.17 which is quite close to the threshold value, indicating that the overall correlation degree between various industries and the construction industry is relatively high.The result is in consistent with previous research (Hong, Shen, and Xue Citation2016).
5.2. Policy implications
Based on the evolutionary analysis of the construction industrial chain in China, some policy recommendations for the development of China construction industry are proposed.
Firstly, from the macro perspective, the construction industry still makes a great contribution to the development of our country’s national economy. Its advancement pushes the development of many other industries and structure of the industrial chain is relatively stable. The government can look for industries which are closely connected with the construction industry and have shorter economic distance. These industries could be references when the industrial structure of the construction industry should be adjusted. The calculation results of this paper show that the two industries of non-metallic mineral products and metal products meet the requirements of strong correlation with the construction industry and short economic distance.
Secondly, after analysing the industrial chain related to the construction industry over the research years, this paper finds out the shortest economic distance happens between the construction industry and the non-metallic mineral products industry which offers the construction materials. Therefore, the government need to deepen the reform of the construction industry. Increase the R&D investment in the construction industry, change its development mode of high energy consumption and high pollution, and use green building materials. The ultimate goal of these measures is to achieve the high-quality and green development of the construction industry whose entire life circle should have less carbon emissions. And buildings constructed by this kind of industry should be able to provide a healthy, comfortable and natural living environment.
Finally, the government should promulgate policies to promote clean energy industry, high-tech industry, green building materials industry and other emerging industries related to the construction industry, so as to establish close ties between the construction industry and these industries, reduce the connection between the construction industry and traditional energy production industries such as mining, electric heating, promote the structural adjustment of the industrial chain, and make the construction industry continuously realize green transformation.
Disclosure of potential conflicts of interest
No potential conflict of interest was reported by the author(s).
Additional information
Funding
References
- Barber, H., Jr., and I. H. El-Adaway. 2015. “Economic Performance Assessment for the Construction Industry in the Southeastern United States.” Journal of Management in Engineering 31 (2): 05014014. doi:https://doi.org/10.1061/(ASCE)ME.1943-5479.0000272.
- C C W, H., S. C. Hsu, S. Pratt, PC chen, APC chan. 2019. “Quantifying the Linkages and Leakages of Construction Activities in an Open Economy Using Multiregional Input-Output Analysis.” Journal of Management in Engineering 35 (1): 04018054.
- Chang, Y., R. J. Ries, and Y. Wang. 2010. “The Embodied Energy and Environmental Emissions of Construction Projects in China: An Economic Input–output LCA Model.” Energy Policy 38 (11): 6597–6603. doi:https://doi.org/10.1016/j.enpol.2010.06.030.
- Chuai, X., X. Huang, Q. Lu, M. Zhang, R. Zhao, and J. Lu. 2015. “Spatiotemporal Changes of Built-up Land Expansion and Carbon Emissions Caused by the Chinese Construction Industry.” Environmental Science & Technology 49 (21): 13021–13030. doi:https://doi.org/10.1021/acs.est.5b01732.
- De Backer, K., and S. Miroudot 2014. “Mapping Global Value Chains.” European Central Bank Working Paper Series, Frankfurt. No 1677, May 2014.
- Diakantoni, A., and H. Escaith “Reassessing Effective Protection Rates in a Trade in Tasks Perspective: Evolution of Trade Policy in ‘Factory Asia’.” World Trade Organization, Economic Research and Statistics Division, Staff Working Paper ERSD-2012-13, Geneva, 2012.
- Dietzenbacher, E. 2002. “Interregional Multipliers: Looking Backward, Looking Forward.” Regional Studies 36 (2): 125–136. doi:https://doi.org/10.1080/00343400220121918.
- Dietzenbacher, E., and I. Romero. 2015. “Production Chains in an Interregional Framework: Identification by Means of Average Propagation Lengths.” International Regional Science Review 30 (4): 362–383. doi:https://doi.org/10.1177/0160017607305366.
- Dietzenbacher, E., I. Romero Luna, and N. S. Bosma. 2005. “Using Average Propagation Lengths to Identify Production Chains in the Andalusian Economy.”Estudios De Economia Aplicada 23 (1): 43–48.
- Dietzenbacher, E., and U. Temurshoev. 2008. “Ownership Relations in the Presence of Cross-shareholding.” Journal of Economics 95: 189–212. doi:https://doi.org/10.1007/s00712-008-0018-y.
- Erik, D., and I. Romero. 2007. “Production Chains in an Interregional Framework Identification by Means of Average Propagation Lengths.” International Regional Science Review 30 (7): 48–60.
- Fang, D., C. Duan, and B. Chen. 2020. “Average Propagation Length Analysis for Carbon Emissions in China.” Applied Energy 275: 115386. doi:https://doi.org/10.1016/j.apenergy.2020.115386.
- Franco, C., S. Montresor, and G. Vittucci Marzetti. 2011. “On Indirect Trade-related R&D Spillovers: The “Average Propagation Length” of Foreign R&D.” Structural Change and Economic Dynamics 22: 227–237. doi:https://doi.org/10.1016/j.strueco.2011.04.003.
- Giang, D. T. H., and L. S. Pheng. 2011. “Role of Construction in Economic Development: Review of Key Concepts in the past 40 Years.” Habitat International 35 (1): 118–125. doi:https://doi.org/10.1016/j.habitatint.2010.06.003.
- Gregori, T., and R. Pietroforte. 2015. “An Input-output Analysis of the Construction Sector in Emerging Markets.” Construction Management and Economics 33 (2): 134–145. doi:https://doi.org/10.1080/01446193.2015.1021704.
- Gundes, S. 2011. “Input Structure of the Construction Industry: A Cross-country Analysis, 1968–90.” Construction Management and Economics 29 (6): 613–621. doi:https://doi.org/10.1080/01446193.2011.563787.
- Hillebrandt, P. M. 2000. Economic Theory and the Construction Industry. 3rd ed. Basingstoke, UK: Palgrave Macmillan.
- Ho, P. H. K. 2016. ““Analysis of Competitive Environments, Business Strategies, and Performance in Hong Kong’s Construction Industry.”.” Journal of Management in Engineering 32 (2): 04015044.
- Hong, J., G. Q. Shen, S. Shan, F. Xue, and W. Zheng. 2016. “Energy Use Embodied in China’s Construction Industry: A Multi-regional Input-output Analysis.” Renewable & Sustainable Energy Reviews 53: 1303–1312. doi:https://doi.org/10.1016/j.rser.2015.09.068.
- Hong, J., Q. Shen, and F. Xue. 2016. “A Multi-regional Structural Path Analysis of the Energy Supply Chain in China’s Construction Industry.” Energy Policy 92: 56–68. doi:https://doi.org/10.1016/j.enpol.2016.01.017.
- Hosein, R., ., and T. M. Lewis. 2005. “Quantifying the Relationship between Aggregate GDP and Construction Value Added in a Small Petroleum Rich economy–A Case Study of Trinidad and Tobago.” Construction Management and Economics 23 (2): 185–197. doi:https://doi.org/10.1080/0144619042000287741.
- Ilhan, B., and H. Yaman. 2011. “A Comparative Input-output Analysis of the Construction Sector in Turkey and EU Countries.” Engineering, Construction and Architectural Management 18 (3): 248–265. doi:https://doi.org/10.1108/09699981111126160.
- Lam, K. C., and O. S. Oshodi. 2016. “Using Univariate Models for Construction Output Forecasting: Comparing Artificial Intelligence and Econometric Techniques.” Journal of Management in Engineering 32 (6): 04016021. doi:https://doi.org/10.1061/(ASCE)ME.1943-5479.0000462.
- Leontief, W. W. 1936. “Quantitative Input and Output Relations in the Economic Systems of the United States.” The Review of Economics and Statistics 18 (3): 105–125. doi:https://doi.org/10.2307/1927837.
- Lopes, J., L. Ruddock, and F. L. Ribeiro. 2002. “Investment in Construction and Economic Growth in Developing Countries.” Building Research & Information 30 (3): 152–159. doi:https://doi.org/10.1080/09613210110114028.
- Lu, X., and J. Xu. 2013. “Explaining the Changes in ALPs by Identifying ALPs-Important Coefficients: An Empirical Application of China.” Journal of Systems Science and Complexity 26 (3): 383–406. doi:https://doi.org/10.1007/s11424-013-1076-y.
- Oosterhaven, J., and M. Bouwmeester. 2013. “The Average Propagation Length: Conflicting Macro,Intra-industry,and Interindustry Conclusion.” International Regional Science Review 36 (4): 481–491. doi:https://doi.org/10.1177/0160017613486670.
- Pietroforte, R., T. Gregori, and M. Falagario. 2009. “The Changing Input Structure of the US Construction Industry: A Longitudinal Analysis.” Construction Management and Economics 27 (11): 1089–1098. doi:https://doi.org/10.1080/01446190903280443.
- Polenske, K. R., and P. Sivitanides. 1990. “Linkages in the Construction Sector.” The Annals of Regional Science 24 (2): 147–161. doi:https://doi.org/10.1007/BF01579729.
- Reis, H., ., and A. Rua. 2009. “An Input-output analysis:Linkages versus Leakages.” International Economic Journal 23 (4): 527–544. doi:https://doi.org/10.1080/10168730903372323.
- Song, Y., C. Liu, and C. Langston. 2006. “Linkage Measures of the Construction Sector Using the Hypothetical Extraction Method.” Construction Management and Economics 24 (6): 579–589. doi:https://doi.org/10.1080/01446190500435358.
- WBCSD. 2009. Transforming the Market: Energy Efficiency in Buildings. Geneva: World Business Council for Sustainable Development.
- WGBC. 2010. Tackling Global Climate Change. Meeting Local Priorities: A World Green Building Council Special Report. Toronto, Canada: World Green Building Council.
- Yan, J., T. Zhao, T. Lin, Y. Li. 2016. “Investigating Multi-regional Cross-industrial Linkage Based on Sustainability Assessment and Sensitivity Analysis: A Case of Construction Industry in China”. Journal of Cleaner Production 142: 2911–2924. doi:https://doi.org/10.1016/j.jclepro.2016.10.179.
- Ye, A.-N., and M. Zhang. 2019. “Research on Agricultural Industry Chains Based on Average Propagation Lengths—Taking Heilongjiang Province as an Example.” Journal of Mudanjiang University 28 (10): 1–4+21.
- Zhang, L., B. Liu, J. Du, C. Liu, H. Li, S. Wang. 2020. “Internationalization Trends of Carbon Emission Linkages: A Case Study on the Construction Sector”. Journal of Cleaner Production 270: 122433. doi:https://doi.org/10.1016/j.jclepro.2020.122433.
- Zhang, L., B. Liu, J. Du, C. Liu, S. Wang. 2019. “CO2 Emission Linkage Analysis in Global Construction Sectors: Alarming Trends from 1995 to 2009 and Possible Repercussions.” Journal of Cleaner Production 221 (1): 863–877. DOI:https://doi.org/10.1016/j.jclepro.2019.02.231.