
ABSTRACT
Designing urban landscapes for climate change adaptation and mitigation has been highly promoted in contemporary urban development. However, the lack of climate-based design knowledge and techniques in existing urban landscape practice has challenged the implementation. This paper, therefore, introduced a climate-led urban landscape design method to overcome such a dilemma. This approach was results-oriented, and it adopted an integrated use of microclimate, thermal comfort, and GIS modelling and simulation tools. Through the scenarios comparison, this paper has assessed and figured out efficient landscape designs for microclimate and thermal comfort improvement in Ipoh, Malaysia. It showed that shading most determined outdoor thermal comfort, making effective street tree planting an essential measure in the tropical climate-led plan. Besides, this study found that wind did not positively influence thermal comfort due to site characteristic at a particular time, in contrast with other hot regions. In conclusion, developing climate-led landscape and greenery in urban design is a functional initiative for urban cooling and sustainable urban development. Furthermore, the application of modelling and simulation methods in urban landscape design can reduce the possibility of failure in practice, thereby promising urban efficiency in response to climate change.
1. Introduction
With the evolution of cities, urbanists have come up with different urban growth models and continuously worked to cope with the prevailing issues and demands through urban planning and design. Coming to the 21st century, it comes to the rise of urban landscape development. Urban landscapes, which usually refer to open spaces, are always associated with greenery and nature. Rather than simply regarding landscapes as urban ornaments scattered at left-over areas of cities, urban professionals now more view a city as “an infinite series of landscape” (Turner Citation1996), unlocking the limitations of landscapes in terms of function and context for urban sustainability (Alizadeh and Hitchmough Citation2019; Keshtkaran Citation2019). This ideological change put landscapes in a more pivotal position in current urban planning and design. Nowadays, urban landscapes are essential to be viewed as the image and quality of cities, representing the local lifestyle and living standard.
The era of climate change continues to extend the notion of landscapes in the urban context. Other than connecting people, buildings, and urban infrastructures of the city, urban landscapes play multiple roles in the synergy between climate and cities. There are increasing studies on the cooling effects of blue-green spaces in urban areas, i.e., water bodies and greenery (Li et al. Citation2020; Shi et al. Citation2020; Yu et al. Citation2020). The landscape elements were either studied altogether or separately using different approaches, ranging from in-situ field measurement to remote sensing observation and modelling and simulation (Bherwani, Singh, and Kumar Citation2020). Several studies (e.g., Ampatzidis and Kershaw Citation2020; Jacobs et al. Citation2020; Wu et al. Citation2020; Yu et al. Citation2020) have reported that the cooling effect of urban water bodies (rivers, lakes, etc.) is relatively lower than that of urban greenery. These studies also revealed that the cooling intensity of urban water bodies is strongly influenced by the surrounding land cover, mainly vegetation, implying that urban cooling still counts on urban greenery at last.
The magnitude of cooling contributed by urban greenery usually depends on their coverage and distribution (sometimes also called greenery abundance) (Ouyang et al. Citation2020; Shah, Garg, and Mishra Citation2021). In summer and hot regions, landscape greenery affects microclimate through temperature, wind and humidity modification. First, tree canopies provide shading, blocking a substantial amount of incoming short-wave radiation by reflection and transmission through their leaves (Wong et al. Citation2021). At the same time, the tree canopies could intercept the long-wave radiation reflectivity from the ground to the atmosphere (Lee, Mayer, and Chen Citation2016; Louafi, Abdou, and Reiter Citation2017; Kong et al. Citation2017; Zhao, Sailor, and Wentz Citation2018). Other than that, the evapotranspiration of leaves helps reduce the surrounding temperature by converting sensible heat into latent heat and increased relative humidity (Chàfer et al. Citation2020; Wong et al. Citation2021). The cooling effects of vegetation through evapotranspiration and shade provision made them the most popular measure suggested to counterbalance urban heat in hot and humid regions (Duarte et al. Citation2015; Stanley, Helletsgruber, and Hof Citation2019).
On the other hand, trees influence local wind characteristic on the near-surface layer in cities. They are efficient in reducing the wind speed and penetration, impeding the airflow and even altering the wind direction in some cases (Lee, Mayer, and Chen Citation2016; Kong et al. Citation2017; Gunawardena, Wells, and Kershaw Citation2017). The impacts of trees on wind performance, in this case, are rather two-sided as the wind effects were open to both positive and negative interpretations in microclimate and human comfort improvement. Most studies supporting wind as a positive factor in urban microclimate and human comfort improvement were conducted in coastal cities (e.g., Morris, Simmonds, and Plummer Citation2001; Emmanuel and Johansson Citation2006; Priyadarsini, Hien, and David Citation2008; Rajagopalan, Lim, and Jamei Citation2014; He, Ding, and Prasad Citation2020a, Citation2020b). Based on their findings, the moisture-bearing sea breeze usually associated with lower temperature and higher humidity, which is conducive to the microclimate and human comfort.
However, some studies found that the influence of wind is not always positive in tropical regions or during summer. For example, Anjos et al. (Citation2020) found that sea breeze in Aracaju of Brazil could negatively impact outdoor thermal comfort if exposed to higher solar radiation and temperature. In the viewpoint of human comfort, Yin et al. (Citation2012) emphasized that the positive thermal perception by the wind in the shade was stronger than that under the sun during summer in Nanjing of China, indicating a joint consideration with solar radiation and temperature in determining the cooling perception of wind. Similarly, Cheng and Ng (Citation2006) also highlighted the interrelation of shade and wind speed in providing pedestrian comfort in Hong Kong during summer, recommending a wind speed ranging from 1.0 to 2.0 m/s under shade. Some studies, such as Berkovic, Yezioro, and Bitan (Citation2012), even showed that wind contribution in a hot arid climate was limited and insignificant compared to shade contribution. Also, Lu et al. (Citation2017) found that a higher wind speed would reduce the intensity and coverage area of the park cooling island (PCI) in Chongqing, China. Such a viewpoint was consistent with the findings of Buyadi, Mohd, and Misni (Citation2013 &, Citation2014) in Malaysia, which found that the greenery cooling effect could be gradually dissipated by the wind, and ultimately limited within 500 m from the green source.
In view of the fact that urban landscape and greening can simultaneously reduce urban warming and its adverse impacts on cities, it has been strongly recommended to put them as one of the key measures for climate change adaptation and mitigation (Lenzholzer and Brown Citation2013; Klemm, Lenzholzer, and Van Den Brink Citation2017; Pauleit et al. Citation2017; Yang, Lin, and Li Citation2018). In order to accurately tackle the issues, this paper suggested using a “climate-led” design approach for urban landscape and greenery planning and design. This concept is quite similar, but ahead of the existing climate-related design concepts, as compared below:
“Climate-responsive”, which originated from architecture, usually refers to the consideration of climatic factors in the design of buildings, such as seasonality, intensity of the sun, wind, rainfall and humidity (Malekafzali Citation2017). Based on Hyde (Citation2000), this concept aimed to “minimize environmental impacts of buildings through selecting an appropriate response to the climate”.
“Climate-sensitive” is also related to building design, mainly considering the impacts of buildings on the surrounding microclimate, especially the carbon dioxide emission or any human-induced warming (Humphreys and Browman Citation2017).
“Climate-proof” is often used to evaluate the urban capacity on vulnerability, risk potentials, climate change mitigation and adaptation from a regional perspective (Albers et al. Citation2015). Therefore, it is usually used in urban policy planning instead of urban design.
The terms mentioned above sound comparatively passive when they are applied to climate-based landscape design. Rather than being placed in a passive position like buildings, the climate-led landscape design approach instead takes the initiative to regulate the urban thermal condition. It also represents an active urban design initiative, including but not limited to subjects related to climate or thermal issues. The open approach leads urban designers and planners towards a more comprehensive, integrated and multi-dimensional goal to create a more comfortable and sustainable urban living environment in the era of climate change. Through proper climate-led landscape planning and design, it is expected that urban landscape could improve both urban microclimate and indoor thermal comfort. At the same time, it could also promote walking activities and healthy lifestyles, reduce automobile use, encourage social interactions, revitalize streets and public space, and ultimately bring positive returns to urban vitality and economic growth (Reiter and De Herde Citation2003; Litman Citation2004; Nikolopoulou and Lykoudis Citation2007; Lunecke and Mora Citation2018; Zhang et al. Citation2020; Zhen et al. Citation2020).
However, implementing climate-led urban planning and design in current urban practice remains a challenge. Unlike most existing urban landscape projects that used to be formulated for ecological or recreational purposes (Pauleit et al. Citation2017), climate-led landscape projects are relatively new and complex for existing urban practitioners; in this case, the urban designers and planners. This approach requires both climate and landscape design knowledge and techniques as the basis. The integration is necessary because the climate-based design is not a standalone concept but a latent and auxiliary concept embodied in urban landscape planning and design. The idea, therefore, should always be in accordance with local planning and development.
So far, the insufficient climate knowledge and competence of urban designers and planners (Wamsler, Brink, and Rivera Citation2013; Zölch et al. Citation2016) has become a major obstacle in the initiation of climate-led urban planning and design. In many cases, there was a lack of scientific justifications on landscape cooling efficiency before implementation, no matter in terms of design component selection, allocation or arrangement (Tan, Lau, and Ng Citation2016; Zhao, Sailor, and Wentz Citation2018). Besides, the overuse of academic jargon in academic papers has also widened the communication gap between the academic and professional group, hindered the transformation of research knowledge into practice (Goodman, Freestone, and Burton Citation2017; Hurley, Taylor, and Phelan Citation2017). Therefore, this study aimed to develop a climate-led urban design framework for tropical urban landscapes and greenery development. To bridge the existing knowledge and technical gap, this study suggested enhancing the climate-responsive insights and planning capabilities of urban practitioners by leveraging climate-based simulation tools in the urban design process. The process, as well as the design options, should be data-driven and result-oriented so that it can enable urban practitioners to effectively deal with microclimate subjects throughout the process of planning and design.
2. Material and methodology
2.1. Study area: Ipoh
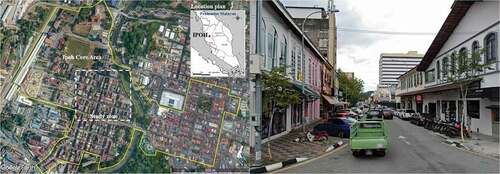
This study demonstrated the operational framework using a case study conducted at Ipoh, a city located in the Northern part of Peninsular Malaysia. Like other cities in tropical regions, Ipoh’s climate is featured with intensified sun radiation, high air temperature and relative humidity, and low wind velocity (Ghaffarianhoseini et al. Citation2019). The hot climate has created a high level of thermal discomfort for pedestrians (Thani, Mohamad, and Abdullah Citation2013), significantly reducing people’s willingness to walk or have outdoor activities in tropical cities during hot hours of the day.
In Ipoh, the old town is a historic district built during the colonial period at the beginning of the last century. Nowadays, the well-preserved colonial buildings and shophouses have become the local features that attract tourists and investment, revitalizing pedestrian activities in the town. However, the shophouses zone is a high built-up area dominated by hard surfaces with scattered trees (), creating thermal discomfort for pedestrians during hot hours. In order to enable long-term positive growth in Ipoh old town, this study focused on facilitating pedestrian-oriented development by improving both landscape and climate conditions on-site.
Figure 1. The overall layout and typical view of the study area in Ipoh.
2.2. Simulation model and process
In order to ensure that all urban design components can be well-positioned for climate purpose, simulation-based microclimate and thermal comfort analysis ran through the entire operational chain, that is, from the process of analysis, design, evaluation, to decision-making. There was a total of three main phases for the entire process. The first part was to stimulate and evaluate the existing microclimate condition. The second stage was to design the scenarios with two considerations: the undesirable thermal conditions found in the first phase, and other non-thermal site problems. Currently, the study area has become a popular tourist attraction in Ipoh because of its historical buildings, murals and local cuisines. However, the existing inconsistent sidewalk could not accommodate a large volume of walking visitors, increasing the human-car conflicts on site. Furthermore, these sidewalks were not fully connected, and visitors sometimes had to either use the shophouse corridor or walk along the roadside.
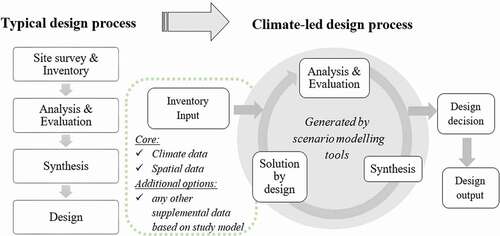
On the other hands, cycling has become another urban trend. However, unfortunately, the local cyclists could only freely ride their bicycles at the designated area in the town on irregular car-free days. These two problems did not directly affect local microclimate and thermal comfort, but they could reduce the dependence on cars, ultimately positively affecting the urban thermal environment. In this case, urban designers and planners would notice and integrate these non-thermal considerations during design for a more comprehensive climate-led landscape plan. In the last stage, the thermal performance of design scenarios would be tested, compared and verified repeatedly by simulation. With the support of computational tools, climate-led considerations can be explicitly integrated into the local landscape master plan through loop analysis of design ideas, thereby immensely consolidating the final design decision ().
Figure 2. The schematic diagram demonstrated the process of using scenario modelling for climate-led planning and design.
ENVI-met simulation was adopted in this study because of its high reliability discussed in past urban thermal studies (e.g., Zölch et al. Citation2016; Saito, Said, and Shinozaki Citation2017; Sodoudi et al. Citation2018). Besides, several past thermal studies in Malaysia showed that the combination use with GIS helped to integrate and analyze thermal data (Buyadi, Mohd, and Misni Citation2013, Citation2014; Syahidah, Zaki, and Razak Citation2015; Saito, Said, and Shinozaki Citation2017; Zaki et al. Citation2020), creating a more holistic evaluation and visualization of thermal performance. Therefore, this paper suggested coupling ENVI-met with other geospatial modelling tools, namely the computer-aided design (CAD) software and geographic information system (GIS) software, before and after the simulation stage. The geospatial-based tools were used to support the pre-simulation model area building, and the post-simulation evaluation works. Their role in this study was to solve the deficiencies of the ENVI-met tool in the climate-led planning and design process. ENVI-met software alone is insufficient to manage most integration works in the urban planning and design process. It is purely working on microclimate simulation and visualization, and it does not provide climate-spatial data synthesis, management, or retrieving functions. Moreover, ENVI-met itself is designed for microclimate simulation according to CFD theory in environmental engineering. The engineering software model conventionally runs in a raster format, making it less flexible in modification than vector format (the graphic format that urban designers are familiar with). The format discrepancy would hinder urban planning and design progress in practice when majority design works involved multiple amendments before the final plan.
To set up a model area for ENVI-met simulation, it was first to create the model area using CAD software and then imported the layout to a GIS platform. In GIS, the authors constructed an attribute database for all spatial elements (shapefile), including the building height, vegetation classification, and land surface material. Next was the model file extension conversion. All shapefile data were converted to raster format and exported as ASCII files, and further modified using file extension modifier to become the area input file of ENVI-met simulation (INX). Each grid cell in the area input file presented the physical properties depicted in layers, such as the building height, vegetation, and land cover properties.
In ENVI-met, to run a simulation, it was necessary to build up the model configuration, namely “simulation file” (SIMX) (Bruce Citation2020a &Citation2020b). The simulation configuration was created to define a simulation task, including a 3-D model (the INX file), the meteorological settings, and other simulation details such as the naming of input and output files, time duration and starting time. After completing the ENVI-met simulation, the output data was redirected back to the GIS platform for further evaluation. The process was repeated once the scenario was amended after analysis.
Other than assessing microclimate performance, this study also examined human thermal comfort using the index of physiological equivalent temperature (PET). To calculate the PET, the authors used RayMan, a software tool developed by Matzarakis, Rutz, and Mayer (Citation2007 &, Citation2010). The calculation of PET generally involved six main variables: air temperature (°C), mean radiant temperature (°C), wind speed (m/s), relative humidity (%), clothing (clo), and metabolism (W). However, some additional inputs were considered in the RayMan software for more comprehensive thermal comfort indices calculation, including surface temperature in PET simulation. The output of ENVI-met would support the climate input. As for the personal data input, this study followed the index values used in the previous thermal studies of Malaysia, and to be explained in the next section. The overall workflow was designed and presented in an integrated and clear operational framework (). It was expected to minimize technical issues facing by non-expert model users, in this case, the urban designers.
Figure 3. The loop of workflow for the overall study.
2.3. Scenario design
Based on the adopted framework, there was a total of three scenarios presented in this paper (). The design scenarios were assumed to change landscape design, land surface materials and street networks without modifying the existing structure layout. Scenario 1 acted as the baseline model, mainly used to capture the existing thermal condition, derive insights to improve such a situation, and enable comparison between original and modified baseline models. Scenario 2 was designed to achieve maximum greening for the model, therefore maximally adding trees along the streets and changing the surface materials of parking lots and walkways to green pavers. The existing sidewalks were also extended from 1.5 m to 2–2.5 m in width to include the planting zone and accommodate more pedestrians. Other than that, the greening plan also involved the improvement of pedestrian walkway connectivity, the promotion of full pedestrian zones, and the introduction of bicycle lane routes. Scenario 3 coincided with Scenario 2, but it has been modified with the premise that the design team needed to secure and prioritize the views of heritage buildings and murals. This scenario aimed to conserve the landscape identity of Ipoh old town in terms of visibility. The heritage facades and murals were referred to as point-of-interest (POI) in the study. Plants, especially trees, should not block the views of these POIs at the pedestrian level ().
Figure 4. The scenario models extracted from GIS used for climate simulation in this study.
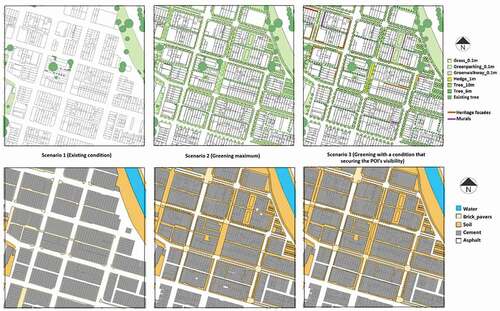
Figure 5. Greening recommendation for POI and adjacent areas (Plans were extracted from Scenario 3).
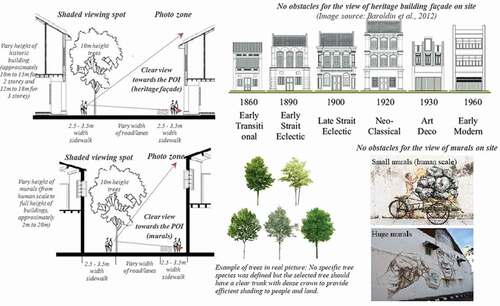
For simulation purposes, existing trees on site have been simplified into three categories: trees with heights of 10 m, 15 m, and 20 m (Refer to ). In the design process, a planting standard for additional vegetation has also been created, including 3 m crown diameter for 6 m height trees, 5 m crown diameter for 10 m height trees, 1 m height for shrubs, and 0.1 m height for grass (also Refer to ). No specific plant species were studied. However, the trees should be dense and continuously planted in the same interval, following the finding presented in Zhao, Sailor, and Wentz (Citation2018). The land cover considered in the simulation included soil, concrete, asphalt, brick paver, and water. In this study, grasscrete paver was introduced for pedestrian walkways and parking areas. Since grasscrete is a type of void-structured concrete in which voids are filled with turf soil and allow water to pass through the concrete, it was considered the same as “grass” in the simulation. Before the simulation stage, based on , it can be seen that the greening level of Scenario 1, Scenario 3, and Scenario 2 ranged from the lowest green coverage (existing condition) to the highest green coverage conditions. The thermal pattern and discrepancy, especially between Scenario 2 and 3, need to be further verified by the simulation.
Table 1. Summary of configuration data used in the ENVI-met simulation
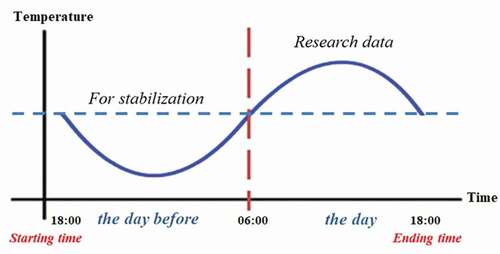
For ENVI-met simulation, a 350 m x 350 m x 70 m area was modelled for the present study, with a model grid resolution of 2 m x 2 m x2.5 m in dx, dy, and dz directions, respectively. The overall configuration for simulation was shown in . The simulation was set for June 21st, 2018, the summer solstice that represented the longest daytime of a year (Chen and Ng Citation2013; Saito, Said, and Shinozaki Citation2017). The total simulation time was 24 hours, starting from 18:00 on the previous day (June 20th). A 12-hours-period was allocated to stabilize the model before the authors collected the data from 0600 to 1800 on the day (). From there, a vast amount of hourly data was generated, organized, and stored in different files, automatically. Despite that, in this paper, the authors specifically analyzed the data at 14:00, the hottest hour of the day recorded in measured data. This study also explicitly extracted data at 1.75 m above the ground, which is the level closest to a typical pedestrian’s height.
Figure 6. The numeric simulation data can be more stable and accurate if the calculation followed the atmospheric process in advance and started at night , assuming that the tested environment has been completely cooled down before sunrise.
The extracted output data for microclimate analysis included air temperature, mean radiant temperature, surface temperature, wind speed, and relative humidity. The simulation data were also used as input data for PET calculation in RayMan software. As for personal data, it referred to the site context and a case study done in Malaysia (i.e., Saito, Said, and Shinozaki Citation2017), as presented in . In order to evaluate the PET outputs accordingly, this study used the thermal comfort classification standard proposed by Lin and Matzarakis (Citation2008), which has been modified explicitly for tropical regions (refer to ).
Table 2. Input parameters required for PET calculations
Table 3. Thermal comfort classification used for the tropical region (Source: Lin and Matzarakis Citation2008)
3. Results
Through the scenario designs and study process mentioned in Section 2, the output was extracted and presented in graphs and maps for further evaluation. The evaluation in this stage was based more on the viewpoint of urban planning and design.
3.1. Lessons from the existing situation
To understand the correlation between climate factors and thermal comfort (PET) on-site, the study first extracted the output of Scenario 1 (baseline model – existing condition at 14:00 on the height of 1.75 m) for multivariate correlation analysis. The statistical outcomes have helped to determine the correlation and weight of each climate variable that affected the current thermal conditions in Ipoh old town. According to the results shown in , the mean radiant temperature (Tmrt = 0.9795) most affected PET. also showed that all climate variables were positively correlated to thermal comfort (PET), except the relative humidity (RH).
Figure 7. The multivariate correlation analysis.
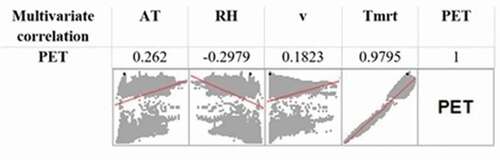
It should be noted that wind has a critically weak correlation with PET (0.1823, which lower than 0.2), showing a low impact on PET in this study. Nevertheless, the wind had a positive correlation with PET in this study, showing that it is not a contributory factor for thermal comfort in Ipoh downtown. The phenomenon could be explained by the thermal characteristic of incoming air in this study. Based on the existing condition shown in , the air temperature in the direction of incoming air (wind direction: 45°) at 14:00 was relatively high due to the high openness to direct solar radiation. The high temperature would heat the incoming air before it flowed into other parts of the study area.
Figure 8. Comparison of climatic factors between scenarios.
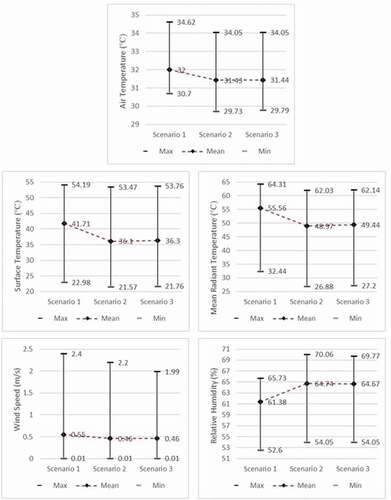
Figure 9. Comparison between air temperature distribution.
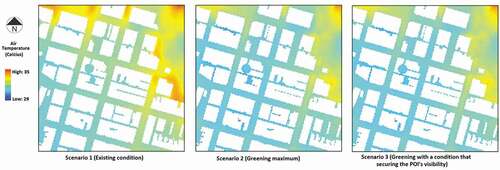
Moreover, the site was located at the centre of the city, not only surrounded by a massive built-up area (within a few kilometres) but also far away from the sea breeze (approximately 55 km in diameter from the nearest coast). The moisture-bearing air molecules from outside the city might have been gradually heated and evaporated when they moved along the near-surface layer in the city, especially during the hottest hour of the day. In such a situation, the incoming air directed by the prevailing wind was not necessarily cooler than those inside the site. On the other hand, as shown in the existing condition of , the thermal condition in most of the small lanes and alleys on-site have performed better than the surrounding. The incoming hotter wind would accelerate the cooler air dissipation in this case.
Figure 10. Comparison between mean radiant temperature distribution.
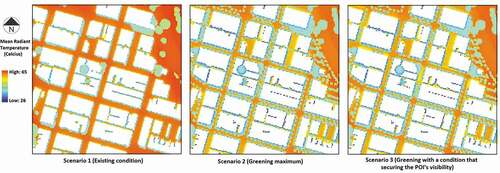
Figure 11. Comparison between surface temperature distribution.
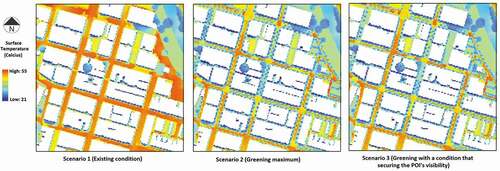
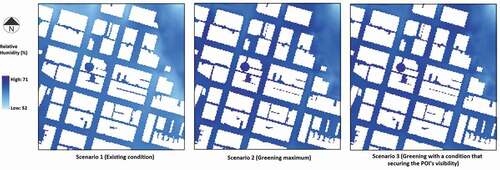
Figure 12. Comparison between relative humidity distribution.
Overall, to improve thermal comfort in Ipoh downtown, attention should be paid to increasing relative humidity and reducing other parameters, especially the mean radiant temperature. This analysis provided explicit instructions for the coming design stage.
Besides, this study has collected several design insights for developing the landscape of Ipoh old town. First, the street pattern and building compactness have played a significant regulatory role in this area. The shadow of compact buildings provided full shading that effectively cooled down the land and building surface, leading to a lower degree in mean radiant temperature and surface temperature. Simultaneously, the compact buildings blocked the outside hot air from entering those small lanes and alleys during hot hours, which helped maintain higher relative humidity in these areas all the time. In view that small lanes and alleys have been more thermally comfortable than other areas in the model, it suggested that small lanes and alleys in the town should be prioritized for pedestrian development. They have advantages not only in terms of thermal comfort but also for pedestrian safety. There would be fewer conflicts with vehicle traffic, providing a comfortable and safe walking area for pedestrians.
Second, street tree planting would be the most direct and appropriate measure for cooling Ipoh old town. It showed that those locations where dense trees were planted have a significant drop in mean radiant temperature and surface temperature. The results proved that they did provide effective shading, evaporation, humidity and heat reflectivity, thereby effectively cooling their coverage. The street trees also have blocked and altered the airflow, and this helped to minimize wind speed and reduce heat transfer around the town. To further improve the thermal condition, mean radiant temperature and surface temperature should be reduced by changing more hard surfaces to natural surfaces. The increase of natural surface would help to reduce temperatures to a maximum extent.
3.2. Design output: microclimate aspect
This section first assessed and compared all scenario models regarding their minimum, maximum, and mean values in climatic performances. summarised and compared the climate performance in the aspects of air temperature, mean radiant temperature, surface temperature, wind speed, and relative humidity. According to , all climatic factors have been improved to certain degrees through proposed landscape models, proving that a climate-led landscape plan can indeed effectively ameliorate the local microclimate. In this case, the mean radiant temperature was most improved. It dropped more than 6°C on average, from 55.56°C to 48.97°C in Scenario 2 and 49.44°C in Scenario 3. The surface temperature also averagely reduced about 5°C, from 41.71°C to 36.1°C in Scenario 2 and 36.3°C in Scenario 3, immensely cooling the urban surfaces. Overall, the outcomes were in line with expectations; that is, the proposed landscape models have successfully increased site humidity and reduced the temperatures and wind speed. There was no significant gap between the results of Scenario 2 and 3.
Next, the microclimate distribution patterns – before and after designs – were studied through mappings. This process enabled us to visually analyze the effectiveness of climate-led landscape on-site and identify the problematic locations. showed that Scenario 2 and Scenario 3 had a significant decline in overall air temperature compared to Scenario 1. However, there was no significant discrepancy between Scenario 2 and 3, indicating that their differences in design were insignificant to affect overall air temperatures.
Different from air temperature, the mean radiant temperature and surface temperature distribution patterns changed dramatically before and after designs. show that temperatures have been reduced drastically to an acceptable level by adding greenery in Scenarios 2 and 3 (coloured in green and blue on the maps). The overall area was significantly cooled down because of the denser greenery. Besides, through the comparison at POI areas, where the trees in Scenario 2 were replaced with shrubs and grass in Scenario 3, this study concluded that trees possessed the optimum cooling effect, followed by shrubs, then grass.
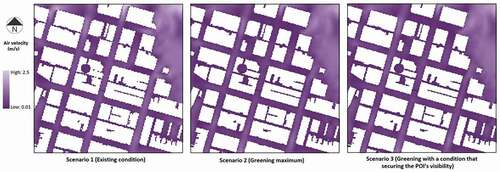
In the comparison of relative humidity, it found that the presence of dense vegetation could significantly increase the air moisture level, so to the overall relative humidity (). Besides, the rows of trees also positively influenced wind pattern. The consistent and continuous tree planting along streets has stabilized and reduced the wind flow on-site (). The air along the building’s sidewalks has become calmer and cooler with the addition of trees.
Figure 13. Comparison between wind speed distribution.
3.3. Design output: thermal comfort aspect
showed that climate-led landscape plans also greatly improved pedestrian thermal comfort on-site. Overall, PET mean value was reduced about 3°C, from 44.72°C to 40.85°C in Scenario 2 and 41.11°C in Scenario 3. In this case, the average thermal comfort had been improved from “very hot” (>42°C) to “hot” condition (38–42°C) before and after designs, which considered a great improvement at the hottest hour of the day (refer to ). The distribution changes of PET and thermal comfort level are shown in , respectively. These figures also illustrated that thermal comfort was mainly improved by the dense planting along the streets. It required at least one row of trees at small lanes, two rows of trees for one-way roads, and three rows of trees for two-way roads, and coupled with shrubs, grass and grasscrete pavers. Under these treed areas, thermal comfort level dropped rapidly from “very hot” to “warm” condition (), relieving pedestrian thermal discomfort to a great extent.
Figure 14. Comparison between the thermal comfort level.
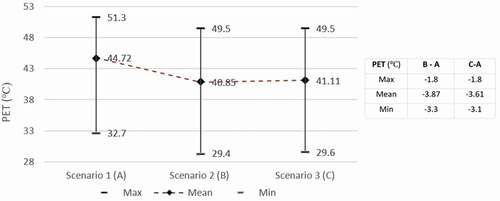
Figure 15. Comparison between the PET distribution.
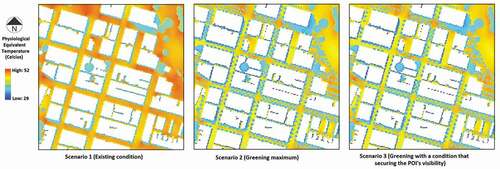
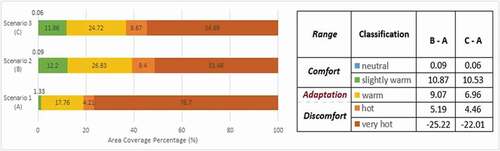
Figure 16. Comparison between thermal comfort level.
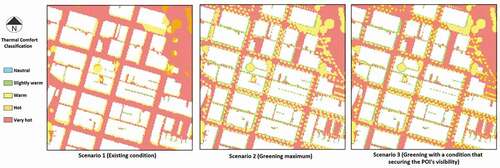
In summary, both proposed landscape models have significantly increased the coverage ratio of comfort zones, from 1.33% (Scenario 1) to 12.29% in the maximum greening model (Scenario 2) and 11.92% in the conditional greening model (Scenario 3). The PET results showed that the majority area was still not acceptable as comfort zones, but at least, the range of extreme conditions was significantly reduced. As showed in , the ratio of “very hot” area (above 42°C) was declined from 76.70% (Scenario 1) to 51.48% in the maximum greening model (Scenario 2) and 54.69% in the conditional greening model (Scenario 3). In other words, more than 22% of the PET coverage area (that is, the total non-building area) has been improved and cooled in the study. At the same time, the “warm” area has been dramatically increased and occupied approximately 25% of the PET coverage area (26.83% in Scenario 2 and 24.72% in Scenario 3). This achievement was worth mentioning because the past thermal comfort studies in Malaysia have indicated that the respondents could adapt to the “warm” condition rather than the “comfortable” range of PET, and they viewed “warm” as an acceptable thermal condition (Makaremi et al. Citation2012; Nasir, Ahmad, and Ahmed Citation2012). Finally, referring to , most pedestrian-access areas (sidewalks and the pedestrian plaza) were within either a comfortable or acceptable range after design, indicating that the goal of providing pedestrians with optimal thermal comfort was ultimately achieved. All outcome showed that both proposed landscape models were practical for alleviating thermal discomfort in Ipoh old town.
Figure 17. Comparison between the coverage ratio based on thermal comfort classification.
4. DISCUSSION
The overall study process showed that the urban landscape design for thermal improvement is not impromptu but planned, especially the planting scheme. During scenario design, several scenarios of planting schemes and landscape layout were tested in advance to calculate the highest greening ratio. The design was repetitively revised before the simulation process to make it more compatible with the site context. In this study, PET has significantly been improved overall, except for the middle area of open roads. These areas were kept unchanged for traffic purpose and accounted for a high proportion of the entire coverage area, resulting in a relatively high PET average. Given that, it should be acknowledged that the degree of site improvement should not be based on the average outcomes but rather on pedestrian areas. This was because it is difficult to convert the entire area into a comfortable area during the hottest time of the day in a tropical city. PETs at pedestrian-access areas were relatively low and within a comfortable or acceptable range. Under the climate-led approach, it has not only improved the thermal condition of targeted areas but also enhanced pedestrian connectivity, created full pedestrian zones and bicycle trails, and conserved the visibility towards heritages.
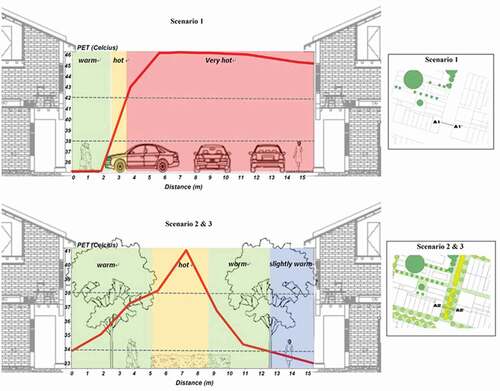
In the scenario study, street tree planting has played a crucial role in regulating urban heat due to limited open spaces in the study area. The result showed that the efficiency of tree planting on cooling effects is always proportional to its allocation, especially in terms of layout pattern, density, and continuity. The location and quantity of trees played a crucial role in determining the degree of thermal improvement. Through a sectional perspective (), the degree of thermal comfort improvement before and after using climate-led design was clearly illustrated.
Figure 18. The cross-section showed the thermal comfort improvement (at the pedestrian level of 1.75 m) after a road was transformed into a vegetated pedestrian zone.
Finally, all scenarios were reviewed to determine the most suitable model for Ipoh old town climate-led landscape plan. It was mainly according to the cooling effect of greening in both microclimate and thermal comfort assessments. As expected, the best cooling effect was achieved through Scenario 2 (maximum greening model), which has the highest green coverage ratio compared to other scenarios. The weakness of Scenario 3 indeed occurred around POI, where having less or no trees (refer to ). This finding did enhance tree planting as the most useful measure to improve the microclimate and thermal comfort in tropical cities like Ipoh. Despite Scenario 2 performed better in terms of thermal improvement, Scenario 3 covered more considerations for local landscape redevelopment. It is worth noting that Scenario 3 provided positive countermeasures with no matter in terms of thermal comfort improvement or the landscape design for the historical urban context. More importantly, this study did not find any notable discrepancy in the overall cooling effect between Scenario 2 and 3. Therefore, in this case, it most recommended Scenario 3 as the appropriate model for Ipoh old town landscape.
5. Conclusion
In summary, this paper has affirmed the prominent role of urban landscapes and greenery in facilitating tropical urban microclimate and thermal comfort. Most of the thermal improvement was associated with vegetation, particularly with the presence of trees. The continuous or dense street tree canopies can create efficient shading and cooling, providing thermal comfort to the greatest extent at the pedestrian level. In this study, trees had a negative effect on wind speed, but this instead effectively slowed the entry of hot incoming air into the study area during hot hours. The low wind speed between shade trees and buildings reduced cool air dissipation, allowing them to be effectively retained on site. Once the overall air temperature started to drop on-site, open roads play an important role in directing cool air from the treed zone to the adjacent area. This paper, therefore, also consolidated the necessity of proper tree planting in tropical urban planning and design to cope with climate change.
Overall, this paper was a quick-start guide explaining how microclimate and thermal comfort considerations can be integrated into urban planning and design, specifically from a climate-led design perspective. It is an interdisciplinary study beyond the scope of pure climate physics and human physiological science. The workflow is consistent with the design science research (DSR) process widely used in the engineering field, in line with a collaborative mindset to increase problem-solving intelligence in the planning process.
The integrated use of modelling and simulation tools (GIS and ENVI-met) in climate-led urban design has enabled a better exploration of design ideas. In short, they can help to define the site thermal problem more precisely, assist in testing the hypothetical climate-led designs, and offer theoretical explanations of any phenomena related to designs. Compared to conventional field survey, the modelling and simulation approach takes advantage of time and labour cost-saving. By running scenario simulations, urban designers and planners can predict and foresee how a design affects temperature, wind field, and relative humidity, ultimately influencing thermal comfort. This kind of result-oriented evaluation can provide more evidence-based insights for thermal resilience strategies in the urban planning design process, thereby minimizing potential design failures during implementation in practice.
This study has tried to solve ENVI-met limitations by coupling the tool with other applications, but it was limited to the pre-and post-simulation stage. Conducting a city-scale simulation in ENVI-met remained several limitations. First, the authors had to simplify the city model for simulation troubleshooting by adjusting the geometry of complex buildings to a more simple configuration. Secondly, the model details might be biased when the data was converted from vector to raster format, depending on the raster cell size. Larger domains require larger raster pixels, which can easily lead to the loss of details. Otherwise, running a high-resolution city-scale simulation is exceptionally costly and time-consuming.
In conclusion, this study has expanded the breadth of potentials in urban planning and design through the climate-led approach. It suggested a more comprehensive landscape development prospects for tropical cities, aiming to enhance urban comfort and urban capacities against climate change. Future research should further diversify scenario designs by integrating more urban design considerations to comply with contemporary urban development and sustainability. Last but not least, the integration of climate knowledge and tools in urban planning and design requires simplicity and compatibility. As mentioned by Ng (Citation2012): “Overly detailed and precise meteorological information, and excessively sophisticated climatic explanations and knowledge presentation do not help planners; information overload makes planners feel discouraged and ill-equipped.”
Disclosure statement
No potential conflict of interest was reported by the author(s).
Additional information
Funding
Notes on contributors
Mei-Yee Teoh
Mei-Yee Teoh – B.LA. (UTM, Malaysia), M.LA. (SNU, Korea). She is currently a Ph.D. candidate at Shibaura Institute of Technology, Japan. Her research interest includes urban microclimate and outdoor thermal comfort studies, urban landscape design and planning, and the conservation and management of cultural landscapes.
Michihiko Shinozaki
Michihiko Shinozaki –B.E, M.E, Ph.D. (U. Tokyo, Japan). He is a Professor at School of Architecture, Shibaura Institute of Technology, Japan, and a Member of Urban Planning/Design Council in Tokyo, Japan. He is an urban expert with research interest in sustainable urban architecture design in Asian cities.
Kei Saito
Kei Saito –B.E, M.E, Ph.D. (SIT, Japan). He is a Associate Professor at Faculty of Urban Life Studies, Tokyo City University, Japan. He is an expert in urban environmental planning, urban landscape analysis and spatial information technology.
Ismail Said
Ismail Said – B.LA. (Iowa State, US), M.LA. (Kansas State, US), Ph.D. (UTM, Malaysia). He is a Professor at Faculty of Built Environment and Surveying, Universiti Teknologi Malaysia, Malaysia. His research interest ranges from children's environment, urban design and planning, to heritage architecture. He has published more than 135 papers in journals, 5 book chapters and 5 books.
References
- Albers, R. A. W., P. R. Bosch, B. Blocken, A. A. J. F. Van Den Dobbelsteen, L. W. A. Van Hove, T. J. M. Spit, … V. Rovers (2015). “Overview of Challenges and Achievements in the Climate Adaptation of Cities and in the Climate Proof Cities Program.”
- Alizadeh, B., and J. Hitchmough. 2019. “A Review of Urban Landscape Adaptation to the Challenge of Climate Change.” International Journal of Climate Change Strategies and Management 11: 178–194. doi:https://doi.org/10.1108/IJCCSM-10-2017-0179.
- Ampatzidis, P., and T. Kershaw. 2020. “A Review of the Impact of Blue Space on the Urban Microclimate.” Science of the Total Environment 730: 139068. doi:https://doi.org/10.1016/j.scitotenv.2020.139068.
- Anjos, M., A. Lopes, A. J. D. Lucena, and F. Mendonça. 2020. “Sea Breeze Front and Outdoor Thermal Comfort during Summer in Northeastern Brazil.” Atmosphere 11 (9): 1013. doi:https://doi.org/10.3390/atmos11091013.
- Berkovic, S., A. Yezioro, and A. Bitan. 2012. “Study of Thermal Comfort in Courtyards in a Hot Arid Climate.” Solar Energy 86 (5): 1173–1186. doi:https://doi.org/10.1016/j.solener.2012.01.010.
- Bherwani, H., A. Singh, and R. Kumar. 2020. “Assessment Methods of Urban Microclimate and Its Parameters: A Critical Review to Take the Research from Lab to Land.” Urban Climate 34: 100690. doi:https://doi.org/10.1016/j.uclim.2020.100690.
- Bruce, M. (2020a, 15th June). “ENVI-met 3.1 Manual Contents. [Online] ENVI-met.” http://www.envi-met.info/documents/onlinehelpv3/cnt.htm
- Bruce, M. 2020b, June 15. “ENVI-met - Decode urban nature with ENVI-met software.” [online] ENVI-met. https://www.envi-met.com/
- Buyadi, S. N. A., W. M. N. W. Mohd, and A. Misni. 2013. “Green Spaces Growth Impact on the Urban Microclimate.” Procedia-Social and Behavioral Sciences 105: 547–557. doi:https://doi.org/10.1016/j.sbspro.2013.11.058.
- Buyadi, S. N. A., W. M. N. W. Mohd, and A. Misni (.2014). “Quantifying Green Space Cooling Effects on the Urban Microclimate Using Remote Sensing and GIS Techniques.” Proceedings of the XXV International Federation of Surveyors, 16-21 June 2014, Kuala Lumpur, Malaysia.
- Chàfer, M., A. L. Pisello, C. Piselli, and L. F. Cabeza. 2020. “Greenery System for Cooling down Outdoor Spaces: Results of an Experimental Study.” Sustainability 12 (15): 5888. doi:https://doi.org/10.3390/su12155888.
- Chen, L., and E. Ng. 2013. “Simulation of the Effect of Downtown Greenery on Thermal Comfort in Subtropical Climate Using PET Index: A Case Study in Hong Kong.” Architectural Science Review 56 (4): 297–305. doi:https://doi.org/10.1080/00038628.2012.684871.
- Cheng, V., and E. Ng. 2006. “Thermal Comfort in Urban Open Spaces for Hong Kong.” Architectural Science Review 49 (3): 236–242. doi:https://doi.org/10.3763/asre.2006.4932.
- Duarte, D. H., P. Shinzato, C. Dos Santos Gusson, and C. A. Alves. 2015. “The Impact of Vegetation on Urban Microclimate to Counterbalance Built Density in a Subtropical Changing Climate.” Urban Climate 14: 224–239. doi:https://doi.org/10.1016/j.uclim.2015.09.006.
- Emmanuel, R., and E. Johansson. 2006. “Influence of Urban Morphology and Sea Breeze on Hot Humid Microclimate: The Case of Colombo, Sri Lanka.” Climate Research - CLIMATE RES 30: 189–200. doi:https://doi.org/10.3354/cr030189.
- Ghaffarianhoseini, A., U. Berardi, A. Ghaffarianhoseini, and K. Al-Obaidi. 2019. “Analyzing the Thermal Comfort Conditions of Outdoor Spaces in a University Campus in Kuala Lumpur, Malaysia.” Science of the Total Environment 666: 1327–1345. doi:https://doi.org/10.1016/j.scitotenv.2019.01.284.
- Goodman, R., R. Freestone, and P. Burton. 2017. Planning Practice and Academic Research: Views from the Parallel Worlds, 1–12. Planning Practice & Research. doi:https://doi.org/10.1080/02697459.2017.1378970
- Gunawardena, K. R., M. J. Wells, and T. Kershaw. 2017. “Utilizing Green and Bluespace to Mitigate Urban Heat Island Intensity.” Science of the Total Environment 584: 1040–1055. doi:https://doi.org/10.1016/j.scitotenv.2017.01.158.
- He, B. J., L. Ding, and D. Prasad. 2020a. “Urban Ventilation and Its Potential for Local Warming Mitigation: A Field Experiment in an Open Low-rise Gridiron Precinct.” Sustainable Cities and Society 55: 102028. doi:https://doi.org/10.1016/j.scs.2020.102028.
- He, B. J., L. Ding, and D. Prasad. 2020b. “Outdoor Thermal Environment of an Open Space under Sea Breeze: A Mobile Experience in A Coastal City of Sydney, Australia.” Urban Climate 31: 100567. doi:https://doi.org/10.1016/j.uclim.2019.100567.
- Humphreys, M. P., and H. Browman. 2017. “Climate Sensitivity and the Rate of Ocean Acidification: Future Impacts, and Implications for Experimental Design.” ICES Journal of Marine Science 74 (4): 934–940. doi:https://doi.org/10.1093/icesjms/fsw189.
- Hurley, J., E. J. Taylor, and K. Phelan. 2017. “Collaboration with Caveats: Research–Practice Exchange in Planning.” Planning Practice & Research 32 (5): 508–523. doi:https://doi.org/10.1080/02697459.2017.1378971.
- Hyde, R. 2000. Climate Responsive Design: A Study of Buildings in Moderate and Hot Humid Climates. Taylor & Francis, London.
- Jacobs, C., L. Klok, M. Bruse, J. Cortesão, S. Lenzholzer, and J. Kluck. 2020. “Are Urban Water Bodies Really Cooling?” Urban Climate 32: 100607. doi:https://doi.org/10.1016/j.uclim.2020.100607.
- Keshtkaran, R. 2019. “Urban Landscape: A Review of Key Concepts and Main Purposes.” International Journal of Development and Sustainability 8 (2): 141–168.
- Klemm, W., S. Lenzholzer, and A. Van Den Brink. 2017. “Developing Green Infrastructure Design Guidelines for Urban Climate Adaptation.” Journal of Landscape Architecture 12 (3): 60–71. doi:https://doi.org/10.1080/18626033.2017.1425320.
- Kong, L., K. K. L. Lau, C. Yuan, Y. Chen, Y. Xu, C. Ren, and E. Ng. 2017. “Regulation of Outdoor Thermal Comfort by Trees in Hong Kong.” Sustainable Cities and Society 31: 12–25. doi:https://doi.org/10.1016/j.scs.2017.01.018.
- Lee, H., H. Mayer, and L. Chen. 2016. “Contribution of Trees and Grasslands to the Mitigation of Human Heat Stress in a Residential District of Freiburg, Southwest Germany.” Landscape and Urban Planning 148: 37–50. doi:https://doi.org/10.1016/j.landurbplan.2015.12.004.
- Lenzholzer, S., and R. D. Brown. 2013. “Climate-responsive Landscape Architecture Design Education.” Journal of Cleaner Production 61: 89–99. doi:https://doi.org/10.1016/j.jclepro.2012.12.038.
- Li, J., Y. Wang, Z. Ni, S. Chen, and B. Xia. 2020. “An Integrated Strategy to Improve the Microclimate Regulation of Green-blue-grey Infrastructures in Specific Urban Forms.” Journal of Cleaner Production 271: 122555. doi:https://doi.org/10.1016/j.jclepro.2020.122555.
- Lin, T. P., and A. Matzarakis. 2008. “Tourism Climate and Thermal Comfort in Sun Moon Lake, Taiwan.” International Journal of Biometeorology 52 (4): 281–290. doi:https://doi.org/10.1007/s00484-007-0122-7.
- Litman, T. 2004. “Economic Value of Walkability.” World Transport Policy & Practice 10 (1): 5–14.
- Louafi, S., S. Abdou, and S. Reiter. 2017. “Effect of Vegetation Cover on Thermal and Visual Comfort of Pedestrians in Urban Spaces in Hot and Dry Climate.” Nature & Technology 17: 30B.
- Lu, J., Q. Li, L. Zeng, J. Chen, G. Liu, Y. Li, … K. Huang. 2017. “A Micro-climatic Study on Cooling Effect of an Urban Park in A Hot and Humid Climate.” Sustainable Cities and Society 32: 513–522. doi:https://doi.org/10.1016/j.scs.2017.04.017.
- Lunecke, M. G. H., and R. Mora. 2018. “The Layered City: Pedestrian Networks in Downtown Santiago and Their Impact on Urban Vitality.” Journal of Urban Design 23 (3): 336–353. doi:https://doi.org/10.1080/13574809.2017.1369869.
- Makaremi, N., E. Salleh, M. Z. Jaafar, and A. GhaffarianHoseini. 2012. “Thermal Comfort Conditions of Shaded Outdoor Spaces in Hot and Humid Climate of Malaysia.” Building and Environment 48: 7–14. doi:https://doi.org/10.1016/j.buildenv.2011.07.024.
- Malekafzali, A. 2017, December 20. “The Future of Architecture: Climate-Responsive Design.” SageGlass. https://www.sageglass.com/en/article/designing-for-geographic-climates#:~:text=A%20climate%2Dresponsive%20building%20design,%2C%20wind%2C%20rainfall%20and%20humidity
- Matzarakis, A., F. Rutz, and H. Mayer. 2007. “Modelling Radiation Fluxes in Simple and Complex Environments—application of the RayMan Model.” International Journal of Biometeorology 51 (4): 323–334. doi:https://doi.org/10.1007/s00484-006-0061-8.
- Matzarakis, A., F. Rutz, and H. Mayer. 2010. “Modelling Radiation Fluxes in Simple and Complex Environments: Basics of the RayMan Model.” International Journal of Biometeorology 54 (2): 131–139. doi:https://doi.org/10.1007/s00484-009-0261–0.
- Morris, C. J. G., I. Simmonds, and N. Plummer. 2001. “Quantification of the Influences of Wind and Cloud on the Nocturnal Urban Heat Island of a Large City.” Journal of Applied Meteorology and Climatology 40 (2): 169–182. doi:https://doi.org/10.1175/1520-0450(2001)040<0169:QOTIOW>2.0.CO;2.
- Nasir, R. A., S. S. Ahmad, and A. Z. Ahmed. 2012. “Psychological Adaptation of Outdoor Thermal Comfort in Shaded Green Spaces in Malaysia.” Procedia-Social and Behavioral Sciences 68: 865–878. doi:https://doi.org/10.1016/j.sbspro.2012.12.273.
- Ng, E. 2012. “Towards Planning and Practical Understanding of the Need for Meteorological and Climatic Information in the Design of High‐density Cities: A Case‐based Study of Hong Kong.” International Journal of Climatology 32 (4): 582–598. doi:https://doi.org/10.1002/joc.2292.
- Nikolopoulou, M., and S. Lykoudis. 2007. “Use of Outdoor Spaces and Microclimate in a Mediterranean Urban Area.” Building and Environment 42 (10): 3691–3707. doi:https://doi.org/10.1016/j.buildenv.2006.09.008.
- Ouyang, W., T. E. Morakinyo, C. Ren, and E. Ng. 2020. “The Cooling Efficiency of Variable Greenery Coverage Ratios in Different Urban Densities: A Study in A Subtropical Climate.” Building and Environment 174: 106772. doi:https://doi.org/10.1016/j.buildenv.2020.106772.
- Pauleit, S., R. Hansen, E. L. Rall, T. Zölch, E. Andersson, A. C. Luz, … K. Vierikko. 2017. “Urban Landscapes and Green Infrastructure.” In Oxford Research Encyclopedia of Environmental Science doi:https://doi.org/10.1093/acrefore/9780199389414.013.23.
- Priyadarsini, R., W. N. Hien, and C. K. W. David. 2008. “Microclimatic Modeling of the Urban Thermal Environment of Singapore to Mitigate Urban Heat Island.” Solar Energy 82 (8): 727–745. doi:https://doi.org/10.1016/j.solener.2008.02.008.
- Rajagopalan, P., K. C. Lim, and E. Jamei. 2014. “Urban Heat Island and Wind Flow Characteristics of a Tropical City.” Solar Energy 107: 159–170. doi:https://doi.org/10.1016/j.solener.2014.05.042.
- Reiter, S., and A. De Herde (2003). “Qualitative and Quantitative Criteria for Comfortable Urban Public Spaces. In Research in Building Physics.” Proceedings of the 2nd International Conference on Building Physics (pp. 1001–1009). CRC Press. doi:https://doi.org/10.1201/9781003078852.
- Saito, K., I. Said, and M. Shinozaki. 2017. “Evidence-based Neighborhood Greening and Concomitant Improvement of Urban Heat Environment in the Context of a World Heritage site-Malacca, Malaysia.” Computers, Environment and Urban Systems 64: 356–372. doi:https://doi.org/10.1016/j.compenvurbsys.2017.04.003.
- Shah, A., A. Garg, and V. Mishra. 2021. “Quantifying the Local Cooling Effects of Urban Green Spaces: Evidence from Bengaluru, India.” Landscape and Urban Planning 209: 104043. doi:https://doi.org/10.1016/j.landurbplan.2021.104043.
- Shi, D., J. Song, J. Huang, C. Zhuang, R. Guo, and Y. Gao. 2020. “Synergistic Cooling Effects (Sces) of Urban Green-blue Spaces on Local Thermal Environment: A Case Study in Chongqing, China.” Sustainable Cities and Society 55: 102065. doi:https://doi.org/10.1016/j.scs.2020.102065.
- Sodoudi, S., H. Zhang, X. Chi, F. Müller, and H. Li. 2018. “The Influence of Spatial Configuration of Green Areas on Microclimate and Thermal Comfort.” Urban Forestry & Urban Greening 34: 85–96. doi:https://doi.org/10.1016/j.ufug.2018.06.002.
- Stanley, C. H., C. Helletsgruber, and A. Hof. 2019. “Mutual Influences of Urban Microclimate and Urban Trees: An Investigation of Phenology and Cooling Capacity.” Forests 10 (7): 533. doi:https://doi.org/10.3390/f10070533.
- Syahidah, S. W., S. A. Zaki, and K. A. Razak. 2015. “In-situ Measurements and GIS-Based Analysis of the Microclimate at the Universiti Teknologi Malaysia.” Kuala Lumpur. In International Joint Conference of Senvar-Inta-Avan (SIA 2015 (November): 24–26.
- Tan, Z., K. K. L. Lau, and E. Ng. 2016. “Urban Tree Design Approaches for Mitigating Daytime Urban Heat Island Effects in a High-density Urban Environment.” Energy and Buildings 114: 265–274. doi:https://doi.org/10.1016/j.enbuild.2015.06.031.
- Thani, S. K. S. O., N. H. N. Mohamad, and S. M. S. Abdullah. 2013. “The Influence of Urban Landscape Morphology on the Temperature Distribution of Hot-humid Urban Centre.” Procedia-Social and Behavioral Sciences 85: 356–367. doi:https://doi.org/10.1016/j.sbspro.2013.08.365.
- Turner, T. 1996. City as landscape: a post-postmodern view of design and planning. London: E & FN Spon.
- Wamsler, C., E. Brink, and C. Rivera. 2013. “Planning for Climate Change in Urban Areas: From Theory to Practice.” Journal of Cleaner Production 50: 68–81. doi:https://doi.org/10.1016/j.jclepro.2012.12.008.
- Wong, N. H., C. L. Tan, D. D. Kolokotsa, and H. Takebayashi. 2021. “Greenery as a Mitigation and Adaptation Strategy to Urban Heat.” Nature Reviews Earth & Environment,2 (3): 166–181.
- Wu, J., C. Li, X. Zhang, Y. Zhao, J. Liang, and Z. Wang. 2020. “Seasonal Variations and Main Influencing Factors of the Water Cooling Islands Effect in Shenzhen.” Ecological Indicators 117: 106699. doi:https://doi.org/10.1016/j.ecolind.2020.106699.
- Yang, W., Y. Lin, and C. Q. Li. 2018. “Effects of Landscape Design on Urban Microclimate and Thermal Comfort in Tropical Climate.” Advances in Meteorology 2018: 1–13. doi:https://doi.org/10.1155/2018/2809649.
- Yin, J., Y. Zheng, R. Wu, J. Tan, D. Ye, and W. Wang. 2012. “An Analysis of Influential Factors on Outdoor Thermal Comfort in Summer.” International Journal of Biometeorology 56 (5): 941–948. doi:https://doi.org/10.1007/s00484-011-0503-9.
- Yu, K., Y. Chen, L. Liang, A. Gong, and J. Li. 2020. “Quantitative Analysis of the Interannual Variation in the Seasonal Water Cooling Island (WCI) Effect for Urban Areas.” Science of the Total Environment 727: 138750. doi:https://doi.org/10.1016/j.scitotenv.2020.138750.
- Zaki, S. A., N. S. Azid, M. F. Shahidan, M. Z. Hassan, M. Y. Md Daud, N. A. Abu Bakar, … F. Yakub. 2020. “Analysis of Urban Morphological Effect on the Microclimate of the Urban Residential Area of Kampung Baru in Kuala Lumpur Using a Geospatial Approach.” Sustainability 12 (18): 7301. doi:https://doi.org/10.3390/su12187301.
- Zhang, A., W. Li, J. Wu, J. Lin, J. Chu, and C. Xia. 2020. “How Can the Urban Landscape Affect Urban Vitality at the Street Block Level? A Case Study of 15 Metropolises in China.” Environment and Planning B: Urban Analytics and City Science, 2399808320924425 doi:https://doi.org/10.1177/2399808320924425.
- Zhao, Q., D. J. Sailor, and E. A. Wentz. 2018. “Impact of Tree Locations and Arrangements on Outdoor Microclimates and Human Thermal Comfort in an Urban Residential Environment.” Urban Forestry & Urban Greening 32: 81–91. doi:https://doi.org/10.1016/j.ufug.2018.03.022.
- Zhen, M., Q. Dong, P. Chen, W. Ding, D. Zhou, and W. Feng. 2020. “Urban Outdoor Thermal Comfort in Western China.” Journal of Asian Architecture and Building Engineering doi:https://doi.org/10.1080/13467581.2020.1782210.
- Zölch, T., J. Maderspacher, C. Wamsler, and S. Pauleit. 2016. “Using Green Infrastructure for Urban Climate-proofing: An Evaluation of Heat Mitigation Measures at the Micro-scale.” Urban Forestry & Urban Greening 20: 305–316. doi:https://doi.org/10.1016/j.ufug.2016.09.011.