
 ?Mathematical formulae have been encoded as MathML and are displayed in this HTML version using MathJax in order to improve their display. Uncheck the box to turn MathJax off. This feature requires Javascript. Click on a formula to zoom.
ABSTRACT
Commercial streets play an essential role in urban public life, and their appearance constitutes an important visual attraction, which can attract people to form high-quality and active public spaces. However, in the traditional design analysis methods, limited by the existing evaluation tools, the key content of visual attractiveness analysis under dynamic conditions has rarely been paying attention to. Given this, this research adopts both objectivity and real-time eye movement perception technology to construct an evaluation method based on dynamic visual attractiveness-through the application of virtual reality technology to construct a virtual scene of a typical commercial street and detect the user’s actions in it Eye movement at a time and physiological parameters such as the number of fixation points, fixation duration, and pupil diameter changes.This paper takes the main commercial street in Huanggaihu Town in Hubei Province of China as an example to analyze the visual attraction caused by different design methods.Therefore, from the four aspects of material, shape, line, and vegetation, design suggestions for the reasonable distribution of visual attractiveness in the commercial street space design are proposed to provide useful enlightenment for the vast towns’ commercial street space design.
1. Research background
In the prevailing experience economy era, commercial streets with the high visual appeal can significantly enhance public space’s economic and social vitality (Portman, Natapov, and Fisher-Gewirtzman Citation2015) and have important design research value. From the perspective of user physiology, more than 50% of brain cells in the human body are used to process visual information (Zhong, Gu, and Jiangjian Citation2015), so vision occupies the most important proportion of experience in all social perception modes. Therefore, the street’s appearance will significantly affect the commercial behavior in the street space, thus playing an important role in developing the urban economy. For example, Leung, Kim, and Kim (Citation2017) pointed out that the balance of convenience, security, and publicity of street space can lead to stable and suitable commercial activities. Therefore, it is of great significance to improve retail street space’s response to visual attraction in urban design and improve the urban quality and operation efficiency.
However, there is a lack of scientific methods to meet this requirement in the traditional design kit. On the one hand, the design evaluation method based on visual appeal has not been paid enough attention to; thus, the facade design of many commercial streets lacks scientific and objective guidance, or is highly similar or lacks characteristics, and lacks competitiveness in the commercial development. On the other hand, the existing tools are difficult to meet the requirements for evaluating visual attractiveness. Traditional evaluation tools mainly include questionnaire surveys and interviews. These evaluation tools are dominated by designers or professionals, while personal factors such as personality and emotion greatly hinder the expression of visual attractiveness evaluation feedback from the users. Simultaneously, the existing research on visual attractiveness is mainly based on evaluating static pictures. Still, there is no research combining with the actual situation of users’ dynamic walking in the commercial street. Therefore, it is necessary to innovate evaluation tools. On the one hand, the evaluation process should be based on the user group instead of the designer himself. On the other hand, the analytical method of dynamic eye-movement knowledge should be explored.
For this reason, this study adopts the dynamic detection method based on eye movement knowledge, constructs the virtual design scene of a typical commercial street with the help of virtual reality technology, and attempts to evaluate the visual attraction during the real-time roaming of retail street space. This new technique is based on the correlation between eye movement data and visual perception (Gidlöf et al. Citation2013), characterized by spontaneity and objectivity. The evaluation process is based on the user group’s physiological signals, which avoids the designer’s guiding interference in the evaluation process of the user group and makes the evaluation result more real. Therefore, by detecting the real-time eye movement trajectory and fixation duration, and other physiological parameters of users while they are on the move, and then analyzing the differences in visual attraction caused by different design means, the main factors affecting the visual attraction of commercial streets can be objectively and practically obtained, providing effective guidance for planning and design.
2. Literature review
2.1. Evolution of evaluation method of commercial street space design
At present, the research on the evaluation of commercial street space design is extensive, involving many disciplines such as behavioral science and economics. In the aspect of behavior, scholars usually measure spatial vitality, including crowd stay time (Leiqing and Qi Citation2014) and activity density (Xinyi, Guanshu, and Meng Citation2019). In economics, the quality of commercial street space design is usually described by economic benefits. For example, Wang De was located on Nanjing East Road in Shanghai (Harwood and Jones Citation2014) and Wangfujing Street in Beijing, for example (De, Yunzhi, and Wei Citation2011), from the perspective of consumer behavior, explore the influence of different spaces on the flow of people, the number of stays and the amount of consumption.
Therefore, as a source factor that affects the vitality of street space and economic benefits, visual attraction begins to enter the field of academic research.Visual attraction has changed from a little-noticed behavior in the past to a new direction in academic research.From the current studies, researchers mainly try to construct the basic methods of spatial visual quality evaluation of commercial streets from different perspectives.For example, the visual attraction behavior of commercial streets is evaluated from three aspects of subjective, objective and visual influencing factors (Hua, Li, and Qian Citation2014). Provide design guidance through perceptual visual quality and detailed mapping of key elements in the street (Ye et al. Citation2019); Based on the characteristics of visual attraction behavior, the lighting design elements and requirements of commercial streets are discussed (Roy et al. Citation2020). By collecting the data of the impact of street scenery on street space, the visual perception quality was evaluated (Tang and Long Citation2019). A user-centered visual evaluation of the facades in the streets of historic blocks (Mishra and Kolay Citation2019); Based on Street View image analysis, the visual quality of street space is scored (Min et al. Citation2018), etc.
These studies have made a good contribution to the evaluation of commercial street spaces by proposing that visual attraction behaviour should be incorporated into the evaluation system of commercial street space design. Overall, however, there is still significant room for improvement in the previous studies.
Firstly, they have a clear common feature in that they are all of an ex-post type of evaluation (e.g. post-use evaluation, POE Xin, Siting, and Yimin Citation2018). It is an evaluation of human perceptions after the design has been implemented and used for a period of time, so the results inevitably have a more pronounced lag and do not reflect the immediate reactions of the human subject in the context of the situation. Torun et al. (Citation2020), Bourikas et al. (Citation2020) and Day et al. (Citation2020), for example, have pointed out the need to pay attention to the differences between subjective and objective data in post-use evaluation studies of public spaces. For example, there are differences between perception (user evaluation) and objective (grammatical analysis) measures. For this reason new user-centred technical solutions need to be introduced (Ikediashi, Udo, and Ofoegbu Citation2020; Hameen, Ken-Opurum, and Son Citation2020).
Secondly, human subjective judgment dominates the research process, and effective methods or tools that can objectively reflect subjective feelings are less frequently used.
Therefore, there is an urgent need to explore research methods that can reflect the visual attractiveness of commercial streets dynamically, in real time and objectively from the user’s perspective in future research.
2.2. Review of dynamic visual attractiveness Evaluation Method based on eye movement knowledge
With the development of various wearable devices and their experimental research theories, emerging experimental methods are currently taking shape. One of the main trends is the use of wearable devices to capture psychological and physiological relevant parameters from which human behaviour or human emotions can be observed and thus spatial design can be evaluated. For example, Engelniederhammer, Papastefanou, and Xiang (Citation2019) and others used wearable device technology and sensors to capture human emotional responses to evaluate the degree of crowding in urban spaces; Zhou Hang used eye-movement analysis to qualitatively study the landscape quality of wetland parks at a visual level (Zhou Citation2020); and Wang Min used eye-movement gaze hotspot maps to analyse the spatial perception of urban public squares (Mishra et al. Citation2019).
Compared to other physiological measurement techniques, eye-movement perception techniques have obvious advantages in lowering the threshold of expression for use groups due to the use of eye-movement signals, a physiological information that conveys a person’s subjective perception of the situation and can visually reflect the subject’s area of interest, while having the advantage of not being limited by factors such as verbal expression and professional ability. For example, Wieringen et al. measured changes in eye movement signals for different viewing objects by students from different cultures in this way, as a way to analyse the aesthetic preferences of students from various countries (Hekkert and Van Wieringen Citation1996); Bu Fanshuai et al. found a visual search advantage in children with autism disorder by measuring eye movement and pupil information in children with non-expressive autism (Fanshuai, Wei, and Wei Citation2016); Li Firong identified difficulties in communicating through the eye-movement signal characteristics of autistic disorder (ASD) patients, which provided a reference for early detection of ASD (Feirong and Youqing Citation2014).
As can be seen, the evaluation approach based on eye movement perception provides a good basis for exploring the evaluation method of visual attractiveness of commercial streets. It can overcome the barriers to evaluation arising from the differences in professional comprehension and expressive abilities of a large number of different users in commercial streets, and objectively reflect users’ real-time feelings towards commercial streets.
As far as the evaluation of visual attractiveness itself is concerned, there are two types of evaluation: delayed and instantaneous evaluation, with the former being the main type of experiment.
The delayed evaluation refers to the evaluation subject describing his or her visual attraction behaviour after reflection. The common tools include rating descriptions (Binyi and Rong Citation2014) and subjective scoring methods (Rong Citation2016). Since the duration of each visual attraction is very short and the human body is often unaware of the visual attraction, the delayed evaluation method is susceptible to subjective interference, making the evaluation results less realistic.
Transient evaluation means that the subject outputs information about his or her own visual attraction behaviour with the aid of a wearable eye-tracking device. In contrast, the Biopac MP150 and Tobii pro spectrum devices are more mature, however, they are expensive, complicated to operate, have a large amount of data to analyse, and the electrode patches tend to cause subjective rejection by the subject.
Based on the above analysis, this study proposes to adopt a transient evaluation method based on eye-movement perception technology and selects a wearable eye-tracking device as the evaluation tool. However, the current tools used to analyse eye movement data are not sufficient to analyse the highly variable external environment (Dzeng, Lin, and Fang Citation2016), therefore, the analysis method of the data obtained by the eye movement device needs to be investigated in order to construct a correlation between physiological and environmental information. This will be a focus of this study.
To achieve these goals, virtual reality technology will inevitably be of great value. wilson et al.’s study on the degree of emotional arousal in a high-simulation virtual scene illustrates the advantages of virtual reality technology applied in the field of eye perception (Wilson and Alessandro Citation2015); Kuliga et al. confirmed that virtual scenes can be used as eye perception by applying eye perception technology in virtual and real scenes respectively (Wilson and Alessandro Citation2015). Kuliga et al. (Citation2015) Eye movement perception technology has a mature application base not only in real or virtual scenes, and the control of various environmental variables in virtual scenes can help eye movement perception technology to dig deeper into the user’s psychological and emotional information. Visual attraction behaviour is a complex activity involving multiple organs of the human body, but the visual attraction elements of the built environment are fixed and homogenous, and thus eye-movement experiments in the built environment are of limited use in uncovering correlations between eye-movement information and environmental elements. In this sense, virtual reality technology allows for arbitrary changes to environmental elements and can explore the role of different environmental elements on visual attraction behaviour simultaneously (Kuliga et al. Citation2015; Zhang et al. Citation2019a).
In summary, research on the evaluation of visual attraction with the help of eye-movement perception techniques has formed a good foundation, and the development of virtual reality technology has further broken down the limitations of the environment in which eye-movement perception techniques can be applied. Therefore, this study will use a combination of eye-movement perception and virtual reality technology to evaluate the dynamic visual attraction behaviour of commercial street space design.
3. Research framework
This study consists of two parts, namely, constructing a dynamic visual attractiveness evaluation method of commercial streets based on eye movement knowledge from the perspective of method and verifying this method’s feasibility from an empirical perspective ().
Figure 1. Research framework.
Firstly, the paper analyzes the construction path of the index system of dynamic visual attractiveness evaluation from the perspective of method. This paper mainly adopts the method of literature review and comparison to systematically analyze all kinds of existing studies on the evaluation of visual attraction factors, and select the measurement factors suitable for the object of this study – commercial streets. The selection principle of measurement factors is to have the ability to connect physiological data with environmental visual attraction elements and, at the same time, meet the environmental characteristics of specific spaces of commercial streets. For this reason, this study proposed that the number of fixation points, fixation duration and pupil diameter of visual attraction were taken as measurement factors.
Secondly, the feasibility is verified from an empirical perspective to comprehensively study the design of eye movement evaluation experiment and the analysis process of experimental results. In the experimental design of eye movement evaluation, typical urban commercial streets are selected as empirical research objects. Appropriate experimental equipment is determined based on the principles of economy and availability. By analyzing the correlation between the experimental data and the design means, the design means to change the visual attraction behavior is determined.
4. Research method
The research content of dynamic visual attraction mainly includes two aspects: one is to obtain the visual attraction of street interface in real time through eye movement information; the other is to summarize the common characteristics of architectural interface with high visual attraction. Therefore, targeted research methods are needed. The traditional way to analyze visual attractiveness is mainly the fixation thermal diagram, which shows the distribution of the human eye’s attention to the static picture. However, the fixation points in the dynamic scene are distributed on all visible surfaces of the volume. The traditional fixation thermal diagram cannot ultimately present the fixation distribution of human eyes on all surfaces in the dynamic scene. Therefore, this study needs to reconstruct relevant research methods from the following two aspects:(1) the calculation method of visual attractiveness based on dynamic eye movement data; (2) Research on the composition of analytical elements of visual attraction.
4.1. Dynamic visual attractiveness calculation method
Visual attraction involves two major organs, the eye and the human brain (). The external landscape enters the human eye through optical reflection and transmits the external visual information to the human mind. Based on interest, experience, and other factors, the human brain processes the external information, removes a large number of invalid contents, distributes attention to the interesting contents, and completes the human mind’s attracting behavior to interesting contents.
Figure 2. Physiological structure diagram of visual attraction behavior (Torun et al. Citation2020). (a) Physiological figure of eyeball. (b) Physiological figure of human brain.
This study used visual attraction to describe how much attention the brain pays to the content of interest. Attention can be measured in terms of its external appearance, including the number of fixation points, duration of fixation, and pupil diameter. The architectural interface’s visual attraction is formed by the superposition of the human body’s multiple visual attraction behaviors. Each visual attraction behavior produces a fixation point, accompanied by two fixation duration and pupil diameter indexes. Therefore, the visual appeal of an architectural interface is calculated by formula 1.
In the formula
A – The visual appeal of a main interface;
Ti – The fixation duration of the ith visual attraction behavior;
Di – The pupil diameter of the ith visual attraction behavior;
i – Number of visual attraction behaviors, I = 1,2 … N.
4.2. Analysis of elements of visual attraction
The visual impression of the human body on the street space is the comprehensive result of the brain’s stimulation by various visual elements in the space. To obtain the design means to enhance visual attraction, it is necessary to take multiple visual attraction elements in the space as the evaluation object and conduct inductive analysis on each element’s design means to determine the space’s common characteristics with high visual attraction.
There are quite a few of researches on the inductive methods of visual attraction elements in international level. This study combs the visual attraction elements based on the existing researches. In terms of the types of elements, Litton (Dupont, Antrop, and Eetvelde Citation2014), Wohlwill (Zhang et al. Citation2019b), Bell (Eckstein et al. Citation2017) put forward different landscape elements. And Liu etc (Binyi and Rong Citation2014) on this basis identified 12 landscape space visual appeal, including the space scale, entity, boundary and distance, colour, line, form, instantaneous natural landscape, vegetation, water, dynamic images, texture, sunshine.
By combing the existing literature and combining with the actual evaluation needs of the spatial visual attraction of commercial streets, the paper further screened them. Some landscape visual attraction elements are not common in commercial street space. For example, because commercial space is mainly aimed at making profits, the space interface is usually relatively transparent, so closed or semi-closed enclosing ways are rarely seen. And in the analysis of the common characteristics, the too fine classification will significantly increase the workload of analysis and judgment. On this basis, the three elements of the boundary, instantaneous natural landscape, and sunlight are appropriately deleted in this study, and entity and form are merged into form. In contrast, color and texture are merged into materials. Finally, commercial street space’s visual appeal elements can be extracted into lines, forms, vegetation, materials, water, and dynamic scene.
4.3. Data source
The data of this study are derived from the following aspects:
GIS topographic map analysis. The topographic map of the experimental subjects (commercial streets) was analyzed to extract relevant data, such as street length, height, and size of commercial shops.
Physiological signal capture. Through the eye tracker and other experimental equipment, in the experimental process of the participants real-time extraction.
5. Empirical research
For this reason, the main street reconstruction design of Huangjiahu Town, Hubei Province, China was taken as the evaluation object to carry out the eye movement knowledge evaluation experiment.
5.1. Empirical research object
Huanggaihu Town is located in Chibi City, Hubei Province, China, 35 kilometers away from the urban area.It is the place where the famous Red Cliff Battle took place in ancient China, with rich historical and cultural atmosphere.The central street of Huanggaihu Town is 3 kilometers long. The main body was built in the 1970s and 1980s, and the buildings are densely distributed. The main body is dominated by commercial buildings along the street, including local dwellings, office buildings, squares and health clinics.For a long time, it has been the most important traffic and commercial street in the local area, and has a profound foundation for tourism development in terms of history, culture and natural scenery.However, at present, the damaged and aged buildings along the street are more serious, the interface is not beautiful enough, and the attraction for foreign people drops quickly, so it is difficult to meet the development needs of local tourism.In order to revitalize the local society and economy and enhance the image of the town, the local government proposed to transform the main street with the method of retro-style design, focusing on improving the visual attractiveness of the street interface, in order to attract more tourists ().
Figure 3. Land distribution map of central street of Huanggaihu Town.
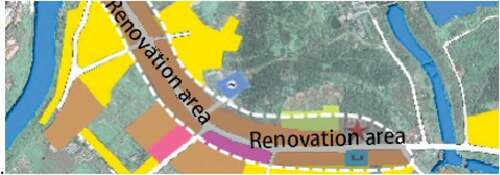
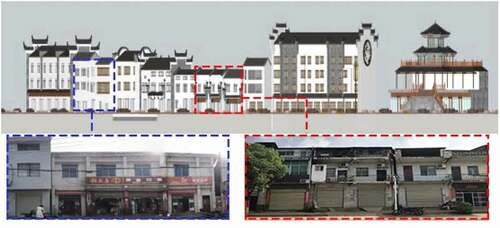
Figure 4. Contrast the current situation of the street after the renovation design.
However, it is still a difficult problem how to design the main street which is so important to the local people.Specifically, the local government wants the research team to focus on the following issues:
What are the visual attractions of each of the main elements in street design?
What kind of visual attraction of design elements should be paid attention to in design?
Under this background, the research team adopts the method of combining virtual reality and eye movement knowledge to carry out the research. On the one hand, this method can construct the transformed commercial street scene in advance and provide a pre-judgment basis with the minimum cost. On the other hand, the dynamic eye movement detection technique is adopted to capture users’ visual behavior track and concern through their real-time roaming, thus providing an important decision basis for testing the design scheme’s effectiveness.
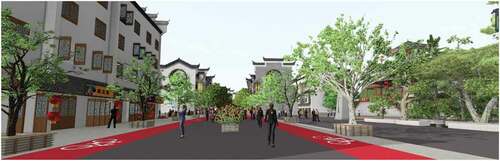
The research process is as follows: Firstly, the paper studies the unification of the current architectural interface on both sides of the street and adopts the panoramic shooting method to record the materials comprehensively, natural landscape, doors, and windows, signs, use facilities, carved decorations and other details of the space along the street and building facades. On this basis, the main street’s reconstruction design scheme is proposed as the experimental verification material of this study. In the reconstruction design scheme, the focus of the visual elements to be tested was put forward: in terms of material, the white wall, gray tile and wood with regional characteristics were selected; in terms of the natural landscape, the street is decorated with plants of high, medium and low height. The doors and windows are carved wooden and modern alloy window frames. Signs with classical meaning of the plaque, signage, flags, etc. echo the local history and culture. In terms of facilities, leisure facilities (such as seats), sanitation facilities (such as dustbins) and lighting facilities (such as street lamps) have been added. In terms of carving and decoration, the horse’s head walls and railings, which are featured in Hui-style architecture, are adopted to create a traditional regional style ().
Figure 5. Renderings of central street renovation in Huanggaihu Town.
5.2. Experiment design
5.2.1. Experimental framework
In this experiment, volunteers were invited to carry out evaluation experiments as subjects.Considering that the main users of this street in the future will be young tourists from outside, 27 subjects from different parts of the country were specially selected to participate in this experiment. None of them had ever been to this area and had strong curiosity about the experimental site.Among them, there were 13 males and 14 females, ranging in age from 22 to 27 years old, with an average age of 24 years old. Both binocular corrected visual acuity were normal.Overall, this group fits the profile of local tourists found in the survey.
First, the attention of all the fixation points of each subject was calculated, and the visual appeal of each store was measured. Then, the visual appeal heat map of each store is marked on the general plan of the main street to obtain the distribution of stores with high visual appeal. Finally, this paper analyzes the standard features of stores with a high visual appeal from four aspects: material, line, form, and vegetation, and puts forward enlightening views on design means.
The eye movement indicators to be detected include fixation point position, fixation point number, fixation duration, pupil diameter, and saccade trajectory. After comparison, it was decided to use ETMobile eye tracker as the experimental equipment to record the eye movement data of the subjects in the roaming process. With a sampling rate of 60 Hz, the eye tracker has two advantages: first, no resolution loss of active eye images and scene images; Second, it is not affected by contact lenses to ensure accurate and reliable eye movement data.
A total of 27 randomly selected subjects participated in this experiment, including 13 males and 14 females, aged 22–27 with an average age of 24, with normal corrected binocular vision.
5.2.2. Experimental process
The experimental process is divided into three stages: 1) Understand the experimental task and software operation; 2) Debugging and calibration of eye tracker; 3) Roaming experience. At the stage of understanding the experimental task, the experimenter told the subject the physiological information to be tested in the experiment, signed the informed consent form, and then told the experimental task, to get familiar with the background, current situation, and roaming operation of the block reconstruction. The experimental task is to tour the virtual space in the street design scheme of Huangjiahu Town. Then, the eye tracker was worn, the pupil position was calibrated, the eye movement information was recorded, and the content of experience and communication during the experiment was recorded throughout. Finally, the subject was guided to experience the tour, and the recording of the eye tracker was stopped in time when the subject wandered outside the test area or the fixation point shifted off the screen, so as to reduce the workload of later eye movement analysis and improve the accuracy of data.
6. Experimental process and result analysis
According to the previous study in 4.2, the visual appeal elements of commercial street spaces can be summarised as: lines, forms, vegetation, materials, water bodies and dynamic scenery. Through on-site research and cross-selection of all the experiment eye-movement perception data, it was found that although the visual appeal of commercial streets is diverse, the main architectural interface elements that attract attention are concentrated in four categories: material, form, line and vegetation. These four categories are also common elements in the design of commercial streets, and the findings are therefore of good generalists. For this reason, this study will focus on these four categories and identify common patterns that enhance their visual appeal. This will help to draw conclusions that will be of practical relevance to local authorities and designers.
6.1. Material
In terms of materials, it is found that there is no apparent difference in visual appeal between different materials used for transformation. Still, different design techniques of the same material make a significant difference in visual appeal, mainly reflected in the fact that materials with more obvious contrast are more likely to obtain higher visual appeal.
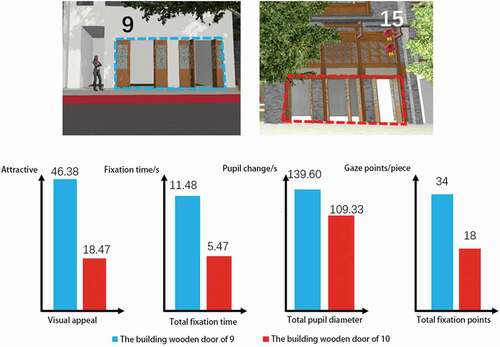
In terms of the comparison method, the study draws lessons from Coltekin et al. (Noland et al. Citation2017). A method to evaluate the effectiveness of interactive map design by comparing area of interest (AOI) eye movement information to compare the differences in visual attractiveness among different variables. Take, for example, the use of wood in buildings 9 and 15.The visual attraction of 15 wooden doors is far less than 9 wooden doors.
In terms of analytical methods, the beginning and end times of fixation points were recorded by time markers (Cai et al. Citation2018). This study extracted eye-movement videos of the subjects browsing No. 9 and No. 15 buildings, counted all the fixation points in AOI according to the starting time, and calculated the visual attraction of AOI.As shown in , it was found that the average value of visual attraction, number of fixation points, fixation time and pupil diameter of No. 9 wooden door were all higher than that of No. 15 building. Therefore, the material of No. 9 door is more able to win the attention of tourists after the reconstruction of the main street, so as to improve the operating efficiency of commercial stores.
Figure 6. AOI analysis diagram of Building No. 9 and 15.
6.2. Form
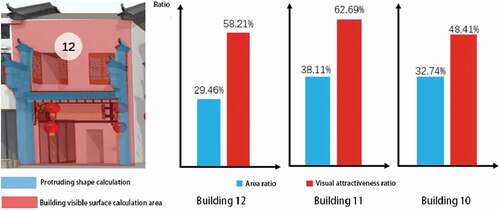
In this study, in the modified facade, the protruding facade shape is more comfortable to attract the visual attention of customers, and customers are more interested in the archaized architecture with higher form complexity.
The analysis is carried out by means of comparison. First of all, the building with a convex form on the surface is selected to analyze the subjects’ visual attraction behavior to convex form. Taking Building No. 10 as an example, the ratio of the surface area of the protruding body to the visible surface area of the building facing the street is 29.46%, while the ratio of the visual attraction of the protruding body to the visual attraction of Building No. 10 is 58.21%. In the same way, the visual attraction aggregation phenomenon of prominent shapes in Building no. 11 and Building No. 12 was compared, and the analysis results were shown in . This indicates that these architectural interfaces’ visual appeal is not evenly distributed, and there is a clustering phenomenon on the protruding surface.
Figure 7. Analysis diagram of AOI for different shapes.
Then, the buildings with certain differences in the degree of retro facade design (reflected in the low and high complexity of form) were selected respectively to compare and analyze the differences in visual attraction behaviors between the two. For example, Building No. 7 and Building No. 18 are similar in terms of architectural volume, material, lines, natural landscape, etc., while building No. 18 has a higher physical complexity than building No. 17 (). The number of fixation points, fixation duration and pupil diameter of the two buildings were counted, and the visual attraction was calculated. The final statistical result is shown in . As can be seen from the picture, building 18 has a higher visual appeal than building 17.
Figure 8. Architectural design renderings of No.17 and No.18.
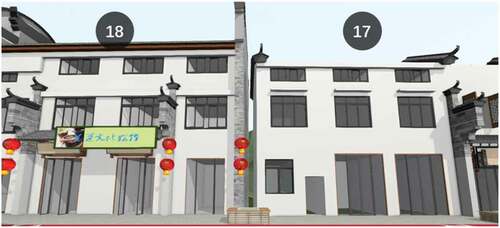
Figure 9. Statistical chart of visual appeal of Building 17 and Building 18.
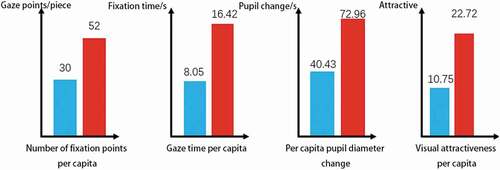
Meanwhile, the number of gaze points per capita in Building 18 is 1.73 times that of Building 17, and the average gaze length in Building 18 is 2.05 times that of Building 17. Therefore, it can be speculated that the reasons for the high visual attraction of Building No. 18 include the number of fixation points and the longer average fixation duration of each fixation point, which is positively correlated with the interest degree of attraction elements. As a result, customers are more likely to notice more retro buildings (and thus more complex in form) and show a higher level of interest.
6.3. Line
In terms of lines, through the analysis of lines with different properties in the architectural space, this experiment finds that there is no obvious difference between straight lines and curves in visual attraction to the subjects, while horizontal lines have a stronger visual guiding effect than vertical lines.
First of all, this experiment makes a comparative analysis of straight lines and curves. The curviline gable and the straight gable at the street’s two intersections are selected as the analysis area. These two buildings have high similarity in location advantage, height, width, material and other aspects. The eye movement information in the analysis area was extracted, and the visual attraction of the two regions was obtained, as shown in . The straight line and the curved gable did not cause a significant difference in visual attraction.
Figure 10. AOI analysis of different lines.
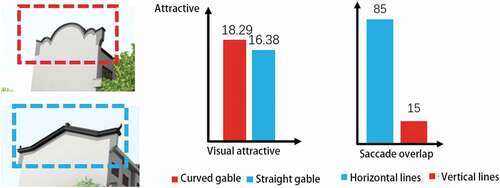
Secondly, on the horizontal line and vertical line comparative analysis, found that the track of saccade and cornice, railing and other horizontal lines of high coincidence degree.Saccades can reflect the hinting effect of environment on people (Clement, Kristensen, and Gronhaug Citation2013), so the phenomenon of coincidence between saccades track and lines in space of all subjects was statistically analyzed, and the guiding effect of different lines on visual attraction behavior was analyzed.As shown in , the number of overlapping with horizontal lines is 3.3 times per person, and the number of overlapping with vertical lines is 0.58 times per person.Therefore, horizontal lines play a stronger role in guiding the visual attraction behavior, and more emphasis should be placed on the application of horizontal lines like retro elements in facade design.
6.4. Vegetation
In terms of vegetation, it is a double-edged sword to find trees to be visually attractive – trees have a great shielding effect on the store interface, which reduces the overall visual appeal and enhances the visual appeal of the entrance.
The virtual reality scene shows and designs the scene. The result shows that there are 14 buildings on the main street that are shielded by trees, and there are 7 buildings that are not. By calculating the average visual attraction of the two types of buildings, it is found that the average visual attraction of buildings not shaded by trees is 6.87, which is higher than that of buildings shaded by trees, which is 5.48, indicating that the visual attraction of trees to the subjects is lower than that of the building interface shaded by trees.
However, for the various shops in the high street, the ground floor’s visual appeal is the key factor to draw customers into the shop. The trees’ shading effect reduces the overall visual appeal of the shop but enhances the visual appeal of the ground floor. By statistical analysis of the visual appeal obtained by the ground floor interface of the two types of buildings, it is found that the visual appeal of the ground floor of buildings shaded by trees (4.53) is much higher than that of buildings not shaded by trees (3.59).
Therefore, in the design of commercial streets, attention should be paid to the impact of the amount, location and even height of vegetation. This is just the traditional commercial street design is easy to ignore the content, and in the past, it also lacks appropriate means to discover and verify. Now with the help of dynamic eye movement detection, it is possible to achieve significant breakthroughs.
7. Conclusions and implications
The research shows that in the design of commercial street space, different design methods for different architectural elements do have different effects on the visual appeal.
First of all, it is found in the experiment that designers can improve the visual attraction of commercial streets through appropriate design techniques in four aspects of material, form, line and vegetation.For example, in terms of material, there is no obvious gap between different materials in terms of visual attractiveness, but the different design techniques of the same material make great differences in visual attractiveness.At the same time, vegetation can play a special effect of emphasis and prominence in landscape design, which indicates that in the space environment dominated by hard artificial materials, vegetation with flexible and natural characteristics has an indispensable and important visual attraction ability.In addition, these conclusions confirm that the original retro design idea is relatively feasible, and provide practical help for guiding the local government to carry out targeted facade reconstruction design.
Secondly, comparatively speaking, the architectural interface with distinct material contrast, high retro shape, high body complexity and strong level orientation can better attract the visual attention of tourists.This may have something to do with the fact that people’s vision is easily attracted to objects with strong contrast.The specific cognitive rules need to be further analyzed across disciplines.Another example is vegetation, whose special double-sided effect in commercial streets is officially discovered for the first time, which is worthy of designers’ attention in practice.
Experimental results show that compared with the previous studies, this research explores mainly embodied in three aspects of innovation: first, in the analysis of the dynamic visual appeal in the scene, makes up the defect of traditional eye on static image analysis, to build a dynamic visual appeal of practice value calculation method and analysis method.Secondly, the new design evaluation method based on real-time physiological feedback signals of users provides a way to carry out remote experimental analysis for tourists from other places by building immersive simulation scenes, and also makes up for the shortcomings of previous research that it is difficult to carry out tests on users who are not present.Third, and more importantly, this method can accurately capture the specific effects of various spatial elements on visual attraction that are difficult to be found by other means, so as to provide an objective and credible decision-making basis for the design and construction of commercial space.
However, limited by hardware equipment, this method still has some limitations. First, limited by experimental equipment and site, the virtual tour scene takes the computer desktop as the experience carrier, so it cannot form a completely real sense of tour immersion.Secondly, the dynamic distribution of fixation points is dominated by manual statistics, which has some errors.In view of the rapid development of virtual reality technology and eye movement tracking technology in recent years, eye tracker products equipped with virtual reality technology will become more and more mature. It is expected that in the future, users’ emotional state closer to the real state can be obtained through the combination of virtual experience devices with more immersive feelings and physiological detection instruments.And establish the real-time measurement function which reflects the subjective psychology of users directly from the objective data statistics, so as to realize the evaluation method of de-language.
This study further reveals that the analysis of visual attraction of space needs to strengthen the integration of architecture, psychology, physiology (eye movement tracking), computer science and technology (virtual reality) and other fields.The continuous progress and breakthrough of tools will certainly improve the accuracy and convenience of spatial visual attraction analysis methods. It is expected that visual attraction evaluation will become an indispensable and important content in the future urban and rural spatial design evaluation.
Disclosure statement
No potential conflict of interest was reported by the author(s).
Additional information
Funding
Notes on contributors
Guo Xiangmin
Guo Xiangmin is currently an associate professor at Harbin Institute of Technology (Shenzhen), a member of the Foreign Urban Planning Committee of the Urban Planning Society of China, a member of the editorial board of authoritative international SCI and A&HCI journals, and an expert in rewriting international SCI journals. His main research interests include: urban and architectural design methods supported by virtual digital technology, decision-making evaluation of urban and rural development, urban operations and strategic planning. He has presided over and participated in a number of national funds and projects.
Cui Weiqiang
Cui Weiqiang, graduated from Harbin Institute of Technology Shenzhen with a master's degree, is currently working in the Planning and Design Department of GRANDJOY Holdings Group Co. Ltd., engaged in design management. During his postgraduate study, his research direction is virtual interactive architectural design method based on ocular motion awareness technology.
Lo Tiantian
Lo Tiantian is an Assistant Professor at the Harbin Institute of Technology (Shenzhen). During his doctoral study, he was awarded a full doctoral scholarship by the Chinese University of Hong Kong and Victoria University of Wellington. His main research area is the bottom-up human-centered architectural design concept. Using VR, BIM, and gamification to create an interactive environment. At present, he has published nearly 30 international journal and conference papers with some published and distributed. He is also the organizing committee member and reviewer of computer-aided Architectural Design Research in Asia (CAADRIA), Architectural Science Association (ANZAScA), and other international well-known conferences.
Hou Shumeng
Hou Shumeng is an Assistant Professor at the Harbin Institute of Technology (Shenzhen).Her main research areas are industrial and design psychology, user experience and measurement, product design and evaluation for special groups, behavioral and brain imaging research for autistic children, and online behavioral research.
References
- Binyi, L., and F. Rong. 2014. “Experiment and Analysis of Visual Attraction Mechanism of Landscape Space [J].” Chinese Landscape Architecture 30 (9): 33–36.
- Bourikas, L., D. Teli, R. Amin, P. James, and A. S. Bahaj. 2020. “Facilitating Responsive Interaction between Occupants and Building Systems through Dynamic Post-occupancy Evaluation.” IOP Conference Series: Earth and Environmental Science 410: 012021. doi:10.1088/1755-1315/410/1/012021.
- Cai, L. Z., J. A. M. Paro, G. K. Lee, and R. S. Nazerali. 2018. “Where Do We Look? Assessing Gaze Patterns in Breast Reconstructive Surgery with Eye-Tracking Technology[J].” Plastic and Reconstructive Surgery 141 (3): 331. doi:10.1097/PRS.0000000000004106.
- Clement, J., T. Kristensen, and K. Gronhaug. 2013. “Understanding Consumers‘ In-store Visual Perception: The Influence of Package Design Features on Visual Attention[J].” Journal of Retailing and Consumer Services 20 (2): 234–239. doi:10.1016/j.jretconser.2013.01.003.
- Day, J. K., S. Ruiz, W. O’Brien, and M. Schweiker. 2020. “Seeing is Believing: An Innovative Approach to Post-occupancy Evaluation.” Energy Efficiency 13: 473–486. doi:10.1007/s12053-019-09817-8.
- De, W., N. Yunzhi, and Z. Wei. 2011. “Study on Consumer Behavior and Commercial Spatial Structure of Wangfujing Street [J].” City Planning Review 35 (7): 43–48+60.
- Dupont, L., M. Antrop, and V. V. Eetvelde. 2014. “Eye-tracking Analysis in Landscape Perception Research: Influence of Photograph Properties and Landscape Characteristics.” Landscape Research 39 (4): 417–432. doi:10.1080/01426397.2013.773966.
- Dzeng, R. J., C. T. Lin, and Y. C. Fang. 2016. “Using Eye-Tracker to Compare Search Patterns between Experienced and Novice Workers for Site Hazard Identification[J].” Safety Science 82 (2): 67–72.
- Eckstein, M. K., B. Guerra-Carrillo, A. T. M. Singley, and S. A. Bunge. 2017. “Beyond Eye Gaze: What Else Can Eyetracking Reveal about Cognition and Cognitive Development?[J].” Developmental Cognitive Neuroscience: 2017, 25: 69–91.
- Engelniederhammer, A., G. Papastefanou, and L. Xiang. 2019. “Crowding Density in Urban Environment and Its Effects on Emotional Responding of Pedestrians: Using Wearable Device Technology with Sensors Capturing Proximity and Psychophysiological Emotion Responses while Walking in the Street.” Journal of Human Behavior in the Social Environment 29: 630–646. doi:10.1080/10911359.2019.1579149.
- Fanshuai, B., Z. Wei, and J. Wei. 2016. “The Visual Search Advantage of Preschool Children with Autism Spectrum Disorder: Evidence from Combined Eye Movement and Pupil Measurement [J].” China Special Education 9 (6): 52–58.
- Feirong, L., and C. Youqing. 2014. “Early Prediction of Autism Spectrum Disorder Based on Eye Movement Research [J].” Chinese Journal of Child Health Care 6 (5): 1–5.
- Gidlöf, K., A. Wallin, R. Dewhurst, and K. Holmqvist. 2013. “Using Eye Tracking to Trace a Cognitive Process: Gaze Behaviour during Decision Making in a Natural Environment[J].” Journal of Eye Movement Research 6 (1): 613–619. doi:10.16910/jemr.6.1.3.
- Hameen, E. C., B. Ken-Opurum, and Y. Son. 2020. “Protocol for Post Occupancy Evaluation in Schools to Improve Indoor Environmental Quality and Energy Efficiency.” Sustainability 12: 3712. doi:10.3390/su12093712.
- Harwood, T., and M. Jones. 2014. “Mobile Eye Tracking In Retail Research[J].” Current Trends in Eye Tracking Research: Springer, Cham, 2014: 183–199.
- Hekkert, P., and P. C. W. Van Wieringen. 1996. “Beauty in the Eye of Expert and Nonexpert Beholders: A Study in the Appraisal of Art [J].” The American Journal of Psychology 109 (3): 389–407. doi:10.2307/1423013.
- Hua, D., X. Li, and C. Qian. 2014. “Study on the City Commercial Pedestrian Streets Planning Based on Visual Perception[J].” Ecological Economy.
- Ikediashi, D. I., G. Udo, and M. Ofoegbu. 2020. “Post-occupancy Evaluation of University of Uyo Buildings.” Journal of Engineering, Design and Technology 18: 1711–1730. doi:10.1108/JEDT-11-2019-0303.
- Kuliga, S. F., T. Thrash, R. C. Dalton, and C. Hölscher. 2015. “Virtual Reality as an Empirical Research Tool — Exploring User Experience in a Real Building and a Corresponding Virtual Model[J].” Computers, Environment and Urban Systems 54 (54): 363–375. doi:10.1016/j.compenvurbsys.2015.09.006.
- Leiqing, X., and K. Qi. 2014. “The Influence of Spatial and Interface Characteristics of Commercial Street on Pedestrian Stopping Activities: A Case Study of Nanjing JOURNAL OF ASIAN ARCHITECTURE AND BUILDING ENGINEERING 11 West Road in Shanghai [J].” Urban Planning Forum 2014(03): 104–111.
- Leung, S. M. S., T. W. Kim, and Y. Kim. 2017. “Linked Podiums Affecting Street Life: A Case of Tuen Mun in Hong Kong[J].” Urban Design International 2017, 22 (1): 47–72. doi:10.1057/s41289-016-0008-6.
- Mishra, S., Kolay, S. (2019) Visual Perception of the Street Façade of a Historic Town: Case Study of the Walled City of Jaipur, India. In: Chakrabarti A. (eds) Research into Design for a Connected World. Smart Innovation, Systems and Technologies, vol 135. Springer, Singapore. https://doi.org/10.1007/978-981-13-5977-4_32
- Mishra, S., and S. Kolay. 2019. “Visual Perception of the Street Façade of a Historic Town: Case Study of the Walled City of Jaipur, India.”
- Noland, R. B., M. D. Weiner, D. Gao, M. P. Cook, and A. Nelessen. 2017. “Eye-tracking Technology, Visual Preference Surveys, and Urban Design: Preliminary Evidence of an Effective Methodology[J].” Journal of Urbanism: InternationalResearch on Placemaking and Urban Sustainability 10 (1): 98–110.
- Portman, M. E., A. Natapov, and D. Fisher-Gewirtzman. 2015. “To Go Where No Man Has Gone Before: VirtualReality in Architecture, Landscape Architecture and Environmental Planning[J].” Computers, Environment and Urban Systems 54 (11): 376–384. doi:10.1016/j.compenvurbsys.2015.05.001.
- Rong, F. 2016. “Analysis of Evaluation Index of Visual Attraction Elements in Landscape Space by Analytic Hierarchy Process [J].” China Urban Forestry 14 (1): 74–77.
- Roy, A. K., M. N. Akhtar, M. Mahadevappa, R. Guha, and J. Mukherjee. 2020. “A Novel Technique to Develop Cognitive Models for Ambiguous Image Identification Using Eye Tracker[J].” IEEE Transactions on Affective Computing 11 (1): 63–77. doi:10.1109/TAFFC.2017.2768026.
- Tang, J., and Y. Long. 2019. “Measuring Visual Quality of Street Space and Its Temporal Variation: Methodology and Its Application in the Hutong Area in Beijing.” Landscape and Urban Planning 191: 103436. doi:10.1016/j.landurbplan.2018.09.015.
- Torun, A. O., D. Yesiltepe, S. Erten, O. Ozer, T. Gurleyen, and E. Zumbuloglu. 2020. “Measuring the Relationship between Spatial Configuration, Diversity and User Behavior: A Post Occupancy Evaluation Study in Istanbul’s Peripheral Districts.” Journal of Design for Resilience in Architecture and Planning 1 (1): 84–102.
- Min, W., W, Yingxue, H, Haiyan, et al.Visual research of urban open space based on eye movement experimental method – A case study of Guangzhou Huacheng Square [J].Tropical Geography, 2018,38 (6): 5–14
- Wilson, C. J., and S. Alessandro. 2015. “The Use of Virtual Reality in Psychology: ACase Study in Visual Perception[J].” Computational and Mathematical Methods in Medicine 2015: 1–7. doi:10.1155/2015/151702.
- Xin, Y., G. Siting, and S. Yimin. 2018. A review of post-use evaluation (POE) research on the built environment[J] Journal of Shandong Jianzhu University 33(4): 62–69. (in Chinese).
- Xinyi, N., W. Guanshu, and L. Meng. 2019. “Research on the Influence of Built Environment on Street Vigor and Its Temporal and Spatial Characteristics Based on LBS Location Data [J].” Urban Planning International 34 (1): 28–37. doi:10.22217/upi.2018.495.
- Ye, Y., W. Zeng, Q. Shen, X. Zhang, and Y. Lu. 2019. “The Visual Quality of Streets: A Human-centred Continuous Measurement Based on Machine Learning Algorithms and Street View Images.” Environment and Planning B: Urban Analytics and City Science 46: 1439–1457.
- Zhang, L. M., R. X. Zhang, T. S. Jeng, and Z. Y. Zeng. 2019b. “Cityscape Protection Using VR and Eye Tracking Technology[J].” Journal of Visual Communication and Image Representation: 2019, 62–64.
- Zhang, L.-M., R.-X. Zhang, T.-S. Jeng, and Z.-Y. Zeng. 2019a. “Cityscape Protection Using VR and Eye Tracking Technology.” Journal of Visual Communication and Image Representation 64: 102639. doi:10.1016/j.jvcir.2019.102639.
- Zhong, Z., Z. Gu, and X. Jiangjian. 2015. “Overview of Virtual Reality Augmented Technology [J].” Science China Information Science 45 (2): 157–180.
- Zhou, H. 2020. Evaluation of Landscape Visual Quality in Harbin Wetland Park Based on Eye Movement Analysis [D]. Northeast Forestry University.