
 ?Mathematical formulae have been encoded as MathML and are displayed in this HTML version using MathJax in order to improve their display. Uncheck the box to turn MathJax off. This feature requires Javascript. Click on a formula to zoom.
ABSTRACT
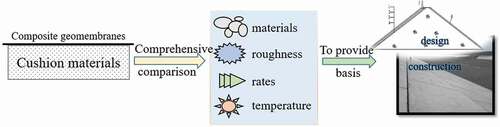
The interfacial friction characteristics of composite geomembranes have a significant impact on the stability of engineering structures. To comprehensively analyze the interfacial friction properties of composite geomembranes and cushion materials, the effects of shear material, roughness, shear rate, and test temperature were studied through laboratory direct shear friction tests. The results show the improved interface friction performance of the composite geomembranes and granular material. With the increase in the particle size of the test material, the friction angle of the plastic film surface decreased, and the friction angle of the cloth interface increased. The rougher the mortar surface, the greater the interfacial friction angle. The faster the shear rate, the larger the interfacial friction angle. The higher the test temperature, the smaller the interfacial friction angle. The research results provide a theoretical basis for the design of anti-seepage forms of dam bodies, and serve as a reference for engineering designers in evaluating the stability of dam slopes.
Graphical Abstract
1. Introduction
Composite geomembranes, one of the main materials for anti-seepage treatment, have been widely used in water conservation projects. The anti-sliding stability of the composite geomembranes and structural surface of the slope directly affects the safety of engineering (Fox and Thielmann Citation2014; Hsieh and Hsieh Citation2003; Shu, Wu, and Jiang Citation2016; Triplett and Fox Citation2001). When evaluating the anti-skid stability of a composite geomembrane impermeable body, the key is to determine the interface friction parameters between the geomembrane and dam cushion material to provide the necessary parameters for anti-skid stability analysis (Gu Citation2002; Shu Citation2015).
Interface friction parameters are often determined using laboratory direct shear friction tests. However, many factors affect the interfacial friction parameters of composite geomembranes. Many scholars (Atapour and Moosavi Citation2014; Cen, He, and Li Citation2017; Ghazizadeh and Bareither Citation2018; Hsieh and Hsieh Citation2003; Markou and Evangelou Citation2018; Mirzaghorbanali, Nemcik, and Aziz Citation2014; Wang et al. Citation2016) have conducted research on direct shear tests on geosynthetics, and analyzed the influence of material properties, size, boundary conditions, and other factors on the test results. Other (Fox and Thielmann Citation2014; Lee, Mannan, and Wan Ibrahim Citation2020; Merry, Bray, and Yoshitomi Citation2005; Xu et al. Citation2008; Xu, Wang, and Wang Citation2010; Xu Citation2011) have conducted experiments to study the interface action characteristics of geosynthetics, and analyzed the influence of interface material testing rules, test rate, and other factors. While employing geosynthetics in engineering applications, changes in the surface roughness of the mortar cushion, difference in the cushion material, and changes in ambient temperature affect the friction performance of the interface between the geosynthetics and the contact surface. Additionally, the effect of shear rate on the interfacial friction properties of geosynthetics must be considered in engineering design. Composite geomembranes have been widely employed as a type of geosynthetic material in water conservation projects. However, numerous factors affect the interfacial friction characteristics of the composite geomembranes; this impacts the performance of the material in practice. To enhance the safety and reliability of application of composite geomembranes in engineering, it is necessary to comprehensively analyze the factors affecting the interfacial friction characteristics of the composite geomembranes. Consequently, a comparative experimental study of the interfacial friction characteristics of the composite geomembranes is imperative for their utilization in engineering applications; it would also provide reliable design parameters.
In this study, the effects of shear materials, mortar roughness, test temperature, and shear rate on the interfacial friction properties were analyzed using laboratory direct shear friction tests. The influence of the interface, temperature, and velocity on the interface friction angle of a composite geomembrane is expounded by analyzing the test results, and some valuable conclusions are drawn.
2. Materials and methods
2.1. Composite geomembranes
The composite geomembranes used in the direct shear friction test is made up of one piece of cloth and one membrane (SN/PE-16.0–0.6-400). The cloth is a staple nonwoven fabric with a mass per unit area of 400 g/m2; the plastic membrane is a black polyethylene PE membrane with a thickness of 0.6 mm. The geotextile and the geomembrane are thermally fused together through a thermal compounding process. Basic performance tests were conducted at 20°C, 30°C, 40°C, 50°C, and 60°C respectively to study the interfacial friction characteristics of composite geomembranes and other structural materials under different temperature conditions. The technical performance is shown in .
Table 1. Technical properties of composite geomembranes.
The mechanical properties of the composite geomembranes sharply reduce when the test temperature rises – particularly above 30°C. The deformation amount is increased at the same time implying that various properties are closely related to the test temperature.
2.2. Shear materials
The granular material used in the shear test was taken from the material yard of a hydraulic engineering and divided into five groups according to the maximum particle size. The maximum particle sizes were 2.5 mm, 5.0 mm, 10 mm, 20 mm, and 40 mm, respectively. The particle size composition of the granular material is shown in .
Table 2. Particle size composition of granular material.
In order to reflect the actual construction situation, the mortar test blocks were sampled from the mortar cushion of a construction site. They are wet-mixed mortar (WM) with a strength grade of M10 that were cut and sampled according to the internal dimensions of the shear box. The difference in roughness of the mortar surface is expressed by the ten-point height of irregularities, Rz. Within the sampling length, Rz is the sum of the average of the five largest contour peak heights, yp, and that of the five largest contour valley depths, yv. A larger Rz implies a rougher surface. The mathematical expression for Rz is as follows:
This was further divided into four constituents denoted as SJ1, SJ2, SJ3, and SJ4; where SJ1 is the smooth surface, with Rz = 0.1 mm, SJ2 is the generally rough surface, with Rz = 0.4 mm, SJ3 is the very rough surface, with Rz = 1.1 mm, SJ4 is a sanded mortar test block, with Rz = 3.4 mm, and the roughness level of the surface of the mortar test block is as SJ1< SJ2< SJ3< SJ4. The mortar test blocks of four different degrees of roughness are shown in .
Figure 1. Mortar test blocks with different surface roughness.
2.3. Methods
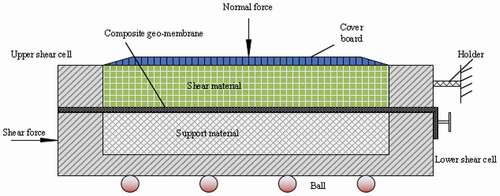
The geomembrane interfacial friction was performed on the TZY-1 geosynthetic material measuring instrument, and the size of the selected shearing box is 200 mm × 200 mm × 50 mm. The geomembrane was fixed on the lower shearing box with retaining clips, and the material in the lower shearing box is made of fine sand. The schematic of the shear test is shown in . The interfacial friction angle of the PE surface and the Geotextile surface (with one piece of cloth and one membrane) was measured followed by applying normal stresses at magnitudes of 50 kPa, 100 kPa, 150 kPa, and 200 kPa. The test was aimed to study the impact of material interface, ambient temperature, and shearing rate on the interfacial friction angle of composite geomembranes; the granular material has different maximum particle sizes and mortar test blocks sampled at the engineering site, and these materials were adopted for the interfacial direct shear test. The representative test temperatures were 20°C, 30°C, 40°C, 50°C, and 60°C, and shearing rates were 0.3 mm/min, 0.5 mm/min, 0.9 mm/min, 2.2 mm/min, and 4.4 mm/min. The interfacial friction angle was measured under these conditions.
Figure 2. Schematic of direct shear test.
The value of the interface friction angle needs to be statistically calculated due to the properties of the composite geomembranes material and the error generated during the test. The average value of the multiple sets of the valid data was used as the test result to ensure the rationality of the value.
3. Results and Discussions
3.1. The effect of shearing material on friction coefficient
According to the differently designed structures, the cushion material used under the composite geomembranes was subjected to direct shear friction tests on the interface formed by different cushion materials in the dam body and the composite geomembranes made up of one piece of cloth and one membrane. The test curves of each interface are shown in . The test results were summarized in , the test temperature was 20°C, and the shearing rate was 0.9 mm/min.
Figure 3. Test curve for PE-particle diameter of 2.5 mm.
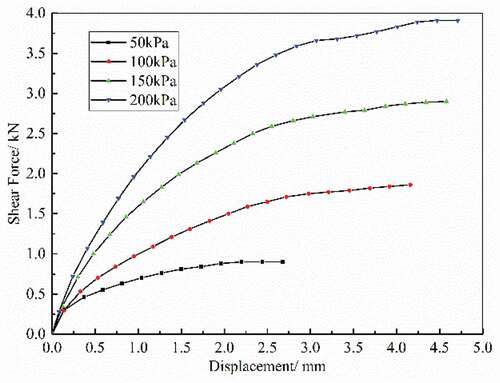
Figure 4. Test curve for G-particle diameter of 2.5 mm.
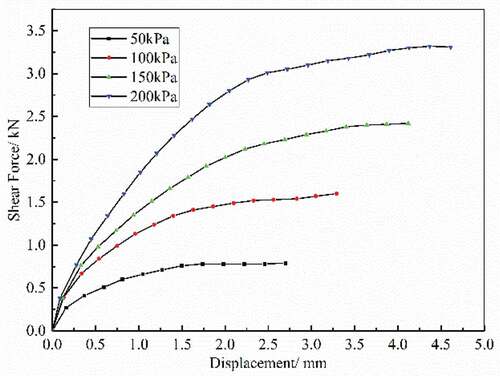
Figure 5. Test curve for PE-particle diameter of 40 mm.
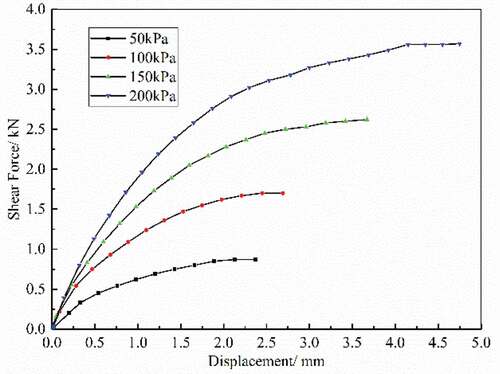
Figure 6. Test curve for G-particle diameter of 40 mm.
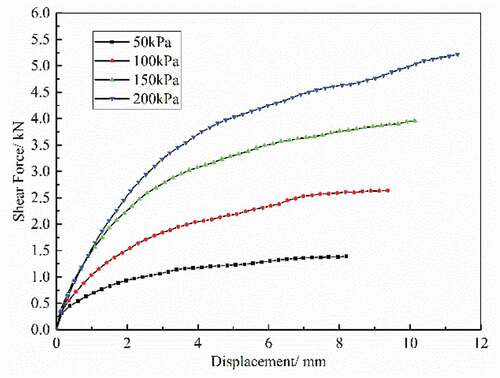
Figure 7. Test curves of shear stress and maximum displacement for PE-granular materials.
Figure 8. Test curves of shear stress and maximum displacement for G-granular materials.
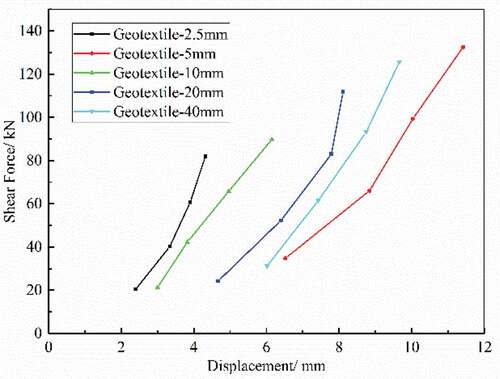
Table 3. Interfacial friction angles of different shear materials.
Table 4. The interface friction angle corresponding to the residual strength.
The interfacial shear of the composite geomembranes and granular material in different particle sizes shows that the shear force value of the PE interface decreases with the increase in particle size of the granular material. The test curve of the PE interface basically remained constant with no obvious change other than a slight change in the displacement amount when shear failure appears between 2 mm and 6 mm. The peak value of the shear force of the Geotextile interface increases significantly with increasing in particle size of the granular material. This shows rapid growth, and the displacement also increases markedly when failure occurs. The shear displacement when the particle size was kept at 2.5 mm varied between 2 mm and 6 mm, and increased to 6 to 12 mm when the particle size increased to 40 mm.
The test results show that the friction angle of the PE interface gradually decreases as particle size increases coupled with a small reduction magnitude. The interfacial friction angle was only reduced by 1.6° from 2.5-mm sand to 40-mm sand gravel. This is basically at the same level implying that the particle size of the shear material has little effect on the friction angle of the PE surface. The geotextile interfacial friction angle increases rapidly with increasing particle size of the shear material. The Geotextile-2.5 mm sand interfacial friction angle was only 24.4°. The interfacial friction angle increased to 32.6° when the particle size increased to 20 mm. The interfacial friction angle was unchanged when the particle size increased to Geotextile-40 mm. For the direct shear test of PE and granular materials, the contact surface of individual particles enlarges as the particle size increases. In addition, the contact particles lessen, and the interfacial friction angle steadily reduce. There is a less contraction to the surface at a larger particle size – there is also a smaller shear resistance.
In the interfacial friction performance test between Geotextile and granular materials, the friction angle increased markedly with increasing particle size. The friction angle stopped increasing when the particle size increased to 20 mm. The friction angle of the Geotextile-20 mm sand gravel interface was 8.2° higher than that of Geotextile-2.5 mm sand interface. The particles of the granular material are mutually intercalated and squeezed within the internal structural arrangement and under the action of the interfacial friction. The adjustable space between the particles made the friction angle and the maximum displacement increase. In the interface between Geotextile and the granular material, the finer particles could be interlaced in the filament of the Geotextile surface with a stronger clamping force and interlocking force. This intensified the interlocking effects and shearing capacity of both materials.
3.2. The impact of roughness of mortar interface on friction coefficient
The interfacial friction angle test was conducted on mortar test blocks of different roughness levels with a test temperature of 20°C and a shearing rate to 0.9 mm/min according to the test specification. The displacement–shear force relationship curve of the PE-SJ1 mortar interface is shown in , and the shearing strength curve in . The displacement–shear force relationship curve of the PE-SJ3 mortar interface is shown in , and the shearing strength curve in . The results of each test are shown in . The interface friction angle corresponding to the residual strenth is shown .
Figure 9. PE-SJ1 interface ΔL-T.
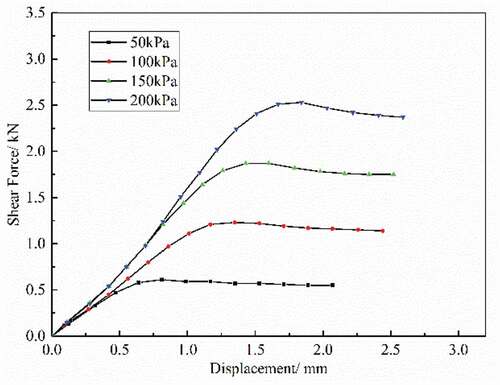
Figure 10. PE-SJ1 interface .
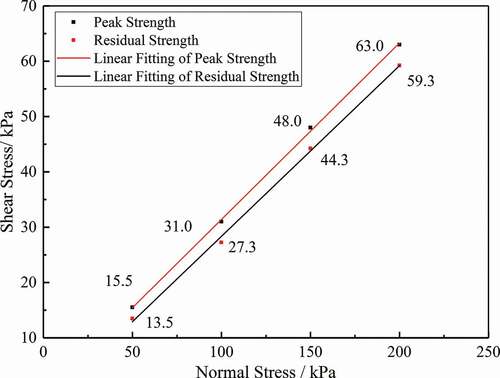
Figure 11. Geotextile-SJ3 interface ΔL-T.
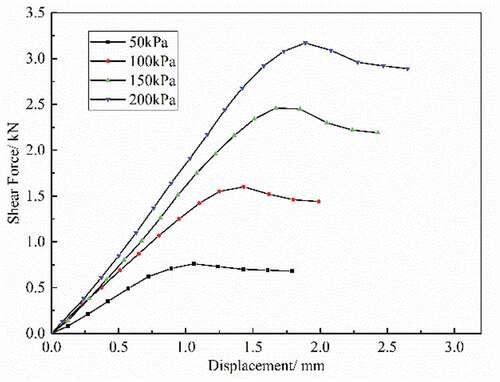
Figure 12. Geotextile-SJ3 interface .
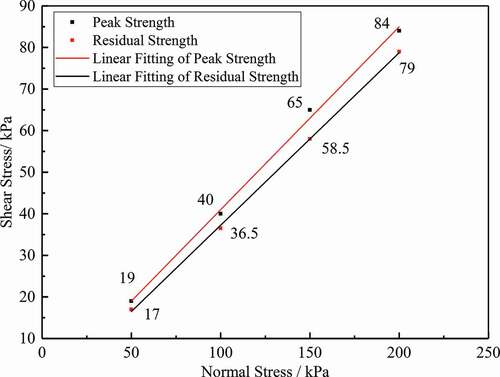
Figure 13. Mortar sample block interface with different roughness values.
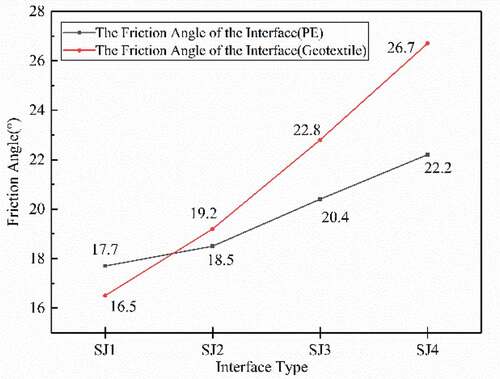
As illustrated by the stress-strain test curve, the shear stress grows continuously with increasing displacement but at a lessening rate. This curve then decreases and stabilizes after reaching the maximum value with an obvious peak strength and relatively stable residual strength. The peak force value corresponds to the maximum static friction force while the residual force value corresponds to the sliding friction force. The peak strength and interfacial friction angle rise steadily with increasing roughness of the mortar test block. In the PE surface, the interfacial friction angle increases sharply from 17.7° to 22.2°. The different roughness levels make the interfacial friction angle increase by 4.5°. On the smooth mortar interface, the interfacial friction angle of the Geotextile surface is lower than that of the PE surface, but it has a greater growth rate. The interfacial friction angle of Geotextile–SJ1 is 16.5°, and the cloth-SJ4 is 26.7° showing an increase of 10.2°. It shows that the interfacial friction angle is closely related to the roughness of the mortar surface.
show that there is a difference between peak and residual shear strength due to the variation between static and sliding friction. In the interface friction test between the composite geomembrane and mortar test block, it is very likely that there is only a partial contact between the two in the shear plane, which is closer to the action of a point load or a small part of the surface load. Therefore, the real peak stress is caused by the joint action of the friction and the biting force, which result from overcoming the roughness of the structural surface of the underlying layer. The shear displacements of mortar test specimen during the shear failure is often accompanied by volumetric expansion. The tendency of mortar joints to dilate, when simultaneously subjected to shear stress and normal compression, increases the shear resistance because it opposes the compression force. This mechanism, known as dilatancy, has already been identified for shear test by various researchers(Andreotti, Graziotti, and Magenes Citation2019, Citation2018; Feng et al. Citation2018; Xiao et al. Citation2012). The rougher the mortar surface, the more obvious the dilatancy is in the direct shear test. The existence of geotextile enhances the force between the molecular chains of the composite geomembrane and mortar test block, and increases the adhesive friction force, which indicates that the rougher the surface of the material, the greater the interfacial friction angle. Therefore, it is not necessary to evenly smear the surface of the mortar if cement mortar is used as the material for the underlying cushion; rather, a certain degree of roughness is recommended. The surface of the mortar cushion cannot be plastered to be too sharpened in case of piercing the geomembrane and reducing anti-seepage effects. These can help improve the structural stability of the dam.
The residual friction angle of the PE surface is reduced by 1.3° on average versus the peak friction angle (). The residual friction angle of the Geotextile surface is reduced by 1.0° on average relative to the peak friction angle. On the PE surface, the interfacial friction angle formed by the mortar test blocks is only 74% of the average value of the interfacial friction angle of the granular material. The interfacial friction angle of PE-SJ1 with a maximum difference is 9.6° smaller than that of the PE-2.5 mm size particle. The interfacial friction angle of the Geotextile surface forms with the mortar test block and is only 75% of the average interfacial friction angle of the granular material. The angle with the maximum difference of Geotextile-SJ1 is 16.1° smaller than the Geotextile-40 mm particle size. In the interfacial friction, the mortar test block only reflects the frictional properties between the two materials. The frictional force should also include the mutual clamping force and friction force the particles of the granular mixtures have to overcome in relative displacement and movement emerge under the action of external forces during interfacial friction with the granular material in addition to the frictional properties between the two materials. This indicates that the granular material and the composite geomembranes have superior interfacial friction properties.
3.3. The impact of shearing rate on interfacial friction angle
Next, in order to investigate the impact of shearing rate on the interfacial friction angle, experiments were conducted at different shearing rates for analyses with the mortar test block on the SJ2 surface of the shear material. Conditions included sand gravel with a particle size of 20 mm and a test temperature of 20°C. The experimental results of the friction angle at different shearing rates are shown in . The relationship between shear rate and interface friction angle is shown in .
Figure 14. Curve of the relationship between shear rate and interface friction angle.
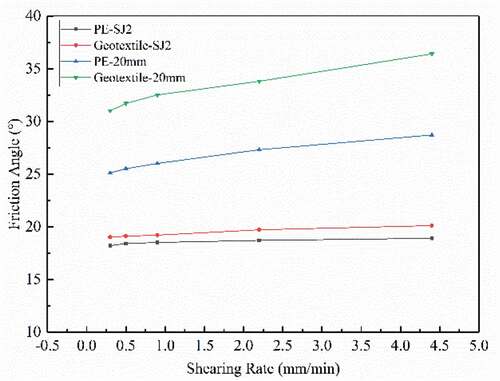
Table 5. Interface friction angle at different shear rates.
The shear stress–displacement relationship curve suggests that minor variation can be observed in the interfacial friction angle of the composite geomembranes and SJ2 when the shearing rate lies between 0.3–4.4 mm/min indicating that shearing rate has little impact on the shearing strength of mortar interface. The rigid material has little effect on the shearing strength only if it lies within a certain variation range of shearing rate. This is quite consistent with prior work on rigid materials. The interfacial shear test curve of the composite geomembranes and the granular material shows that the shearing strength of interfacial friction increases as the shearing rate grows. The friction angle and the peak value of the interfacial shear stress also increases but with a lower rate of growth. This is because the particle displacement can be fully directionally aligned when the shearing rate is small. These results in weaker friction and interlocking effects of the soil particles on the geomembrane interface along with reduced peak strength of the shearing strength. When the shearing rate increases, the soil particle test specimen is not fully aligned so the relative force between the materials is enhanced producing great frictional forces. After the rate increases from 0.3 mm/min to 4.4 mm/min, the interfacial friction angle of the PE surface increased by 3.6°, and the Geotextile surface increased by 5.4°. The interfacial friction angles of the granular mixtures are closely related the shearing rate, which basically concurs with the shearing strength of the granular material as described(Atapour and Moosavi Citation2014; Liu et al. Citation2017; Mirzaghorbanali, Nemcik, and Aziz Citation2014; Wang et al. Citation2016). When designing the slope of the dam body, the influence of shearing rate on the interfacial friction angle should be comprehensively considered; it is better to choose a relatively small shearing rate to ensure the safety and stability of the dam structure.
3.4. The impact of temperature on interfacial friction angle
The composite geomembranes is influenced by temperature and displays marked changes in its basic mechanical properties. These changes confirm its temperature-sensitive nature. This experiment uses SJ2 surface mortar blocks and 20 mm gravel. It explores the variation of friction coefficient under different temperatures, and the results are as shown in with a shearing rate of 0.9 mm/min. The relationship between temperature and interface friction angle is shown in .
Figure 15. Curve of the relationship between temperature and interface friction angle.
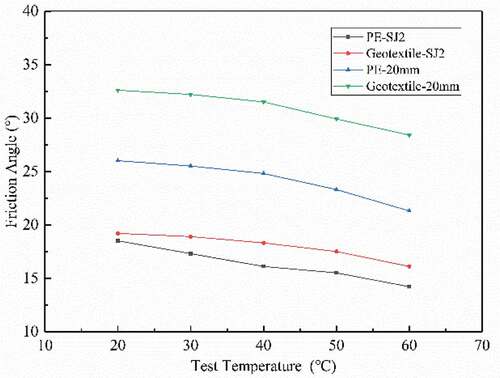
Table 6. Influence of temperature on the interface friction angle.
The data show that the interfacial friction angle decreases with continuous increase in test temperature. The friction coefficient decreases sharply when the test temperature is 60°C. When the temperature rises to 60°C, the PE – SJ2 interfacial friction angle is reduced by 4.3°, the Geotextile-SJ2 interfacial friction angle is reduced by 3.1°, the PE-sand gravel interfacial friction angle is reduced by 4.7°, and the Geotextile-sand gravel interfacial friction angle is reduced by 4.2°. The decrease is obvious indicating that the shearing strength of composite geomembranes is obviously related to the test temperature, which is consistent with the research fruits of other scholars on the impact of temperature on the composite geomembranes (Akpinar and Benson Citation2005; Koerner and Koerner Citation2006; Merry, Bray, and Yoshitomi Citation2005). The increase in test temperature obviously lessens the interface friction angle. When determining the interfacial friction angle, we suggest that the maximum ambient temperature of the project area should be fully considered. The most unfavorable temperature for engineering stability should be used as the test temperature to reduce the value of the interfacial friction angle. This can increase dam slope stability.
4. Conclusion
The indoor direct shear test was adopted to study the interfacial friction angle of the PE surface and Geotextile surface of composite geomembranes under different test conditions. The results are as follows:
1. The shear stress and shear strain of the geomembrane under contact demonstrated an obvious nonlinear relationship. The shear stress steadily increased as the shear deformation increased; this occurred at a gradually reducing rate of growth. The shear stress was stable after reaching the peak value (when contact was made at the interface between the geomembrane and the granular material). The shear stress decreased slightly when the peak value was reached in the interfacial friction test with the rigid structure.
2. The test material, surface roughness, test temperature, and shearing rate have different levels of impact on the interfacial friction angle of the composite geomembranes. With an increase in temperature, the friction angle decreases. The higher the shear rate, the higher the interfacial friction angle; however, the increase is small. In the interface contact with granular material, the friction angle is related to the particle size of the material being sheared. The test material had the greatest effect on the interfacial friction angle, and the shear rate had the least effect on the interfacial friction angle.
3. While designing the anti-seepage structural forms of geomembrane, the influence of the cushion material and ambient temperature on the slope stability should be considered. If a mortar is used as a cushion layer, then the mortar surface must be rough to enhance the forces between the interfaces. Thus, the dam body is stable. If the granular material is used as the cushion material, then the contact form where the geotextile surface is facing downward and coming in contact with the granular material should be adopted. The particle size of the granular material was no less than 10 mm. This can increase the safety factor of the stability of the dam slope, reduce the workload, and is economically viable.
In summary, the direct shear friction test used in this study provided reasonable test results for different composite geomembranes–cushion interfaces. The contrast between the present and previous studies for composite geomembranes–cushion materials interfaces can provide scientific guidance for engineering design and construction. Further investigation on the shear creep properties of composite geomembranes–cushion material interfaces is still needed using laboratory tests and theoretical analysis.
Acknowledgments
We would like to thank Editage (www.editage.cn) for English language editing.
Date availability statement
All data, models, and code generated or used during the study appear in the submitted article.
Additional information
Funding
Notes on contributors
Wu Yang
Wu Yang, male, PhD candidate, Xinjiang Agricultural University.
Kebin Shi
Kebin Shi, male, Doctoral supervisor, Xinjiang Agricultural University.
Jianxin He
Jianxin He, male, associate professor, Xinjiang Agricultural University.
References
- Akpinar, M. V., and C. H. Benson. 2005. “Effect of Temperature on Shear Strength of Two Geomembrane-geotextile Interfaces.” Geotextiles and Geomembranes 23 (5): 443–453. doi:10.1016/j.geotexmem.2005.02.004.
- Andreotti, G., F. Graziotti, and G. Magenes. 2018. “Detailed Micro-modelling of the Direct Shear Tests of Brick Masonry Specimens: The Role of Dilatancy.” Engineering Structures 168: 929–949. doi:10.1016/j.engstruct.2018.05.019.
- Andreotti, G., F. Graziotti, and G. Magenes. 2019. “Expansion of Mortar Joints in Direct Shear Tests of Masonry Samples: Implications on Shear Strength and Experimental Characterization of Dilatancy.” Materials and Structures 52 (4): 1–16. doi:10.1617/s11527-019-1366-5.
- Atapour, H., and M. Moosavi. 2014. “The Influence of Shearing Velocity on Shear Behavior of Artificial Joints.” Rock Mechanics and Rock Engineering 47 (5): 1745–1761. doi:10.1007/s00603-013-0481-9.
- Cen, W. J., H. N. He, and D. J. Li. 2017. “Influence of Geomembrane Defect on Seepage Property of Earth-rock Dams and Measures of Seepage Control.” Advances in Science and Technology of Water Resources 37: 61–71.
- Feng, S. J., X. Liu, H. X. Chen, and T. Zhao. 2018. “Micro-mechanical Analysis of Geomembrane-sand Interactions Using DEM.” Computers and Geotechnics 94: 58–71. doi:10.1016/j.compgeo.2017.08.019.
- Fox, P. J., and S. S. Thielmann. 2014. “Interface Shear Damage to a HDPE Geomembrane. II: Gravel Drainage Layer.” Journal of Geotechnical and Geoenvironmental Engineering 140: 1–12.
- Ghazizadeh, S., and C. A. Bareither. 2018. “Stress-controlled Direct Shear Testing of Geosynthetic Clay Liners II: Assessment of Shear Behavior.” Geotextiles and Geomembranes 46 (5): 667–677. doi:10.1016/j.geotexmem.2018.06.004.
- Gu, G. C. 2002. “Review of Dams and Dikes with Composite Geomembrane Impervious Structure.” Water Resources and Hydropower Engineering 33: 26–32.
- Hsieh, C., and M. W. Hsieh. 2003. “Load Plate Rigidity and Scale Effects on the Frictional Behavior of Sand/Geomembrane Interfaces.” Geotextiles and Geomembranes 21 (1): 25–47. doi:10.1016/S0266-1144(02)00034-1.
- Koerner, G. R., and R. M. Koerner. 2006. “Long-term Temperature Monitoring of Geomembranes at Dry and Wet Landfills.” Geotextiles and Geomembranes 24 (1): 72–77. doi:10.1016/j.geotexmem.2004.11.003.
- Lee, S. L., M. A. Mannan, and W. H. Wan Ibrahim. 2020. “Shear Strength Evaluation of Composite Pavement with Geotextile as Reinforcement at the Interface.” Geotextiles and Geomembranes 48 (3): 230–235. doi:10.1016/j.geotexmem.2019.11.002.
- Liu, T. T., J. C. Li, H. B. Li, X. P. Li, and N. N. Li. 2017. “Influence of Shearing Velocity on Shear Mechanical Properties of Planar Filled Joints.” Rock and Soil Mechanics 38: 1967–1973.
- Markou, I. N., and E. D. Evangelou. 2018. “Shear Resistance Characteristics of Soil–Geomembrane Interfaces.” International Journal of Geosynthetics and Ground Engineering 4 (4): 1–16. doi:10.1007/s40891-018-0146-6.
- Merry, S. M., J. D. Bray, and S. Yoshitomi. 2005. “Axisymmetric Temperature- and Stress-dependent Creep Response of ‘New’ and ‘Old’ HDPE Geomembranes.” Geosynthetics International 12 (3): 156–161. doi:10.1680/gein.2005.12.3.156.
- Mirzaghorbanali, A., J. Nemcik, and N. Aziz. 2014. “Effects of Shear Rate on Cyclic Loading Shear Behaviour of Rock Joints under Constant Normal Stiffness Conditions.” Rock Mechanics and Rock Engineering 47 (5): 1931–1938. doi:10.1007/s00603-013-0453-0.
- Shu, Y. M. 2015. “Progress in Geomembrane Barriers for Seepage Prevention in Reservoirs and Dams in China.” Advances in Science and Technology of Water Resources 35: 20–26.
- Shu, Y. M., H. M. Wu, and X. Z. Jiang. 2016. “The Development of Anti-seepage Technology with Geomembrane on Reservoirs and Dams in China.” Yantu Gongcheng Xuebao/Chinese Journal of Geotechnical Engineering 38: 1–9.
- Triplett, E. J., and P. J. Fox. 2001. “Shear Strength of HDPE Geomembrane/Geosynthetic Clay Liner Interfaces.” Manager 127: 543–552.
- Wang, G., X. Zhang, Y. Jiang, X. Wu, and S. Wang. 2016. “Rate-dependent Mechanical Behavior of Rough Rock Joints.” International Journal of Rock Mechanics and Mining Sciences 83: 231–240. doi:10.1016/j.ijrmms.2015.10.013.
- Xiao, Z., W. Xu, Y. Deng, and F. Tu. 2012. “Numerical Simulation of Interface Softening for Large Size Direct Shear Test.” Advanced Materials Research 368–373: 3230–3235.
- Xu, C., X. Y. Liao, G. B. Ye, and L. Z. Bin. 2008. “Research on Interface Frictional Characteristics of Geosynthetics by Laboratory Shear Tests.” Rock and Soil Mechanics 29: 1285–1289.
- Xu, S. F. 2011. “Experiment and Evaluation on Temperature Sensitivities and Tensile Forces of Anti-seepage Geomembrane of Farmland Irrigation Canal.” Transactions of the CSAE 27: 7–11.
- Xu, S. F., G. C. Wang, and Z. Wang. 2010. “Evaluation of Tensile Forces of Geomembrane Placed on Waste Landfill Slope Due to Temperature Variation and Filling Height.” Rock and Soil Mechanics 31: 3120–3124.